


1. Introduction
Rayleigh waves are seismic surface waves which travel along the Earth's surface with particle displacements with elliptical, typically retrograde motions (e.g., Aki and Richards, Reference Aki and Richards2002). Ellipticity is the ratio of the horizontal-to-vertical axis of the Rayleigh wave particle motion and under ray theoretical assumptions has been shown to be dependent on the subsurface structure directly below the seismic station (e.g., Ferreira and Woodhouse, Reference Ferreira and Woodhouse2007). Ellipticity measurements are a powerful tool for characterising the subsurface in regions of sparse or limited seismic station coverage e.g., polar regions and are particularly responsive to the near surface structure of the Earth. The sensitivity of the ellipticity measurements are wave frequency dependent with higher frequencies having greater sensitivity to the near surface (e.g, Berbellini and others, Reference Berbellini, Schimmel, Ferreira and Morelli2019).
Rayleigh wave ellipticity from ambient noise vibrations, often also called H/V (Horizontal-to-Vertical ratio of seismic ground motion) have been used for decades by engineers and geophysicists for soil characterisation, seismic microzonation, the estimation of near surface site effects (e.g., Fäh and others, Reference Fäh, Kind and Giardini2003; Bonnefoy-Claudet and others, Reference Bonnefoy-Claudet2006; Maresca and others, Reference Maresca, Galluzzo and Del Pezzo2006; Poggi and others, Reference Poggi, Fäh, Burjanek and Giardini2012; Hobiger and others, Reference Hobiger2013; Pastén and others, Reference Pastén2016) and has seen increasing application in glaciological settings to determine ice thickness, the seismic velocities of the ice and firn properties (e.g., Lévêque and others, Reference Lévêque, Maggi and Souriau2010; Picotti and others, Reference Picotti, Francese, Giorgi, Pettenati and Carcione2017; Yan and others, Reference Yan2018; Köhler and others, Reference Köhler, Maupin, Nuth and van Pelt2019; Preiswerk and others, Reference Preiswerk, Michel, Walter and Fäh2019; Yan and others, Reference Yan, Li, Li, Yang and Hao2020; Chaput and others, Reference Chaput, Aster, Karplus and Nakata2022). Traditionally, the spectral amplitude method of Nakamura (Reference Nakamura1989) has been used to calculate H/V ratios from the Earth's ambient noise due to its stability, reliability and ease of implementation (Nakamura, Reference Nakamura2019). However, a key assumption of the method is that the ambient noise field is dominated by Rayleigh waves which is rarely true, with the potential for H/V ratios to be strongly affected by other seismic phases such as Love waves (e.g., Bonnefoy-Claudet and others, Reference Bonnefoy-Claudet, Köhler, Cornou, Wathelet and Bard2008; Maranò and others, Reference Maranò, Hobiger and Fäh2017; Sánchez-Sesma and others, Reference Sánchez-Sesma2019). A number of alternative methods have been developed to suppress contributions from body and Love waves on the H/V estimates (e.g., Hobiger and others, Reference Hobiger, Bard, Cornou and Le Bihan2009; Poggi and others, Reference Poggi, Fäh, Burjanek and Giardini2012; Hobiger and others, Reference Hobiger, Cornou, Bard, Le Bihan and Imperatori2016; Maranò and others, Reference Maranò, Hobiger and Fäh2017; Berbellini and others, Reference Berbellini, Schimmel, Ferreira and Morelli2019). Berbellini and others (Reference Berbellini, Schimmel, Ferreira and Morelli2019) developed an approach which uses the polarisation properties of Rayleigh waves to identify and extract them from the Earth's ambient seismic noise field. The ellipticity is subsequently computed on the extracted Rayleigh waves avoiding the issue of contamination from other seismic phases (e.g., Bonnefoy-Claudet and others, Reference Bonnefoy-Claudet, Köhler, Cornou, Wathelet and Bard2008; Maranò and others, Reference Maranò, Hobiger and Fäh2017; Sánchez-Sesma and others, Reference Sánchez-Sesma2019).
Once estimated, the ellipticity measurements can be inverted for the 1-D vertical profiles of seismic velocities (Vp and Vs) and density directly beneath each station. The non-linear inverse problem is solved by minimising the difference between the measured ellipticity and theoretical estimates which are usually computed using the propagator method (e.g, Aki and Richards, Reference Aki and Richards2002) or normal mode approaches (e.g., Berbellini and others, Reference Berbellini, Schimmel, Ferreira and Morelli2019; Jones and others, Reference Jones2021). Alternatively, approaches based on a diffuse seismic wavefield can incorporate other seismic phases into the forward modelling allowing for H/V measurements made using the spectral amplitude method of Nakamura (Reference Nakamura1989) to be inverted (e.g., García-Jerez and others, Reference García-Jerez, Piña-Flores, Sánchez-Sesma, Luzón and Perton2016; Yan and others, Reference Yan2018; Köhler and others, Reference Köhler, Maupin, Nuth and van Pelt2019; Preiswerk and others, Reference Preiswerk, Michel, Walter and Fäh2019). Due to the non-linear nature of the inversion, a Monte Carlo approach is typically used to effectively sample the parameter space (e.g., Berbellini and others, Reference Berbellini, Schimmel, Ferreira and Morelli2019; Jones and others, Reference Jones2021).
In this paper, we give a brief overview of the newly developed DOP-E method of Berbellini and others (Reference Berbellini, Schimmel, Ferreira and Morelli2019) which extracts Rayleigh waves from the Earth's ambient noise before computing the corresponding ellipticity. We give an overview of how these extracted Rayleigh waves can be used to track the formation and retreat of sea ice before describing the use of ellipticity to characterise the subglacial geology of Greenland. Finally, we suggest some further research directions and applications of Rayleigh waves and associated ellipticity measurements.
2. Degree-of-polarisation method
The method developed by Berbellini and others (Reference Berbellini, Schimmel, Ferreira and Morelli2019) named DOP-E builds upon the degree-of-polarisation (DOP) method of Schimmel and Gallart (Reference Schimmel and Gallart2003, Reference Schimmel and Gallart2004); Schimmel and others (Reference Schimmel, Stutzmann, Ardhuin and Gallart2011) to identify and extract Rayleigh waves from seismic recordings. It performs a frequency-dependent moving window Eigen-decomposition on spectral matrices containing time-frequency representations of three-component seismograms (Schimmel and Gallart, Reference Schimmel and Gallart2003, Reference Schimmel and Gallart2004; Schimmel and others, Reference Schimmel, Stutzmann, Ardhuin and Gallart2011). This approach allows for the instantaneous semi-major and semi-minor axis of the best fitting ellipse to the data to be calculated. The vector product of the semi-major and semi-minor axes is used to define the planarity vector which should closely match the expected elliptical particle motion of the fundamental mode Rayleigh wave (Schimmel and Gallart, Reference Schimmel and Gallart2003, Reference Schimmel and Gallart2004; Schimmel and others, Reference Schimmel, Stutzmann, Ardhuin and Gallart2011; Sergeant and others, Reference Sergeant2013). The DOP is then defined as the projection of the instantaneous planarity on the mean planarity vector of the frequency dependent window and varies between 0 and 1, where 0 indicates randomly changing polarisation and 1 is a stable polarisation measurement throughout the data window (Schimmel and Gallart, Reference Schimmel and Gallart2003, Reference Schimmel and Gallart2004; Schimmel and others, Reference Schimmel, Stutzmann, Ardhuin and Gallart2011; Sergeant and others, Reference Sergeant2013; Berbellini and others, Reference Berbellini, Schimmel, Ferreira and Morelli2019). The method assumes that the Rayleigh wave particle motion is retrograde permitting the calculation of the back azimuth of the signal from the station to the source (Schimmel and others, Reference Schimmel, Stutzmann, Ardhuin and Gallart2011; Sergeant and others, Reference Sergeant2013; Berbellini and others, Reference Berbellini, Schimmel, Ferreira and Morelli2019). Finally, the ellipticity of the extracted Rayleigh waves is estimated as a function of frequency and can subsequently be used in inversions for subsurface structure (e.g., Berbellini and others, Reference Berbellini, Schimmel, Ferreira and Morelli2019; Jones and others, Reference Jones2021)
3. Current applications
3.1. Tracking sea ice formation and breakup
The Earth's ambient noise is ubiquitous and displays similar features around the globe. Specifically, the seismic noise spectra exhibit two prominent peaks corresponding to primary (T~10–20 s) and secondary microseisms (T~1–10 s) (e.g., Sergeant and others, Reference Sergeant2013; McNamara and Boaz, Reference McNamara, Boaz, Nakata, Gualtieri and Fichtner2019). These microseisms are generated through the interaction of ocean gravity waves with the ocean bottom resulting in the production of seismic waves (e.g., Longuet-Higgins, Reference Longuet-Higgins1950; Hasselmann, Reference Hasselmann1963; Ardhuin and others, Reference Ardhuin, Gualtieri, Stutzmann, Nakata, Gualtieri and Fichtner2019). Primary microseisms arise in shallow water from the breaking or shoaling waves and have periods equal to the generative ocean swell whilst secondary microseisms are generated through the non-linear interaction of ocean waves and can occur in both deep and shallow waters with periods equal to half that of the ocean wave (e.g., Hasselmann, Reference Hasselmann1963; Ardhuin and others, Reference Ardhuin, Gualtieri, Stutzmann, Nakata, Gualtieri and Fichtner2019; McNamara and Boaz, Reference McNamara, Boaz, Nakata, Gualtieri and Fichtner2019). Typically, Rayleigh and Love waves are the dominant seismic waves observed at microseismic periods (e.g., Longuet-Higgins, Reference Longuet-Higgins1950; Hasselmann, Reference Hasselmann1963; Ardhuin and others, Reference Ardhuin, Gualtieri, Stutzmann, Nakata, Gualtieri and Fichtner2019).
The presence of sea ice can affect the power of microseisms by inhibiting and dampening ocean waves (Stutzmann and others, Reference Stutzmann, Schimmel, Patau and Maggi2009; Grob and others, Reference Grob, Maggi and Stutzmann2011; Tsai and McNamara, Reference Tsai and McNamara2011; Anthony and others, Reference Anthony2014; McNamara and Boaz, Reference McNamara, Boaz, Nakata, Gualtieri and Fichtner2019). For example, Stutzmann and others (Reference Stutzmann, Schimmel, Patau and Maggi2009) correlated a reduction in both primary and secondary microseisms at the seismic station Dumont D'Urville in Antarctica with the formation of nearby sea ice. Tsai and McNamara (Reference Tsai and McNamara2011) showed similar results from Alaska where the bandwidth and power of the microseisms are reduced in winter due to the dampening of ocean waves by sea ice.
Sergeant and others (Reference Sergeant2013) and Jones and others (Reference Jones2021) used the DOP method to extract Rayleigh waves in the secondary microseismic frequency band from stations in Greenland and in the North Atlantic. Using the back-azimuth of the incoming Rayleigh waves the sources of these microseisms were determined. These sources showed a strong time and frequency variability where the predominant source of the microseisms are storms in the Irminger Sea and Denmark Strait in the North Atlantic (Sergeant and others, Reference Sergeant2013) (Fig. 1) with frequencies of ~0.1−0.2 Hz. During the summer higher frequency (~0.2−0.3 Hz) microseisms are seen in the direction of the Labrador Sea and Baffin Bay in response to sea ice retreat. The retreat of the sea ice allows for short period ocean waves to interact with the shallower water in the Labrador Sea and Baffin Bay resulting in higher frequency microseisms (Fig. 1). As the sea ice begins to form during the Autunm months the higher frequency microseisms in the Labrador Sea and Baffin Bay become weaker with the dominant source of Rayleigh waves returning to the Irminger Sea and the Denmark Strait in the North Atlantic.

Fig. 1. Polar histograms of the monthly polarisation direction as a function of frequency (0.1–0.3 Hz) of measured Rayleigh waves at SFJD station (Søndre Strømfjord, now Kangerlussuaq) for January, June and December 2012. Note the change in Rayleigh wave source direction and frequency content between June and the winter months (January and December).
3.2. Characterisation of the subglacial geology
Subglacial geology and conditions greatly control glaciers and ice sheets flow. However, the subglacial geology of Greenland is poorly understood primarily due to the presence of the ice sheet and the logistical difficulty of conducting geophysical surveys sampling the crust. Tomographic imaging using both earthquakes (e.g., Darbyshire and others, Reference Darbyshire, Dahl-Jensen, Larsen, Voss and Joyal2018; Lebedev and others, Reference Lebedev, Schaeffer, Fullea and Pease2018; Pourpoint and others, Reference Pourpoint, Anandakrishnan and Ammon2018; Toyokuni and others, Reference Toyokuni, Matsuno and Zhao2020) and ambient noise (e.g., Antonijevic and Lees, Reference Antonijevic and Lees2018; Mordret, Reference Mordret2018) has produced detailed images of the crust at depths >5 km due to a lack of local seismicity and large distances between seismic stations.
As explained previously, high frequency Rayleigh wave ellipticity extracted from the Earth's ambient noise is sensitive to the shallow (<5 km) structure of the Earth crust making them ideally suited to characterise subglacial geology of Greenland (e.g., Berbellini and others, Reference Berbellini, Schimmel, Ferreira and Morelli2019). Jones and others (Reference Jones2021) applied the DOP-E method to extract Rayleigh waves and compute their ellipticity from all available permanent seismic stations in Greenland for the period of 2012–2018 in a first attempt to characterise the seismic structure of Greenland at depth <5 km. Annual ellipticity curves were computed by calculating the mean and standard deviation of the distribution of the ellipticity measurements for each year. The elliptcity curves were then inverted using the Monte-Carlo based Neighbourhood Algorithm (Sambridge, Reference Sambridge1999) to generate 1-D seismic shear-wave velocity (Vs) profiles directly beneath each station.
Jones and others (Reference Jones2021) showed that low seismic velocities correlate with large glaciers of Jakobshavn, Helheim and Kangerdlussuaq and regions of elevated heat flux as proposed by Martos and others (Reference Martos2018). Jones and others (Reference Jones2021) inferred that the low seismic velocities within the interior of the ice sheet are the subglacial expression of the Iceland hotspot track that traversed Greenland ~80−50 Ma and controls the onset of fast ice flow for the North East Greenland Ice Stream and Petermann Glacier. This work highlights how seismic observations can provide much needed constraints on the subglacial geology and the importance of interactions between the solid Earth and overlying ice sheet.
Unique to the study of Jones and others (Reference Jones2021) was the use of ellipticity to characterise the subglacial geology as opposed to the ice-sheet seismic velocity or thickness as done in previous studies using H/V ratios (e.g., Lévêque and others, Reference Lévêque, Maggi and Souriau2010; Picotti and others, Reference Picotti, Francese, Giorgi, Pettenati and Carcione2017; Yan and others, Reference Yan2018; Köhler and others, Reference Köhler, Maupin, Nuth and van Pelt2019; Preiswerk and others, Reference Preiswerk, Michel, Walter and Fäh2019; Yan and others, Reference Yan, Li, Li, Yang and Hao2020). Moreover, the study of Jones and others (Reference Jones2021) performed the calculation of horizontal-to-vertical amplitude ratios on extracted Rayleigh waves as a function of frequency to produce ellipticity curves as opposed to the traditional approach which calculates the spectral H/V ratio from windows of ambient noise.
4. Future applications
Figure 2 compares ellipticity summary statistics (mean and standard deviation) estimated using measurements made on all available seismic data from 2015 with fundamental mode Rayleigh wave predictions obtained using a normal mode approach (Herrmann, Reference Herrmann2013) and the model of Jones and others (Reference Jones2021) at the on-ice station DY2G in Greenland. There is a clear deviation between the predictions and observations at periods which are sensitive to the ice thickness (T < 2.5 s). Similar deviations at ice sensitive periods were observed at Concordia station in Antarctica by Berbellini and others (Reference Berbellini, Schimmel, Ferreira and Morelli2019). Berbellini and others (Reference Berbellini, Schimmel, Ferreira and Morelli2019) showed that a single ice layer model was insufficient to account for this discrepancy between the predictions and observed data and that an additional near surface layer was required. Therefore, Rayleigh wave ellipticity measurements can provide insight on the internal structure of the ice in addition to the ice thickness. Additionally, ellipticity has also been shown to be sensitive to thin subglacial layers such as sediment or water which are important to understanding enhanced ice flow (Berbellini and others, Reference Berbellini, Schimmel, Ferreira and Morelli2019; Jones and others, Reference Jones2021).
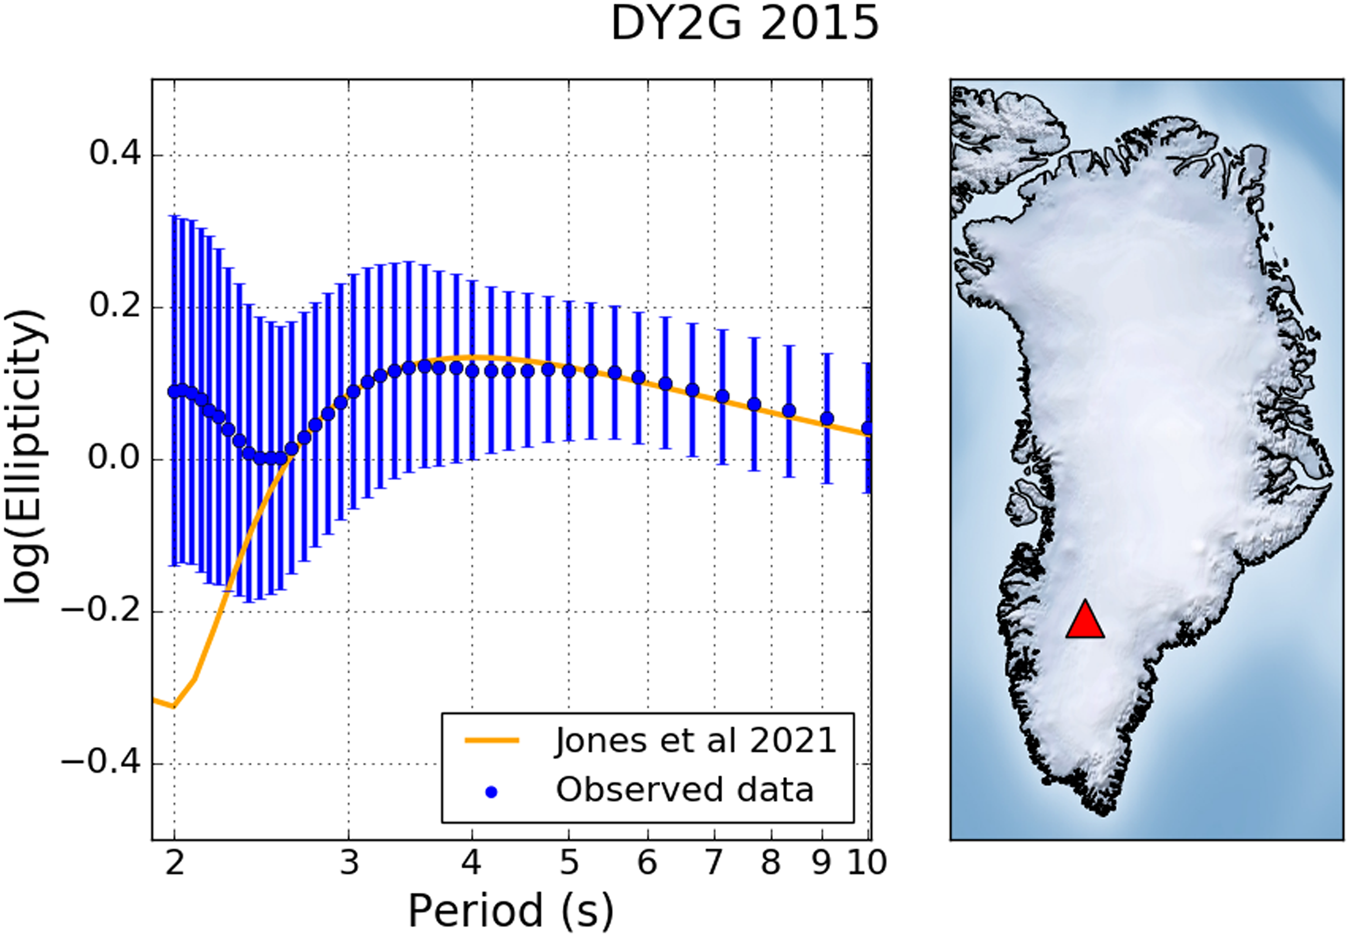
Fig. 2. Left: Comparison of ellipticity measurements as a function of period (blue dots and associated error bars) for on-ice station DY2G and fundamental mode fundamental mode predictions (orange line) calculated using the model of Jones and others (Reference Jones2021). Right: Map of Greenland with the location of DY2G (red triangle).
However, care should be taken at glaciers with ice thicknesses ≤500 m where ellipticity measurements with periods of ≤2 s are necessary to constrain the ice structure. At these short periods, the seismic noise can be highly complex containing surface wave overtones, trapped waves and reflections and also may be influenced by resonances related to the geometry of the glacier or valley (Preiswerk and others, Reference Preiswerk, Michel, Walter and Fäh2019). Since the DOP-E method uses the polarisation properties of the Rayleigh waves to extract them from the Earth's ambient noise, the influence of the wavefield complexity on the measured ellipticities should be minimised, however, discriminating between the fundamental mode Rayleigh waves and overtones could prove challenging. Further analysis is needed to determine the stability of the DOP-E method for determining the ice structure of mountain glaciers.
As shown in the previous section, microseismic Rayleigh waves are sensitive to the presence of sea ice (e.g., Stutzmann and others, Reference Stutzmann, Schimmel, Patau and Maggi2009; Grob and others, Reference Grob, Maggi and Stutzmann2011; Tsai and McNamara, Reference Tsai and McNamara2011; Anthony and others, Reference Anthony2014; McNamara and Boaz, Reference McNamara, Boaz, Nakata, Gualtieri and Fichtner2019; Sergeant and others, Reference Sergeant2013) and offer an approach to monitor and understand the seasonal variability in sea ice formation and breakup. In particular, it may be possible to use the DOP method to identify Rayleigh waves (or other seismic phases) with characteristic signatures and events such as changes in amplitude and back-azimuths associated with the cracking of sea ice (Kaminuma, Reference Kaminuma1994). Glacier and ice sheets near-surface and subglacial environments also undergo dramatic seasonal variations which should also have a significant effect on the ellipticity measurements at periods sensitive to ice. Seasonal variations in ellipticity could then be used to characterise and monitor changes in the near-surface firn. In addition, a number of seismic stations deployed in polar regions have long deployment histories (e.g., Concordia station in Antarctica which was installed in 1982) and can offer annual and decadal insights into the variability of sea ice and the state of the glacier. Finally, the installation of passive seismic instruments in polar regions is relatively quick and cheap when compared to lengthy active geophysical field campaigns and offers a convenient method of continuous in-situ monitoring of glaciers, ice sheets and sea ice.
Acknowledgements
G.A.J. is funded through the by the Sêr Cymru II Program in Low Carbon Energy and the Environment (European Regional Development Fund and Welsh European Funding Office; Project number 80761-SU-SU093). A.M.G.F. is grateful to support from NERC grant NE/N011791/1. M.S. thanks SANIMS (RTI2018-095594-B-I00). This project has received funding from the European Research Council (ERC) under the European Union's Horizon 2020 research and innovation program (grant agreement No 101001601). The authors would like to thank an anonymous reviewer and Douglas MacAyeal for their constructive comments and suggestions for the manuscript.


 Open access