1. Introduction
The Antarctic ice sheet is by far the largest glacier system on Earth. At present, air temperatures are so low that surface melting and run-off are virtually negligible, and the ice sheet loses its mass primarily by calving of icebergs and basal melting beneath ice shelves. Under these conditions, the size of the ice sheet is mainly limited by the depth of the surrounding ocean. Despite this apparent robustness, the potential behaviour of the ice sheet in a warmer climate is a matter of great concern. In the late 1970s, it was stressed several times that the West Antarctic ice sheet, with its buttressing ice shelves and its bed so far below sea level, could be so inherently unstable that a moderate warming may lead to a runaway situation in which the major part of the West Antarctic ice sheet disintegrates in a few centuries time. Though this view is nowadays regarded as probably too dramatic (e.g. Reference Van and VeenVan del' Veen, 1985; Reference Huybrechts and OerlemansHuybrechts and Oerlemans, 1990), the possibility of unstable behaviour, perhaps linked to climate in an indirect way, is still a potential option (Reference macAyealMacAyeal, 1992). Because of its terrestrial nature, the East Antarctic ice sheet, on the other hand, is widely believed to be less vulnerable to a climatic warming.
Nevertheless, new interest in the stability of the East Antarctic ice sheet was recently stirred by controversies over its late-Tertiary glacial history. The established view is that the East Antarctic ice sheet grew to its full extent somewhere between 14 and 11 Ma ago, and remained a stable and permanent feature exhibiting some changes in volume since then (Reference KennettKennett, 1977; Reference Denton, Prentice, Burekle and TingcyDenton and others, 336 1990 Reference SugdenSugden, 1992: Reference marchant, Swisher, Lux, West and DentonMarchant and others, 1993). This “stabilist view” is now being challenged by the discovery of marine diatoms in the Sirius Group in the Transantarctic Mountains. Their presence has been interpreted as indicating that these diatoms were living in marine basins in the interior of East Antarctica, and that these basins were subsequently covered by an expanding ice sheet that over-rode the Transantarctic Mountains and transported the diatoms to their present locations (Reference Webb, Harwood, McKelvey, Mercer and StottWebb and others, 1984; Reference Webb and HarwoodWebb and Harwood, 1991). Based on the ages of the diatoms, the latest episode of a largely icefree continent would have occurred as recently as the mid- to late Pliocene about 3 Ma ago, when the climate was only slightly warmer than it is today (Reference HarwoodHarwood, 1986; Reference Barrett, Adams, McIntosh, Swisher and WilsonBarrett and others, 1992). This highly unstable behaviour has led to the suggestion that the East Antarctic ice sheet is very sensitive to global warming and could again largely disappear in the near future if global temperatures increased by a few degrees. The implications would be far-reaching: if melted, the East Antarctic ice sheet would raise world-wide sea levels by around 60 m.
In this paper, I investigate the climatic conditions under which the Antarctic ice sheet may form and disintegrate, and calculate how the corresponding ice sheets may have looked. In orderer to do this, I use a threedimensional thermomechanical model for the entire Antarctic ice sheet in connection with simple massbalance considerations. Though tbe emphasis is on the response of the terrestrial East Antarctic ice sheet, this study also yields details on how the West Antarctic ice sheet would react to a warmer surface climate.
2. Model Set-up
The model is basically similar to the one used to study the Antarctic ice sheet on a glacial-interglacial and a greenhouse-warming time-scale (Reference HuybrechtsHuybrechts, 1990; Reference Huybrechts and OerlemansHuybrechts and Oerlemans, 1990), except that an explicit calculation of grounding-line dynamics and ice-shelf flow was not made. Instead, the present grounding-line position was considered as a limit for the maximum icesheet extent, beyond which all ice is lost to the ocean. Expansion of grounded ice over terrain below sea level is therefore still possible, but is entirely controlled by tbe surface mass balance and the ability of the ice sheet to extend down to sea level. In effect, all ice is treated as grounded ice, irrespective of the bed elevation with the understanding that it cannot expand beyond its present limits This approach to modelling the boundary ice is not considered a serious problem, since the ice sheet will, in a warmer climate, retreat on to the East Antarctic continent and will no longer interact with the ocean directly. Also, the greenhouse-warming experiments reported by Reference Huybrechts and OerlemansHuybrechts and Oerlemans (1990) did not show any appreciable seaward movement of the grounding line, not even for a small warming. Other than that, there are no modifications to the original ice-dynamics model, that is, the model basically solves coupled equations for ice flow and ice temperature on a 40 km grid with 11 layers in the vertical and includes such features as basal sliding and isostatic adjustments of the bedrock. The structure of the model is shown in Figure I
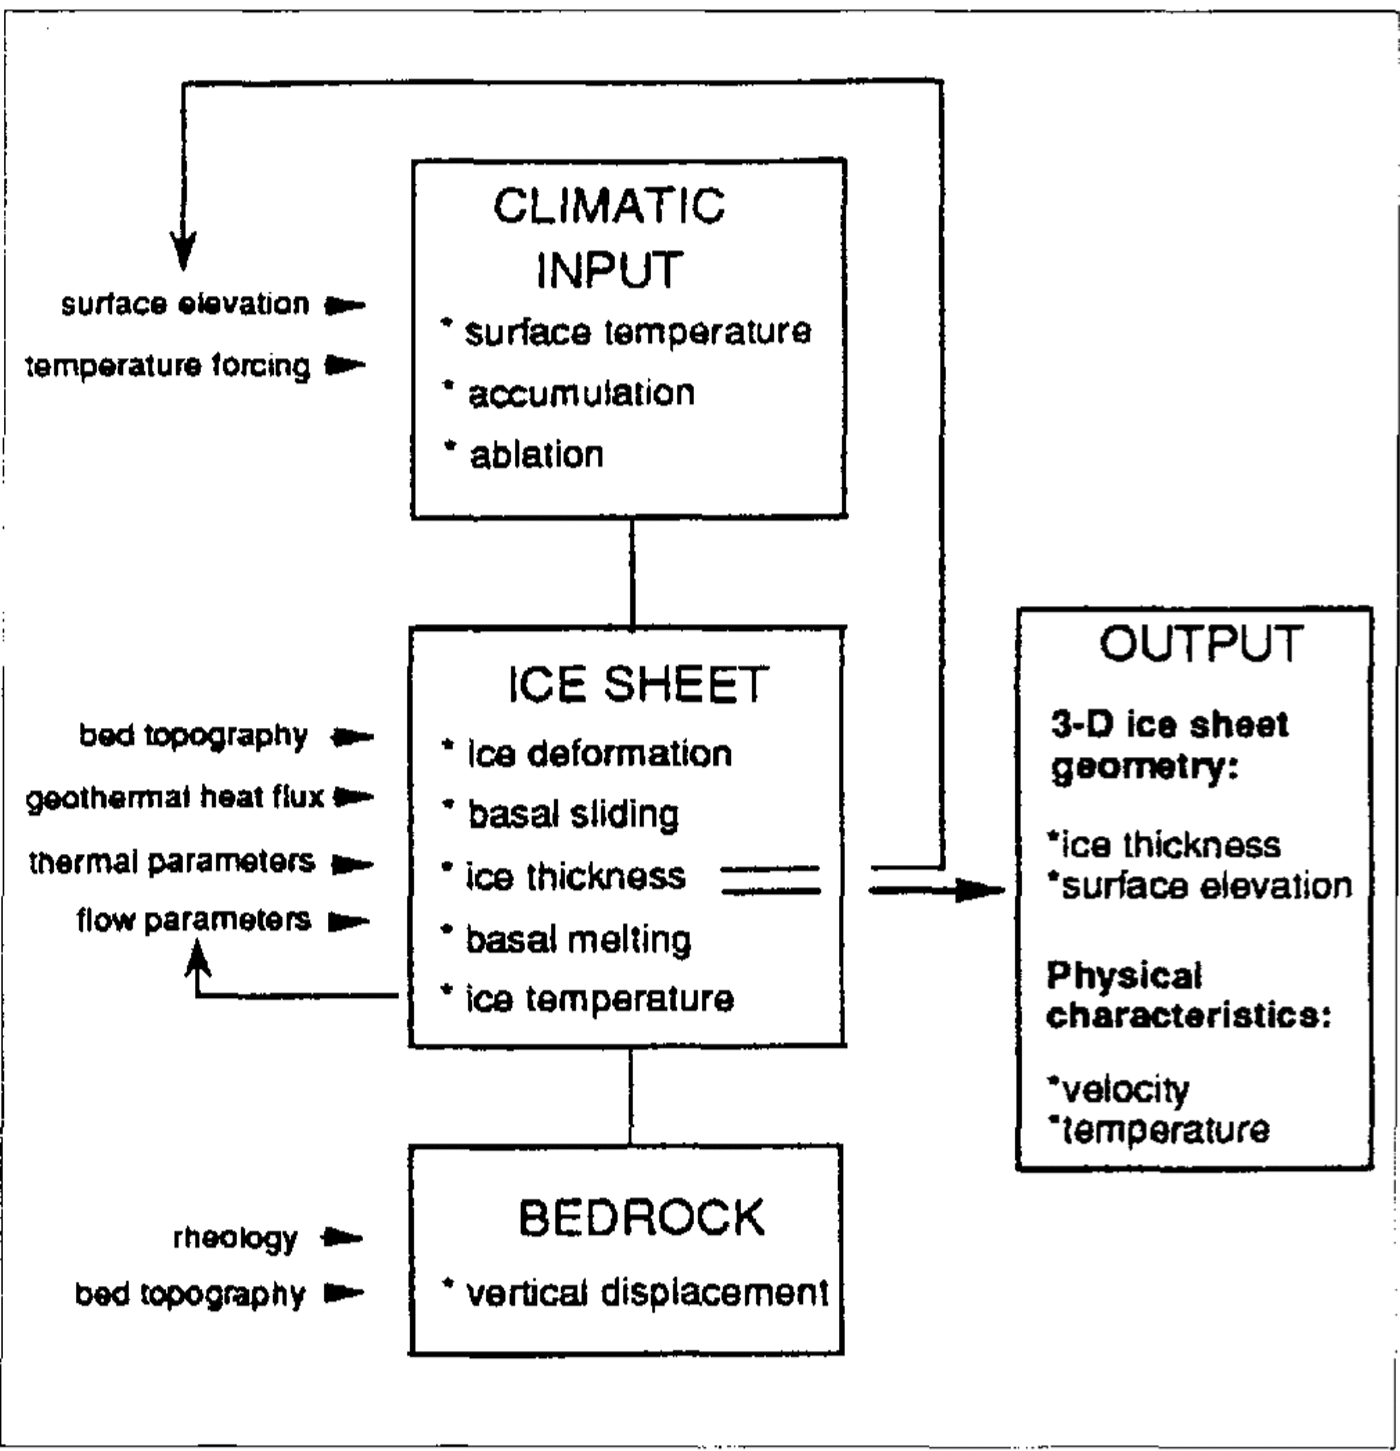
Fig. 1. Structure of the model used in this study. The model inputs are shown on the lefthand side_ A prescribed temperature change drives the model, which has grounded ice and bedrock adjustment as major components. Ice thickness feeds back on surface elevation, an important parameter for the calculation of the climatic input. the main output consists of the fully coupled temperature and velociy fields and the three-dimensional ice-sheet geometry, which is freely generated by the model.
The primary input to the model, besides the bedrock topography, is the mass balance at any time and place in the model domain. Using data from Reference Orvig and LandsbergOrvig (1970) and following analyses by Reference Giovinetto, Waters and BentleyGiovinetto and others (1990) and Reference Fortuin and OerlemansFortuin and Oerlemans (1990), climatic-boundary conditions are parameterized as: TMA = 34.46 - 0.00914H SUR - 0.68775lat + T for TMS = 16.81 - 0.00692H sur - 0.27937 lat + T for ACC = 0.78 + 2.525×10⁻²TMA + 2.225 × 10⁻⁴ TMA2 where TMA (in °C) is the mean annual surface air temperature, taken to represent the ice temperature at 10m depth, Hsur is surface elevation in metres above sea level, lat is latitude in °S and T for is the applied temperature change with respect to present conditions. ACC (in ma-1 ice equivalent) is the accumulation rate and gives a reasonable fit to the presently observed snowfall distribution. It varies from as little as 5 cm a1 for a minimum air temperature of -56°C to around 0.5 ma-1 for a mean annual temperature of -12°C. Its parameterization has palaeoclimatic validity, if one accepts that temperature remains the main controlling factor for precipitation, also in past environments. TMS (in °c) is the summer temperature needed to determine the annual temperature cycle in the ablation model, which is based on the degree-day method and makes a distinction between ice and snow melting Reference Braithwaite, Olesen and Oerlemans(Braithwaite and Olesen, 1989). This method of determining glacier run-off is similar to the procedure adopted in Reference Webb, Harwood, McKelvey, Mercer and StottHuybrechts and others (1991), where it was used with some success in determining ablation rates on the Greenland ice sheet. The latter can be considered as the modern analogue for an (East) Antarctic ice sheet in a climate warmer by 10-15K in the annual mean. Additional features, such as superimposed ice formation and the fraction of precipitation falling as rain, of importance for the present-day ice sheets in Greenland and the Canadian Arctic, have been disregarded simply because uncertainties in the other climatic-boundary conditions would not justify such a degree of sophistication.
3. Results
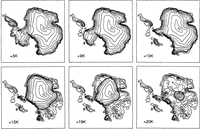
Figure 2 shows the calculated ice-sheet geometries for a temperature range of between 5 and 20 K above present levels. For a temperature increase of up to 5 K, the icesheet geometry is quite stable. There is a slight retreat of ice along the northernmost tip of the Antarctic Peninsula and elevations tend to rise a little over the interior of the continent, but the overall form of the ice sheet exhibits only minor changes. This is because melting at the margin is not yet of sufficient strength to form an ablation area of any significance along the coast. The formation of such an ablation area, in which run-off exceeds accumulation on an annual basis, is a necessary pre-condition for the ice sheet to recede over its continental base. In addition, the thickening effect of increased accumulation rates is counteracted in central areas by thinning associated with the warmer and softer ice. This is very similar to the behaviour reported for the Antarctic ice sheet during a glacial-interglacial contrast, where eustatic sea-level changes rather than climatic changes were found to be the most decisive factor controlling fluctuations of the ice sheet :Reference Huybrechts and OerlemansHuybrechts, 1990).
A first threshold is crossed for a warming in the range of 8–10 K. For a temperature rise of + 9 K, most of the ice cover over the Antarctic Peninsula has retreated to the high central mountain ridge and the peninsula ice cap has become uncoupled from the west Antarctic ice sheet. This leads to an open seaway between Palmer Land and Ellsworth Land. For a warming of between 9 and 10 K, the mass balance over most of west Antarctica has become sufficiently negative at sea level, so that grounded ice is no longer able to feed an ice shelf. This starts a chain of reactions that ultimately results in the almost total destruction of the marine parts of the west Antarctic ice sheet. The mechanism called upon for ice-sheet decay does not involve direct interaction with the ocean but is due to the height-mass-balance feed-back: melting of the west Antarctic ice sheet at its margin leads to a shrinking base and thus lower elevations, which then further enlarges the ablation area and so on. Since the effects of basal melting and ice-shelf thinning on grounding-line movements arc not included, this + 9–10 K value should probably be considered as an upper bound for West Antarctic ice-sheet destruction. Nevertheless, though invoking an alternative mechanism, it is interesting to see that the model confirms that the West Antarctic ice sheet cannot survive without its ice shelves. For a warming of around 10 K, the ice sheet also starts to retreat from the continental margin in East Antarctica and ice shelves cease to exist altogether.
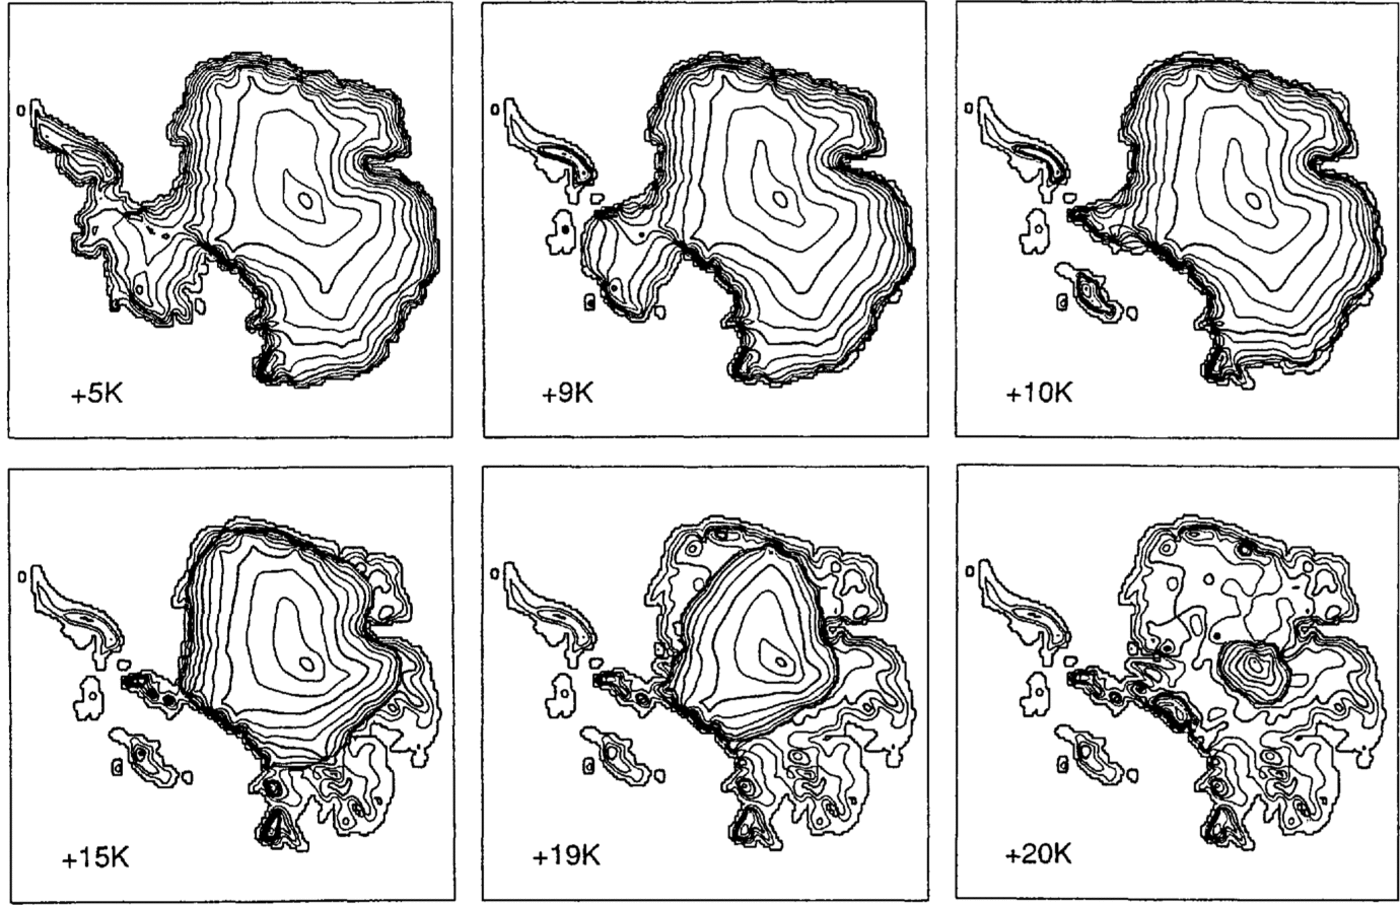
Fig. 2. Steady-state ice-sheet geometries for temperature perturbations above present levels as indicated. lsolines are for surface elevation. Contour interval is 333m and the thick lines are fOr every 1000m. These experiments started with the present ice sheet as an initial configuration.
As shown in the bottom series of graphs in Figure 2 Thc Antarctic ice sheet starts to retreat more seriously for temperature rises above 15 K, when local ice caps appear in Victoria Land and the Ellsworth Mountains which are disconnected from the min ice sheet. A second threshold, now associated with the East Antarctic ice sheet, is crossed for temperatures in the range of + 19–20 K. At this stage, the East Antarctic ice sheet has basically disintegrated into two ice caps situated on top of the Transantarctic and the Gamburtsev Mountains. A small ice cap also survives in the Sur-Rondane mountains, which acts as a third inception area. The presence of these mountains explains why the East Antarctic ice sheet is able to resist a much larger warming than the West Antarctic ice sheet for a similar latitude, because these mountains enable the ice sheet to retreat to higher ground. It is also interesting to note that an ice-free corridor centered over the Pensacola Basin, where marine sedimentation could take place, is only produced when the ice sheet as a whole has almost entirely disappeared.
Another important characteristic for ice-sheet dynamics is the extent of basal melting, because the presence of liquid water is a necessary pre-requisite for enhanced basal motion, whether this occllrs as basal sliding at the ice-rock interface or by means of a defOrming layer of soft sedirnents. The resulting distribution of areas at the pressure-melting point is shown in Figure 3 Interestingly, the present-day pattern of basal melting is quite well conserved and changes in a warmer eli mate are modest.

Fig. 3. Basal temperature conditions correaponding to the series of experiments shown in Figure 2 white areas indicate where the base is at the pressure-melting point and basal sliding can occur. These plots demonstrate that mixed wet and cold basal conditions also prevail in warmer climates, much like the situation today,
Though there is some expansion of wet ice, basal melting remains mainly confined to regions with thick ice, whereas the shallower ice covering the Transantarctic and the Gamburtsev mountains continues to be coldbased. This behaviour is a result of two largely counteracting effects: in a warmer climate, the surface ice becomes warmer but, on the other hand, increased accumulation rates will lead to a more vigorous motion of the ice within the ice sheet, so that more cold ice is advected downward. As a result, the steady-state surface-to-bottom temperature difference is reduced and the ensuing basal warming is only a fraction of the initial surface warming'. The implication for the dynamics of the East Antarctic ice sheet is that any instability mechanism invoking widespread basal melting is unlikely to have played a major role in the ice sheet's history.
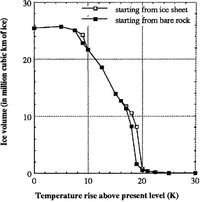
The results of these experiments are best summarized in a solution diagram giving the equilibrium ice volume as a function of the temperature perturbation (Figure 4), Two sets of model runs are shown, one in which the present ice sheet was used as an initial condition, and another in which the calculations began from bare rock. Clearly, there are regions with multiple solutions. For certain values of the temperature perturbation, the final state of the ice sheet depends on whether the ice sheet was already present or not. This is indicative of hysteresis, though its magnitude is not particularly large. This type of behaviour is due to the fact that an ice sheet creates its own surface elimate, so that when the ice sheet is removed it needs a colder climate to re-grow to the same size. The region around 9 K is linked to the threshold for the west Antarctic ice shect, whereas the region between 16 and 20 K is associated with the East Antarctic ice sheet. Furthermore, the Antarctic ice sheet reaches its largest volume for a climatic warming of around 5 K, when also the surface mass balance reaches a maximum. Above this temperature, melting starts to increase faster than the accumulation rate and an ablation area develops around the coast. The ice sheet disappears completely for a climate more than 25 K warmer than today. In that case, there are no regions left in the model domain with a positive surface mass balance. Typical time-scales to reach equilibrium are of the order of a few tens of thousands of years for Antarctic ice-sheet growth and of 5000–10000 years to melt the ice sheet down.

Fig. 4. Solution diagram giving steady-state ice volume as a Junction of the temperature perturbation. The solid squares are for model runs in which the initial condition was an ice-free continent, the open squares started from the present ice sheet. Regions with multiple solutions indicate that the resulting ice-sheet geometrY depends on its past history. To give an idea of the associated impact on sea level: 1 x 10⁶ km3 of ice corresponds to a world-wide sealevel change of around 2.5 m.
when transposing these results to late-Tertiary environments, one should of course bear in mind that the topographical and climatic-boundary conditions may have been quite different from today's. For instance, the Transantarctic Mountains may have been substantially less elevated (Reference Webb, Harwood, McKelvey, Mabin and MercerWebb and others, 1986; Reference McKelvey, Webb, Harwood, Mabin and ThomsonMcKelvey and others, 1991) or patterns of precipitation and temperature change may have been influenced by another geography, a changed continental configuration or a different condition of the surface (Reference OglesbyOglesby, 1989). But, even under the extreme conditions of a flat bedrock and mass-balance parameters stretched to their limits, the ice sheet would still need a temperature rise of the order of + 15K to melt down entirely (Reference HuybrechtsHuybrechts, 1993
4. Conclusion
According to the model results presented in this paper, the Antarctic ice sheet appears to be very robust to a climatic warming. Tt would take a temperature warming of between 8 and 10 K to melt the West Antarctic ice sheet down and of between 20 and 25 K to remove completely the ice sheet from the interior of East Antarctica. Moreover, for a warming of up to 5 K, the ice sheet would be even larger than today, because the increase in snowfall would still outweigh the increase in surface melting. In addition, massive basal melting, which is the pre-requisite for any instability mechanism invoking the decoupling of the ice sheet from its base, has not been shown to take place in a warmer climate. Interesting also is that the maintenance of the west Antarctic ice sheet has turned out to be closely linked to the ability of the ice sheet to form an ice shelf, though the mechanism for its removal did not involve direct interaction with the ocean. Instead, the decisive factor for its disintegration was linked to the fact that it cannot retreat to higher ground once its margins are subjected to surface melting and begin to recede. These results are of special interest in the light of the ongoing debate on the nature and extent of Antarctic glaciation during the late Tertiary. Based on these findings, there are serious climatological and glaciological difficulties associated with a Pliocene disintegration of the East Antarctic ice sheet. The problem is that the only mechanism able to explain a smal1er ice sheet is massive surface melting, and that this requires a temperature rise well in excess of the modest warming recorded in, for instance, the marine-isotope records (e.g. Reference KennettKennett, 1982). Rather, it is more likely that the Pliocene ice sheet was somewhat larger than today.
Acknowledgements
I wish to thank the Belgian Research Program on Antarctica (Science Policy Office, Services of the Prime Minister) and the Belgian National Fund for Scientific Research (NFWO) for initial support of this study.