


Introduction
Ice-sheet flow conditions are strongly influenced by stress, temperature, crystal-orientation fabrics and the content of particular impurities, properties that generally vary with depth in large ice masses (Reference PatersonPaterson, 1994). We need to understand the creep properties of polycrystalline ice in order to understand the ice-flow behavior of large ice sheets. Laboratory experiments have shown that the secondary creep rate of polycrystalline ice is as described by Reference GlenGlen (1955):

where B is a constant, Q is the activation energy for creep of ice, K is Boltzmann’s constant and T is the absolute temperature. This relation, known as Glen’s creep law for polycrystalline ice, does not, however, take into account the effect of crystal anisotropy. In natural ice masses, strong anisotropy exists. We have some knowledge of strain-rate dependence on fabric development in large ice masses (Reference Shoji and LangwayShoji and Lang-way, 1988; Reference Jacka and BuddJacka and Budd, 1989).
A 3029 m long vertical ice core was recovered from Summit (72°34.5’N,37°38.5’W;3230ma.s.l.) during the boreal summers of 1990, 1991 and 1992 by the joint European research effort of the Greenland Ice Core Project (GRIP). The excellent physical condition of the deep ice core permits mechanical tests to be made of the flow properties over a wide range of sampling depths.
Stable-isotope measurements (Reference DansgaardDansgaard and others, 1993; GRIP Project Members, 1993; Reference Johnsen, Clausen, Dansgaard, Gundestrup, Hammer and TauberJohnsen and others, 1995) clearly identify the Holocene ice (present-11.5 ka BP; top-1624m), the Wisconsin ice (11.5-110ka BP; 1624-2790 m) and the Sangamon ice (110-135 ka BP; 2790-2865 m) along the GRIP ice core. The bottom parts of the core show largely disturbed visual stratigraphy (2850-2950 m), which raises questions regarding chronological continuity at those depths (Reference Thorsteinsson, Kipfstuhl and MillerThorsteinsson and others, 1997).
The general physical features of the entire GRIP ice core have been studied byReference Thorsteinsson, Kipfstuhl and MillerThorsteinsson and others (1997), and flow disturbance of the GRIP and Greenland Ice Sheet Project II (GISP2) deep ice cores has been reported by Reference Alley, Gow, Johnsen, Kipfstuhl, Meese and ThorsteinssonAlley and others (1995). Other studies having a bearing on our measurements include chemical and dust measurements (personal communication from J. P. Steffensen and others, 1997; personal communication from C. U. Hammer and others, 1997) and electric conductivity measurements (ECMs) in the field (personal communication from H. B. Clausen and others, 1997).
Samples, Test Specimens and Experiments
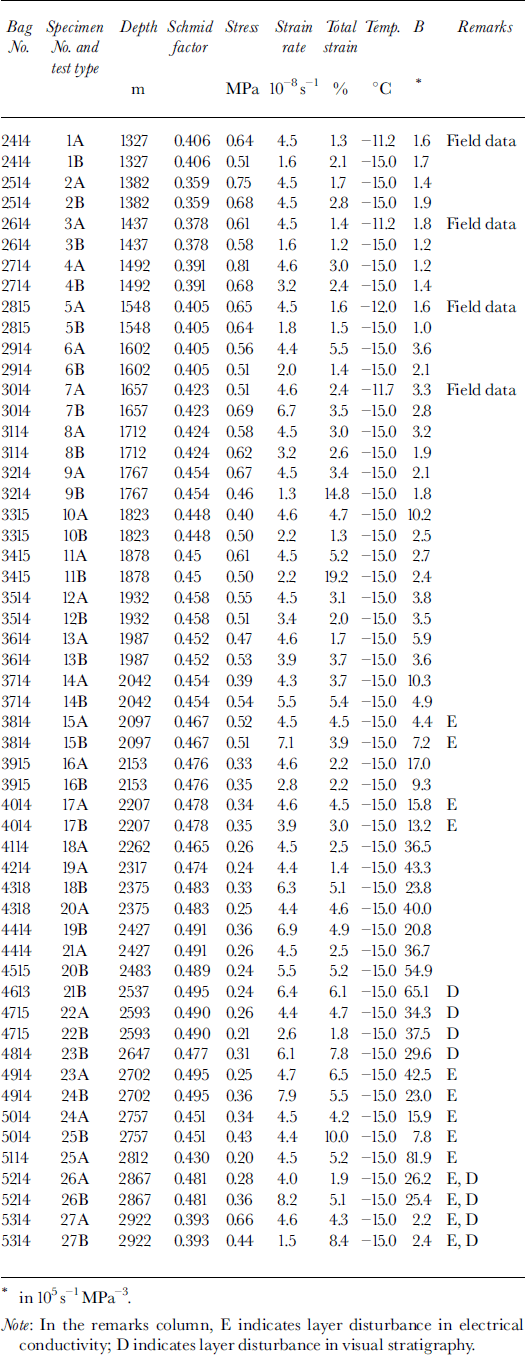
Uniaxial compression tests were made on the GRIP deep ice-core samples in the field and laboratory. Experiments were conducted under conditions of constant strain rate (type A) and constant load (type B). Thirty-nine core samples (approximately 35 mm x 100 mm x 550 mm) were selected from 777-2922 m over the vertical core profile, excluding the volcanic impurity layers detected by ECMs (personal communication from H. B. Clausen and others, 1992). Brittle-zone (650-1300 m) samples were not included for the compression tests. The depth of each test sample is marked on the stable-isotope profile (Reference DansgaardDansgaard and others, 1993) in Figure 1. Grain-size (Reference Thorsteinsson, Kipfstuhl, Eicken, Johnsen and FuhrerThorsteinsson and others, 1995) is nearly constant (2-3 mm) in Holocene ice below 700 m depth, but decreases to 1-2 mm below the Holocene/Wisconsin boundary depth. Below 2000 m depth, grain-size increases with depth towards the bottom, with large fluctuations (4-13 mm). The uniaxial compression tests were made on samples selected from identified climate periods (Holocene, Wisconsin and Sangamon) in the GRIP core, providing a wide variation in grain-size, fabrics and impurity content. Test specimens (approximately 25 mm x 25 mm x 90 mm) were prepared from core samples with the uniaxial-stress axis inclined 45° from the core axis in order to examine the relation between the single-maximum ,-axis orientation and the basal plane easy-slip system in the direction of the horizontal plane of the ice sheet. The stress field of the GRIP site is understood to be uniaxial compression, but, in order to understand anisotropy in ice-sheet flow, we chose the sample-cutting plan outlined above. Furthermore, Reference CastelnauCastelnau and others (1998) show that the flow results from compression tests are very sensitive to slight deviations between the compression axis and the core axis when the stress is applied in the direction of the core axis (in situ stress field at the dome). When uniaxial compression tests are performed inclined at 45° from the core axis, experiments provide a good measurement of the directional viscosity corresponding to an in situ horizontal shear (Reference CastelnauCastelnau and others, 1998). A constant strain rate of about 4.5 x 10"8 s−1 was applied for the type A experiments with a Minebea Model TCM-5knb-S testing instrument which was specially modified for low-speed testing. A constant stress in the range 0.2-0.7 MPa was applied for the type B experiments with a specially designed creep-testing apparatus made at Toyama University. The strain rate for our laboratory test is very high compared with the ice-sheet flow. We need to perform various deformation tests to examine whether laboratory tests can be adapted to ice-sheet flow, and to establish a flow law for anisotropic ice in the ice sheet. The experimental temperature ranged from −11° to −17°C, and was held constant during each test run, as shown in Table 1.

Fig. 1. Stable-isotope curve for the GRIP ice core (Reference DansgaardDansgaard and others, 1993). Slab-section samples for this study are shown by open circles.
Table 1. Conditions and results of uniaxial compression tests
c-Axis Orientation Distribution
The influence of c-axis orientation on ice-flow behavior is well recognized. The effects can be described in terms of a Schmid factor (Reference Shoji and LangwayShoji and Langway, 1988; Reference Shoji, Kobayashi, Langway, Maeno and HondohShoji and others, 1992; Reference AzumaAzuma, 1995). The general distribution of c-axis orientation in the GRIP ice core has been measured by Reference Thorsteinsson, Kipfstuhl and MillerThorsteinsson and others (1997). The average values of Schmid factor, S, with respect to the stress direction were calculated from c-axis measurements on the same ice-core section from which test samples were cut. The Schmid factor is defined as
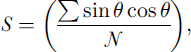
where 6 is the angle between the c-axis direction of individual crystals and the stress-axis direction and N is the number of crystals. The Schmid factor (Fig. 2) generally increases with depth down to about 2500 m, with relatively small variability. Below 2500 m the Schmid factor appears to decrease rapidly with depth, with large perturbations. The major Holocene/ Wisconsin climate boundary identified at 1624 m by 6lsO and ECM signals does not appear to be reflected in these data. The inclination of borehole is within 2° from surface to 2300 m depth. Subsequently, the inclination reached 3° at 3000 m depth (Reference Johnsen, Gundestrup, Hansen, Schwander and RufliJohnsen and others, 1994). This inclination scarcely influences the Schmid factor.
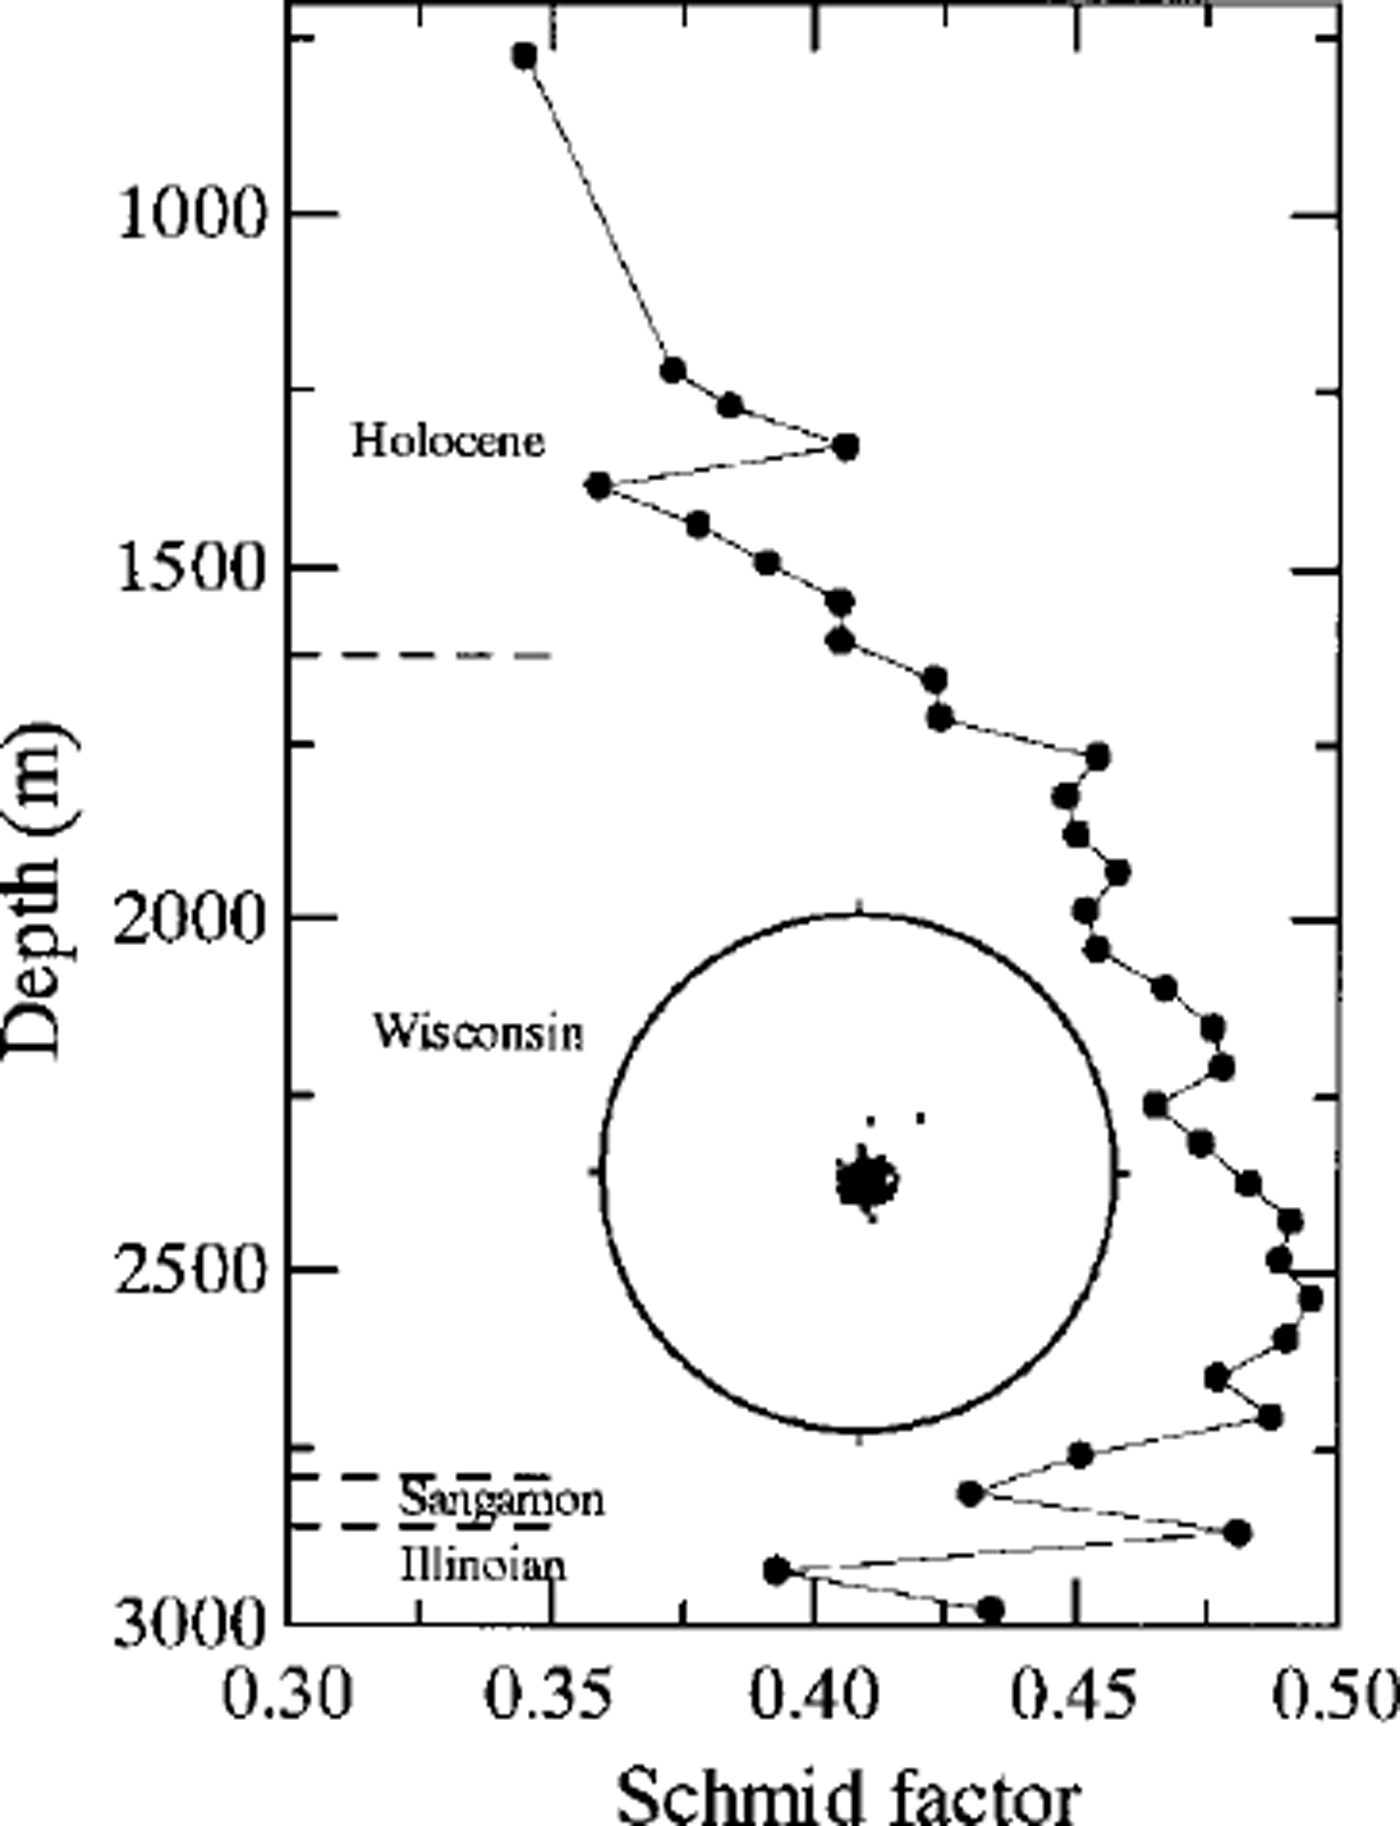
Fig. 2. Schmid-factor profile calculated from c-axis orientation studies. The fabric diagram shows the strongest single-maximum c-axis orientation at 2537 m depth in the GRIP ice core.
Uniaxial Compression Tests
A total of 54 uniaxial compression tests were conducted as shown inTable 1. The stress-strain curves obtained from type A experiments were of a stress-saturation type in which stress levels remained approximately constant after 1 % strain. The maximum value of the uniaxial stress was used in the data analysis that follows. The creep curves obtained from the type B experiments showed an almost constant minimum strain rate after about 1 % strain which was also used for the following data analysis. Figures 3a (1 and 2) and b (1 and 2) show type A and type B data, respectively. In Equation (1), B depends on crystal orientation (Schmid factor), impurity content, grain-size, grain shape and other factors apart from temperature. We used 60 kJ mol−1 for the activation energy Q in our test temperature range (Reference WeertmanWeertman, 1983). The value of B indicates the relative strain rate for a given stress and temperature. Values of B (Fig. 4) show a very gradual increase from 777 m depth to 2200 m depth, with no significant difference in the increasing trend between results from type A and type B experiments. Below 2200 m depth, the values of B increase markedly and show large scatter.
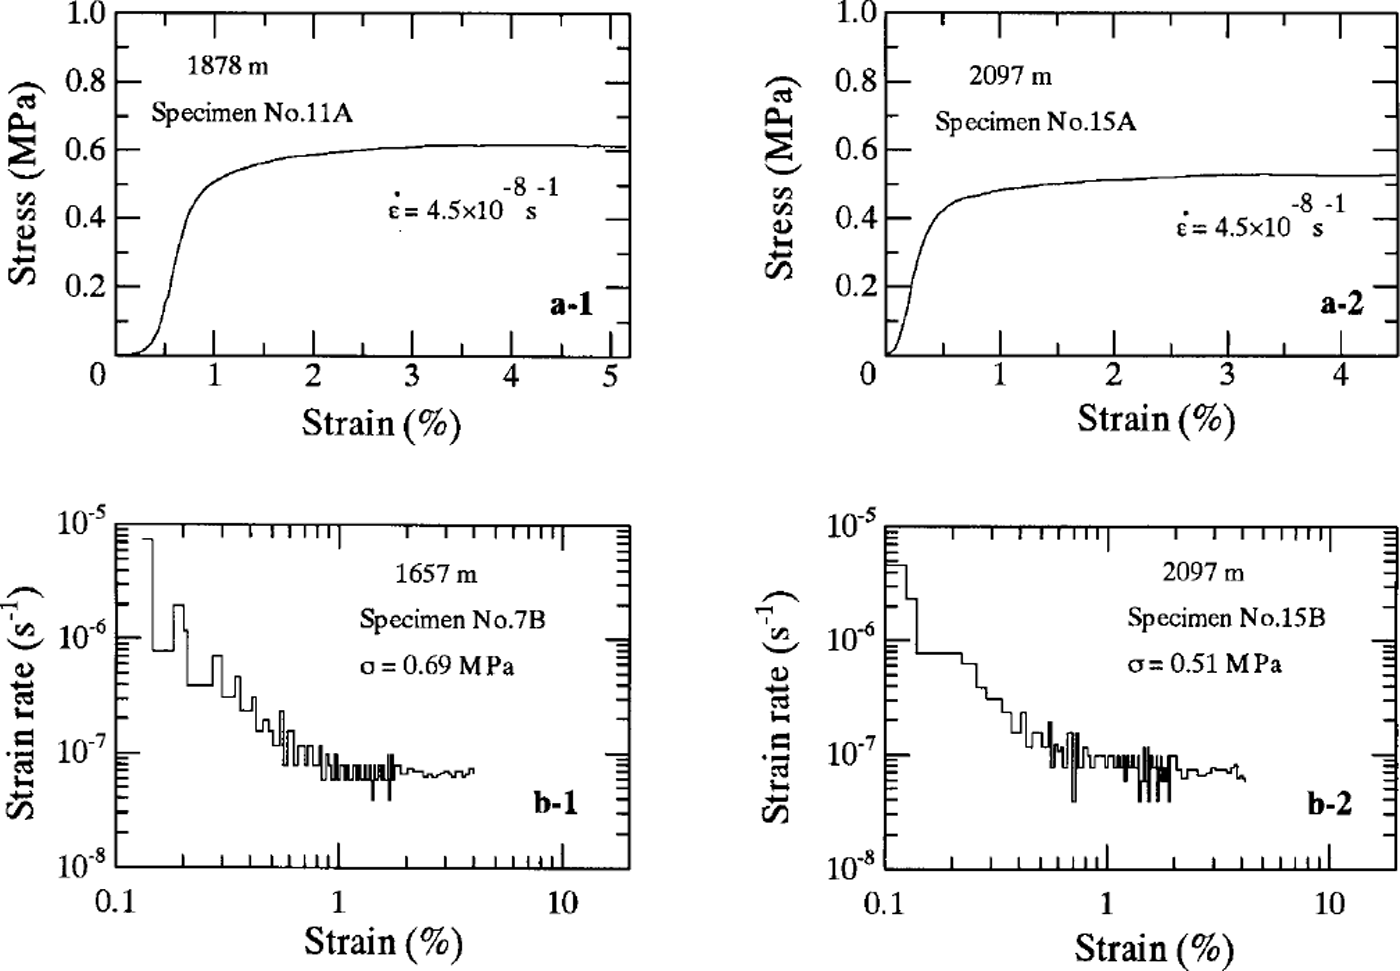
Fig. 3. Uniaxial-compression test curves, (a-1, a-2) Stress-strain relation, obtained from type A tests, (b-1, b-2) Strain-rate-strain relation, obtained from the type B tests.
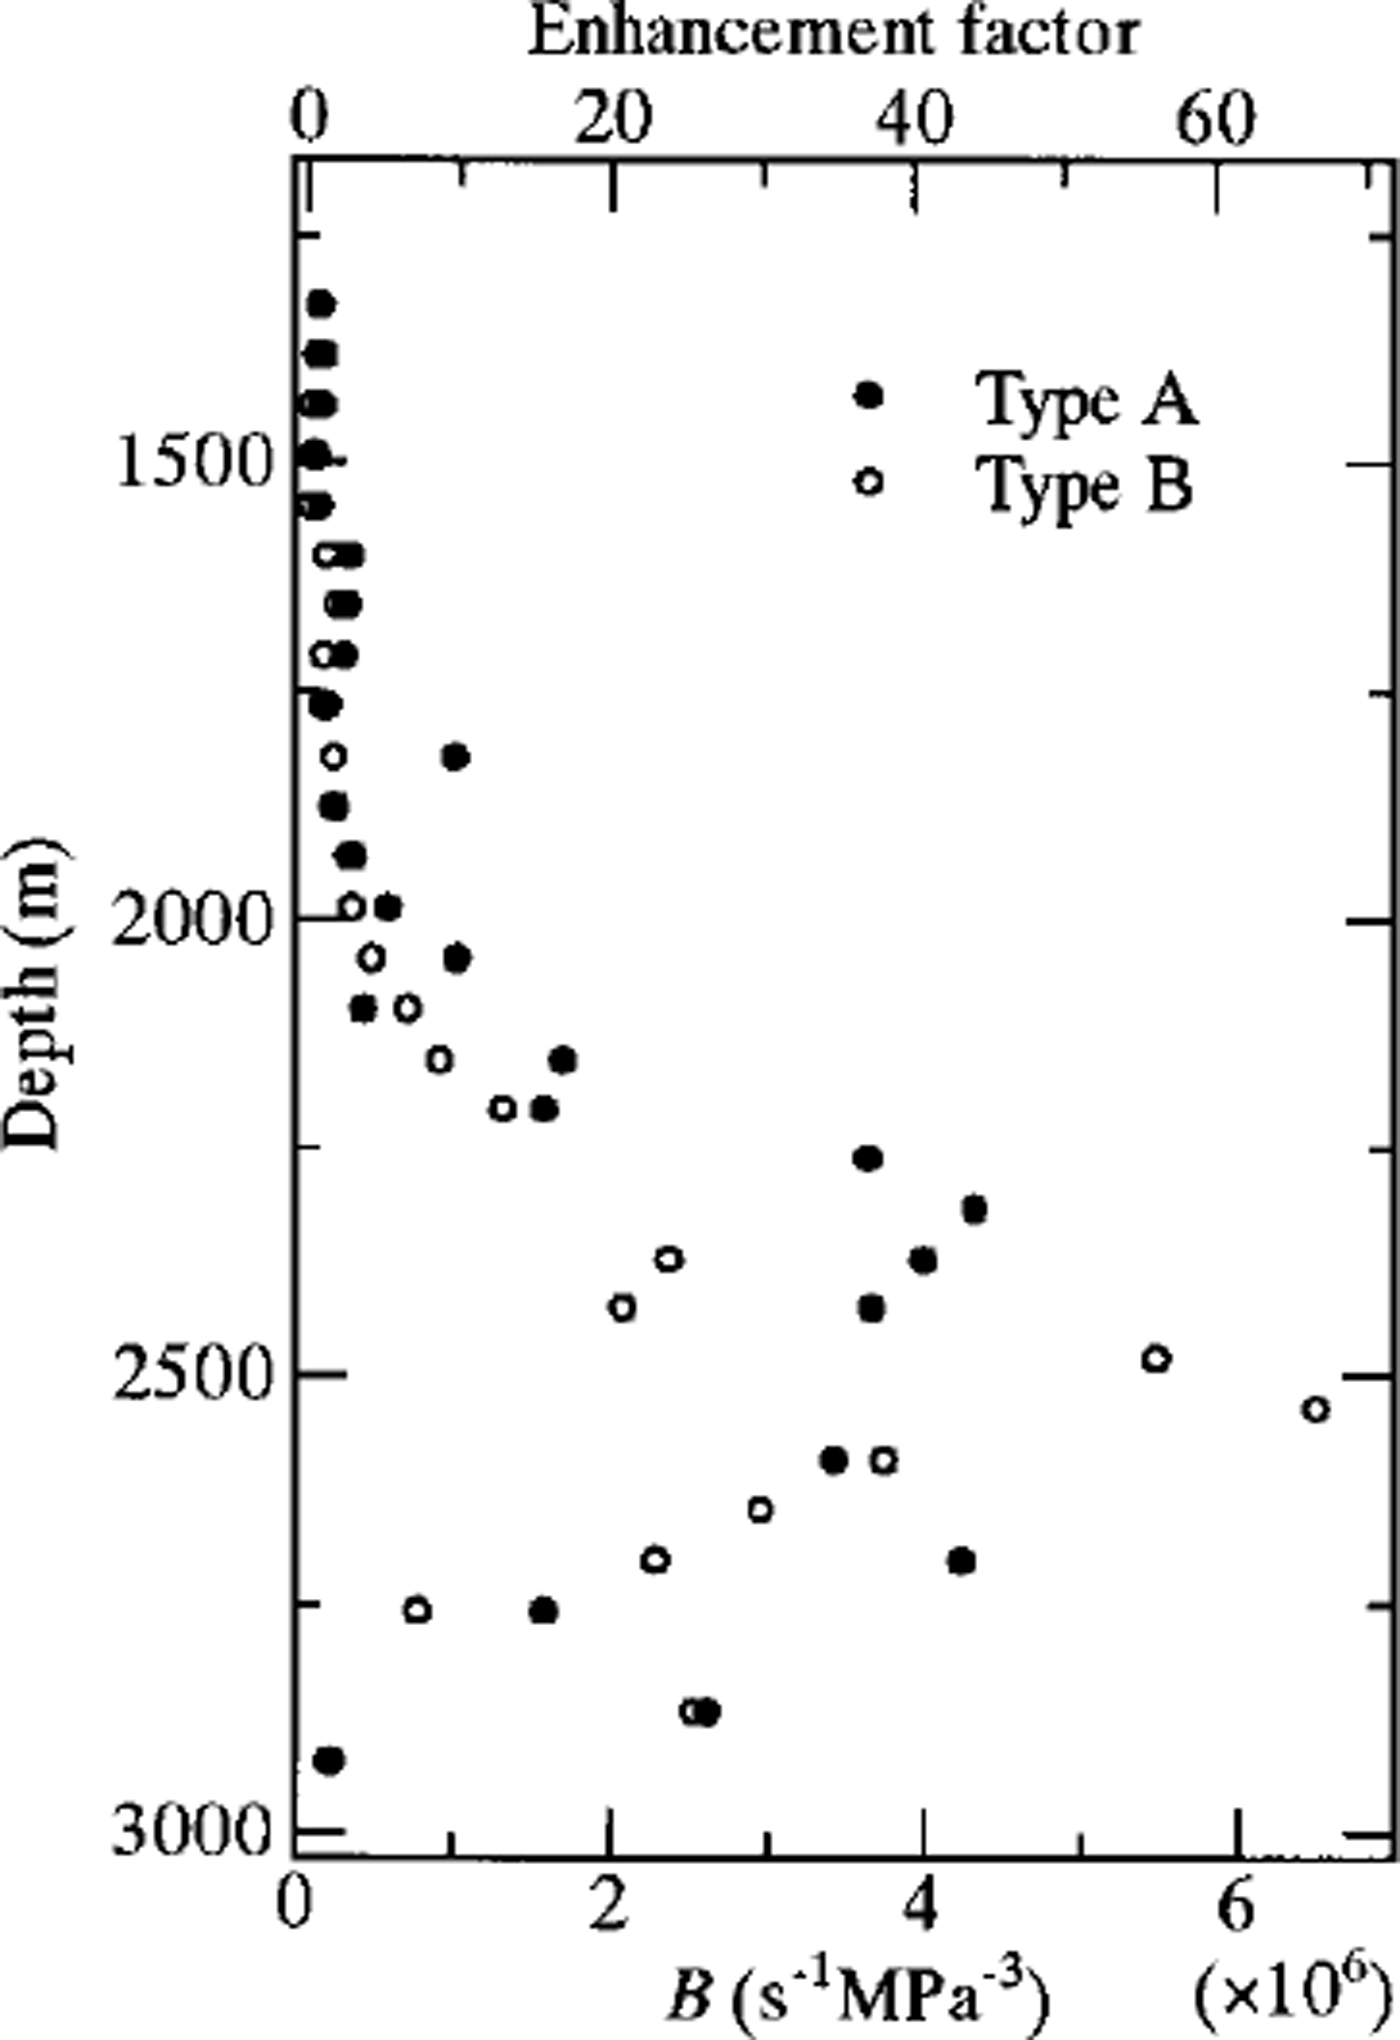
Fig. 4. B curve obtained from uniaxial compression tests. The top axis shows the flow-enhancement factor.
Discussion and Conclusions
In order to obtain the relation between Schmid factor and strain rate, Equation (1) is redescribed as

where β0 which it is supposed depends on impurity content, grain-size, grain shape and other factors is assumed to be constant and S is the Schmid factor (Reference AzumaAzuma, 1995). We can extract ice which exhibits strong single-maximum fabrics with a large (>0.46) Schmid factor from the deeper part of the GRIP ice core (Fig. 2). Figure 5 shows a log-log plot of the relation between B and the Schmid factor, and from it we conclude that B is proportional to S4 for S < 0.46. In this area, we see that Equation (3) is satisfied. For S > 0.46, however, the values of B have a wide spread for almost the same value of S. Alternatively the values of B are proportional to about S50.
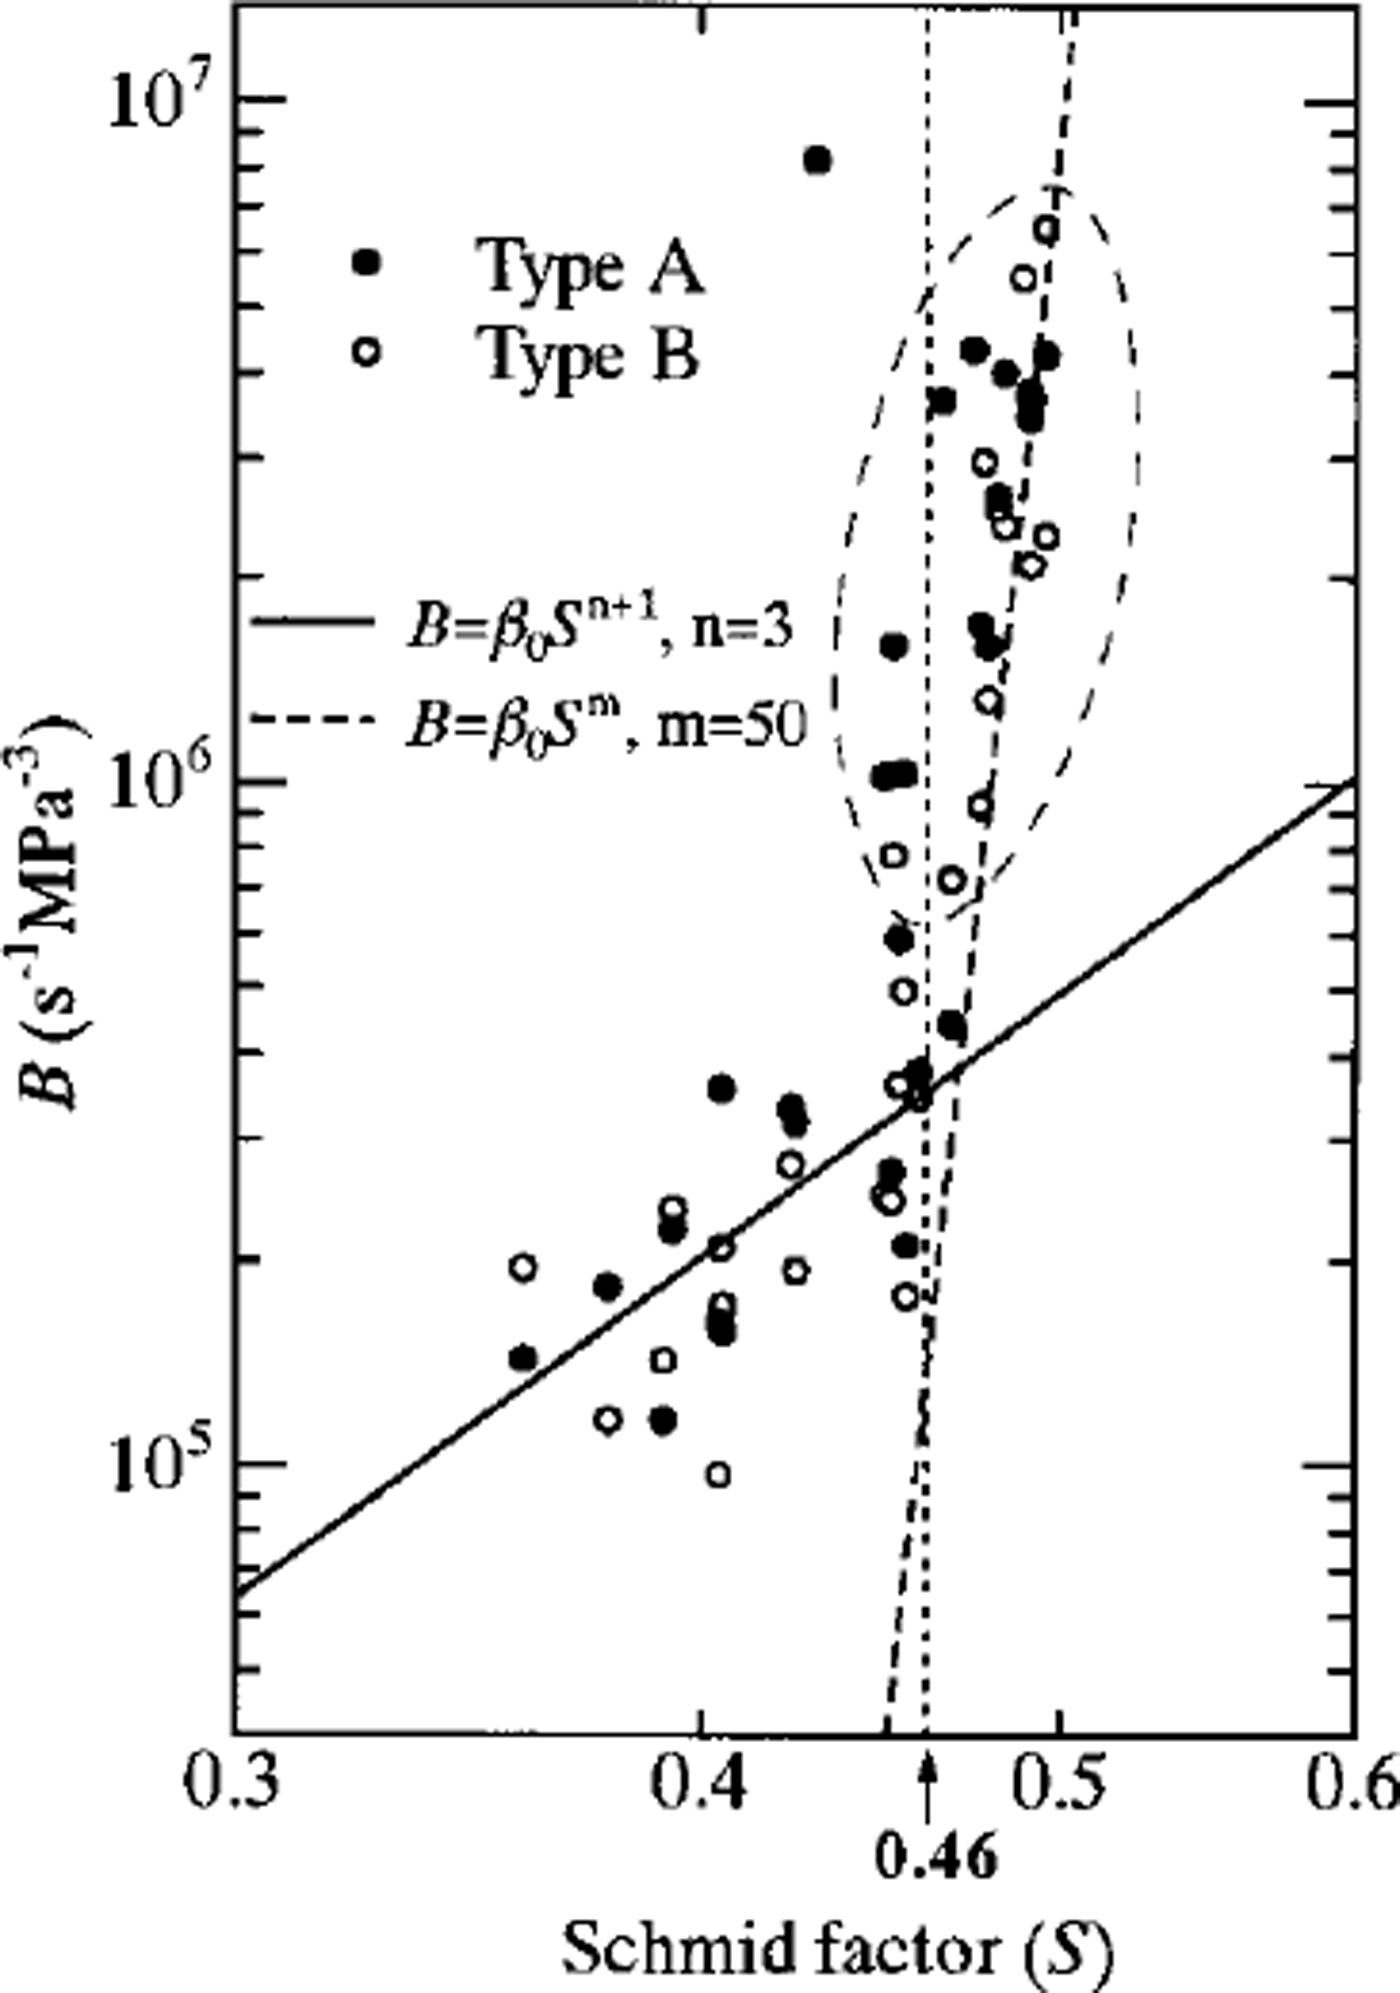
Fig. 5. Correlation of the value ofB with Schmid factors. The filled circles and open circles represent data from type A and type B compression tests, respectively. The solid line is the regression line for S<0.46. The dashed line shows the 50th-order Schmid factor plotted against B.
In Figure 5, for a random c-axis orientation distribution (S=1/3), B = B1/3 is 9.7 × 10⁴ s-1 MPa−3 by extrapolation of the solid line. The ratio of B to B1/3 indicates the flow-enhancement factor (E). The value of E calculated on this basis is marked on the top axis in Figure 4 Low E values persist right through the Holocene/Wisconsin boundary at 1624 m, without change. This observed trend is quite different from that reported for the Dye 3 case (Reference Shoji and LangwayShoji and Langway, 1987). This result suggests that the rate of development of the ,-axis orientation fabric does not change drastically at the Holocene/Wisconsin boundary. Below around 2000 m depth, the value of E indicates a factor of 2-3 difference between type A and type B experiments with very high values of E (>20). Reference Dahl-Jensen, Thorsteinsson, Alley and ShojiDahl-Jensen and others (1997) showed that deformation tests in the stress direction parallel to the core axis on the GRIP ice core indicate a vertical uniaxial compression strain-rate difference of 2-3 between the cold-period and warm-period ice. These deformational differences in the anisotropic distributions appear to be due to differences of c-axis orientation, grain-size, grain shape and impurity content.
The dataset enclosed by the dashed ellipse in Figure 5 consists of ice containing cloudy bands and layer disturbance in electrical conductivity and/or visual stratigraphy (Table 1). For the ECMs, eight scans were made with electrodes 10 mm apart. Slab-section samples were 0.1 m wide, and we can measure the layer structure at a scale of a few cm. The cloudy bands are alternating layers of milky-colored, cloudy ice and clear ice, with dimensions of a few mm to a few cm. The cloudy bands are identified as low-δ18O ice with small grain-size (Fig. 6) and low electrical conductivity. Similar bands are associated with a strong c-axis orientation in the Byrd ice core, Antarctica (Reference Gow and WilliamsonGow and Williamson, 1976). We obtain the opposite result in the GRIP ice core (Fig. 6): the c axes in the clear ice tend to be more tightly concentrated than those in the cloudy band in the GRIP ice core. Reference Miyamoto, Shoji, Narita, Watanabe, Clausen and HondohMiyamoto and others (1997) suggested that there is no clear correlation between the deformation rate and the number of cloudy bands in uniaxial-compression test specimens. However, it is expected that this anisotropic ice could deform differently than the almost isotropic ice of the Holocene period. Using a microscope, non-uniform deformation was observed at the scale of the cloudy-band structure in the Wisconsin ice, and the deformation mechanism is expected to be different in the cloudy-band ice than in clear ice. For treatments of the flow behavior of Antarctic and Greenland ice masses, quantitative understanding of the deformation properties of laminar-type, non-uniform ice is required.
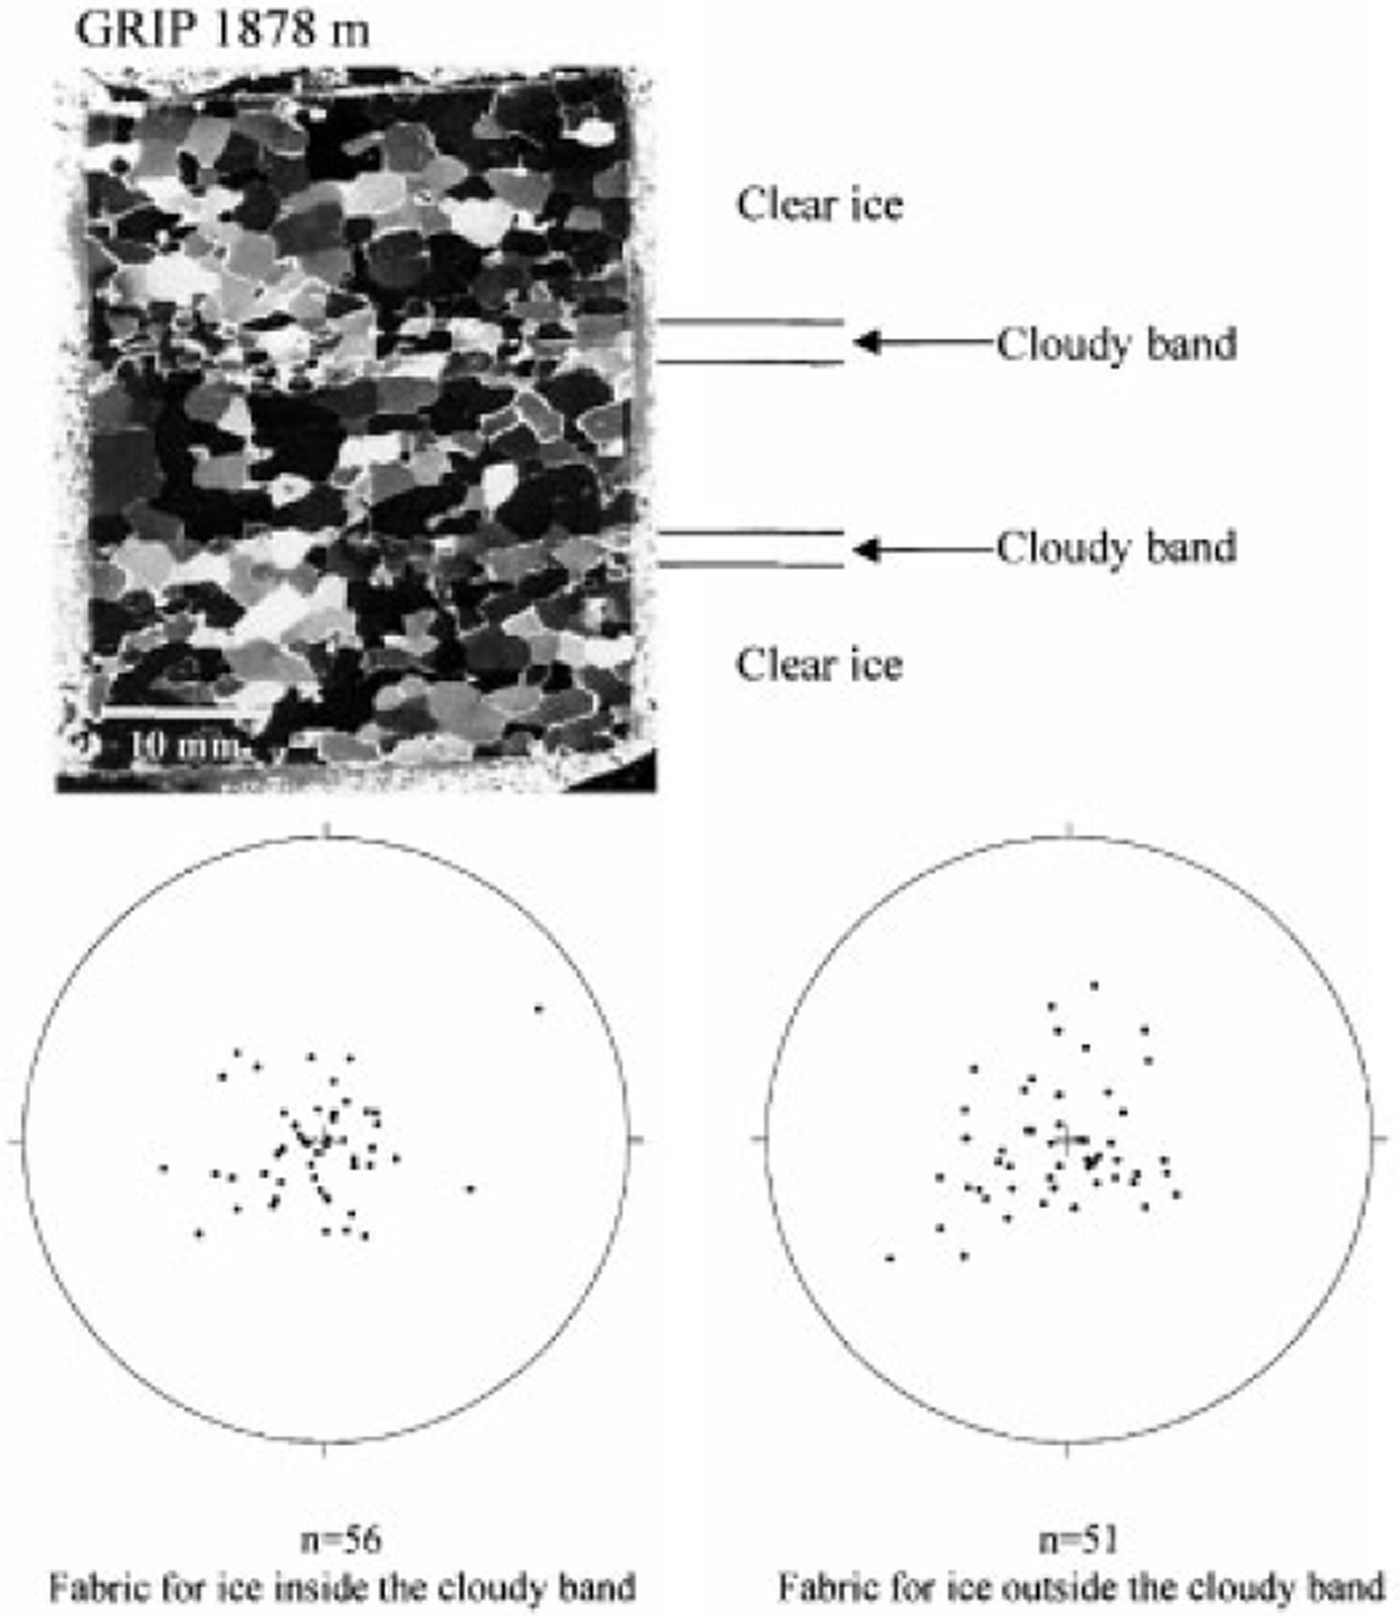
Fig. 6. Photograph through crossed polarizers of a vertical thin section, showing the typical cloudy-band structure in the GRIP ice-core sample from 1878m depth. The Schmidt-net plots represent c-axis orientation for ice inside and outside the cloudy band.
Acknowledgements
The authors would like to thank all members of the Greenland Ice Gore Project, organized by the European Science Foundation, for their support and cooperation in this study. We also thank the National Science Foundations of Denmark and France, and the Japanese Ministry of Education for financial support. Discussions with T.H. Jacka were helpful and his suggestions have improved this paper.



