


Introduction
Siple Dome is an elevated feature of the West Antarctic ice sheet, bounded on both flanks by ice streams approximately 400 m lower in elevation. Recently, a program of deep drilling at the summit of the dome resulted in the recovery of a ~ 1000m ice core to bedrock. Accurate interpretation of the core record requires information about the recent accumulation pattern and the rate of ice-thickness change. the work described in this paper is one of several ancillary studies contributing to that interpretation.
The dome forms an interstream ridge between Ice Streams C and D, two of a series of large ice streams draining the Siple Coast region ofWest Antarctica (Fig.1). This region of the ice sheet is known to have undergone significant changes in the past, including ice-stream shut-down (Reference Retzlaff and BentleyRetzlaff and Bentley, 1993; Reference Jacobel, Scambos, Raymond and GadesJacobel and others, 1996), changes in ice speed (Reference Bindschadler and VornbergerBindschadler and Vornberger, 1998) and migration of the ice-stream margins (Reference Jacobel, Scambos, Nereson and RaymondJacobel and others, 2000). An obvious issue is how changes in the neighboring ice streams have affected Siple Dome.
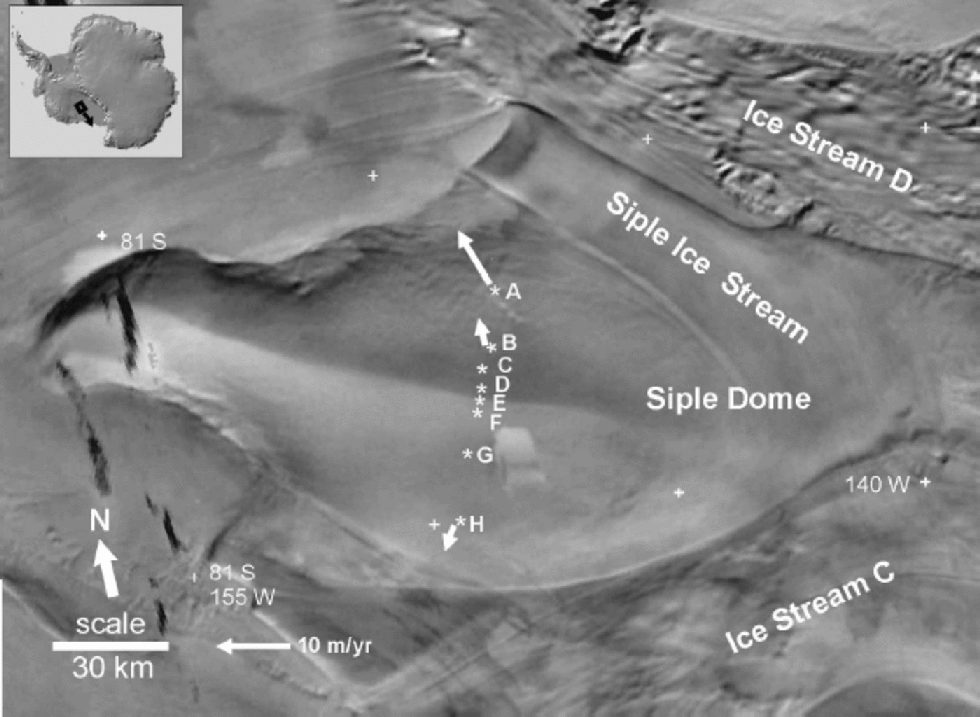
Fig. 1 Advanced Very High Resolution Radiometer satellite image of Siple Dome showing the location of measurement sites discussed in the text. Velocity vectors are included for sites A, B and H. Velocitie. at sites C, E and Fare negligible and are omitted for clarity; velocities were not measured at the remaining sites. Modified from a figure in Reference Scambos, Kvaran and FahnestockScambos and others (1999).
Radar profiling across Siple Dome shows a slight deformation in internal stratigraphy (Reference Nereson, Raymond, Waddington and JacobelNereson and others, 1998a) that is interpreted as being due to a slow northward migration of the flow divide (Reference Nereson, Hindmarsh and RaymondNereson and others, 1998b). Reference Nereson, Raymond, Jacobel and WaddingtonNereson and others (2000) attribute this divide migration to elevation changes of adjacent Ice Streams C and D. Direc . evidence for this cause would be very valuable.
The aforementioned radar profiling also indicates a gradient in accumulation rate across the dome. Modeling of the asymmetry in radar layer spacing infers an approximately 70% decrease in accumulation rate from north to south (Reference Nereson, Raymond, Jacobel and WaddingtonNereson and others, 2000). the radar layering depicts accumulation rates on the1000–10 000 year time-scale. It is important to validate this inferred gradient with direct measurements and assess if it has persisted over more recent time-scales.
This paper describes the results of field studies carried out to address (1) rates of ice-thickness (surface elevation) change across Siple Dome, and (2) the spatial pattern of snow accumulation across the dome.
Measurements and Methods
Accumulation rates are derived from analyses of ice cores collected at seven locations during the 1996/97 field season (Fig. 1). Cores were collected using standard electromechanical drilling equipment. Logging of sample dimension and mass was performed in the field at the time of drilling. the cores were returned to the U.S. National Ice Core Laboratory where continuous vertical sections were removed for the present study. Samples were prepared and analyzed for detection of elevated levels of gross beta radioactivity (Reference Pourchet and PinglotPourchet and Pinglot, 1979; Reference Whillans and BindschadlerWhillans and Bindschadler, 1988). Density profiles from snow pits (personal communication from C. Shuman, 1999) are used to fill the gap between the 1996/97 snow surface and the bottom of the coring trench. the derived accumulation rates are 42 year averages.
Rates of ice-sheet thickness change are obtained using the submergence-velocity, or ``coffee-can’’, technique (Reference Hamilton and WhillansHamilton and Whillans, 2000). This method entails comparison of ice vertical velocity with local accumulation rate. Both measured quantities apply to long time-scales. Thus, calculated rates of thickness change represent long-term behavior of the ice sheet.
Vertical velocity is obtained from repeat global positioning system (GPS) surveys of markers installed ~5–20mdeep in firn. At each site, a suite of 3–5 markers is installed at various depths and hence different densities in the upper firn. the purpose of installing several markers is to test for measurement repeatability and the steadiness of firn densification and accumulation rate. Surveys were conducted in November 1996, November 1997 and December 1998 at five marker sites on Siple Dome (Fig. 1). on each occasion, dual-frequency phase-tracking GPS receivers collected 12–24 hours of data. These data were post-processed to yield precise point positions using the GIPSY-OASIS II software package (Reference Zumberge, Heflin, Jefferson, Watkins and WebbZumberge and others, 1997) which incorporates ephemeris, Earth orientation and clock solution parameters from an independent analysis of 40-plus globally distributed continuously operating GPS receivers. Marker velocities are computed using the repeat positions.
Two adjustments are required to obtain the residual vertical velocity of ice (Reference Hulbe and WhillansHulbe and Whillans, 1994; Reference Hamilton and WhillansHamilton and Whillans, 2000). One adjustment accounts for the effects of firn compaction beneath each marker, and is based on the principles of Sorge’s law (Reference PatersonPaterson, 1994). At a given place and depth, density remains constant with time, assuming there is no change in accumulation rate or temperature. In this case, the downward motion of a near-surface layer is equal to the long-term accumulation rate, expressed as a mass per unit area, divided by the firn density at that layer depth. the adjustment is made using depth–density profiles obtained from measurements of core-sample dimensions and mass, and smoothed using a Gaussian filter. the purpose of the filtering is to remove small-scale fluctuations, and produce ``long-term average ’’depth–density profiles for each site (Reference Hamilton and WhillansHamilton and Whillans, 2000).
Notes: 42 year averages are based on the 1955 reference horizon, and the 32 year averages are based on the 1965 horizon. the 1year averages are based on pole burial rates measured between November 1997 and December 1998 and an assumed surface snow density of 0.35 Mg m–3. Values in parentheses are 1σ uncertainties.
A second adjustment is required to account for vertical velocity caused by markers flowing downslope. This adjustment is made using derived horizontal velocities (from the repeat GPS surveys) and surface slope in the direction of flow. Surface topography was surveyed at each site by kinematic GPS techniques, in which a receiver mounted on a snowmobile was driven in a pattern extending 1–2 km from each suite of markers (Fig. 2). Flow speeds at sites on Siple Dome are slow, so this adjustment results in only a small change in vertical velocity.
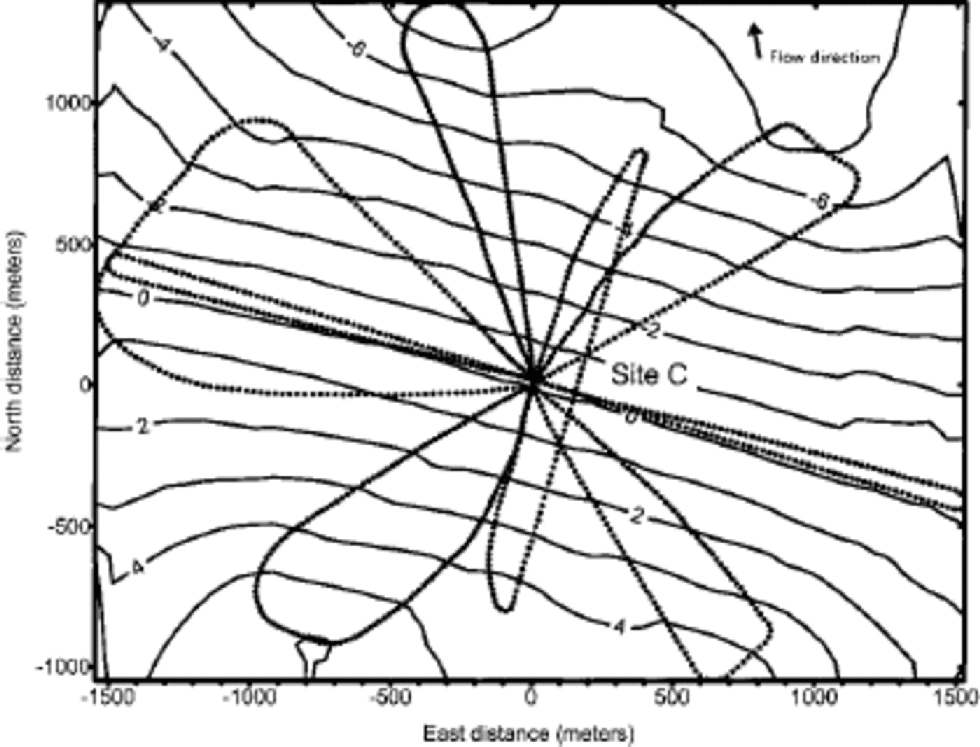
Fig. 2 Snow surface topography around site C obtained using kinematic GPS techniques. Dotted lines indicate the survey tracks. Position and elevation data were gridded and interpolated to produce the contour map. Two-metre contours are shown. Ice flow at site C is1.34 m a–1 in the direction indicated by the arrow.
Accumulation Rates
There is a spatial gradient in snow accumulation across Siple Dome (Table 1). At site A (30 km north of the divide), the accumulation rate is 0.155 (0.014) m a–1 (water equivalent), based on the depth of the 1955 bomb horizon. Accumulation rates gradually decrease from 0.121 (0.013)ma–1 at the divide (site F) to 0.086 (0.014)ma–1 at site H (30 km south of the divide). the gradient in accumulation rate from core measurements is consistent with that estimated from radar stratigraphy (Reference Nereson, Raymond, Jacobel and WaddingtonNereson and others, 2000) for the entire length of the 60 km transect. However, Reference Nereson, Raymond, Jacobel and WaddingtonNereson and others (2000) note the possibility of steeper gradients in accumulation close to the divide (within 2–4 km) than are apparent in the present results.
Table 1. Accumulation rates at sites on Siple Dome, expressed as water equivalents
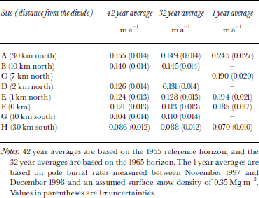
The gradient in accumulation rate is also apparent if the 1965 bomb horizon is used as the reference depth (Table 1). There is no clear trend toward increasing or decreasing accumulation in the 32 year records compared to the 42 year averages, and values over both time intervals are consistent given the expected errors.
Snow-accumulation rates based on the burial of exposed GPS survey poles are not consistent with results from the core analyses. One-year averages are on the order of 50% larger than decadal estimates for most sites (Table 1). While the pattern of higher accumulation on the northern flank compared to the southern flank is maintained, there is some spatial variability along the transect of sites. These inconsistencies are not unusual in light of the interannual variability in snowfall.
Ice-Thickness Changes
Siple Dome appears to be very close to steady state (Table 2). No detectable change in ice thickness is obtained at four of the five sites. the exception is site A, the site farthest from the divide on the northern flank (Fig. 3), where slow thinning of 0.047 (0.024)ma–1 is calculated.

Fig. 3 Rates of ice-thickness change in m a–1for sites on Siple Dome superimposed on a figure from Reference Nereson, Raymond, Jacobel and WaddingtonNereson and others (2000) showing elevation and internal stratigraphy.
Table 2. Values used to calculate rates of ice-thickness change, where dH/dt = bρ + z + uα
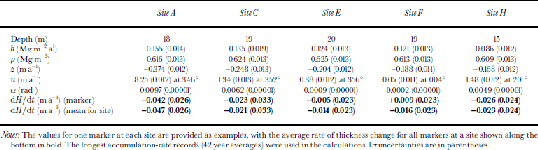
Uncertainties in the rates of thickness change, derived using the law of propagation of variances (Reference Hamilton and WhillansHamilton and Whillans, 2000), are about 0.025 ma–1.The error budget for the Siple Dome sites is dominated by uncertainties in the measurement of core diameter and in GPS positioning of the markers. Core diameter enters into the calculation of density and accumulation rate. In this analysis, it is assumed that core diameter is measured with a precision of 0.0005 m (personal communication from G. Lamorey, 1999). GPS surveying reliably yields marker velocities with an uncertainty of about 0.012 ma–1with 2 years of observation. In principle, conducting repeat surveys at a future date can reduce the total errors in the rates of thickness change.
At site C, the uncertainty in the rate of thickness change is larger than for other sites. the reason for this larger uncertainty is the lack of a direct measurement of accumulation rate at this site. Cores were collected at two nearby sites: site B (3 km to the north) and site D (2 km to the south). the gradient in measured accumulation rates between these two sites was used to prescribe an accumulation rate for site C. This value has a larger uncertainty than a direct measurement, and this in turn contributes to a larger total error in the calculated rate of thickness change.
Vertical motion of the crust due to postglacial rebound is not considered in the calculations of thickness changes. Modeled rates of rebound can be as large as ~0.005ma–1 (Reference James and IvinsJames and Ivins, 1995) in the Siple Coast region. While relatively substantial, this amount of uplift would not significantly change the present results, and in the absence of reliable direct measurements of rebound, the effect is not considered here.
Discussion
The measured accumulation-rate gradient across Siple Dome is consistent with results from other studies. Reference Zwally and GloersenZwally and Gloersen (1977) first described an apparent north–south decrease in accumulation using satellite microwave observations. This trend was confirmed from snow-pit and core measurements (Reference WhillansWhillans, 1984; Reference KreutzKreutz and others, 1999). the measured accumulation rate at the divide (0.121ma–1) is very similar to values reported by Reference WhillansWhillans (1984) (0.134ma–1 from a 4m snow pit) and Reference KreutzKreutz and others (1999) (0.12ma–1 from a shallow firn core). Reference Nereson, Raymond, Jacobel and WaddingtonNereson and others (2000) used differences in internal layer spacing as observed by radar to infer a decreasing gradient in accumulation rate from north to south across the dome, although radar-inferred accumulation rates are slightly smaller than estimates from core analyses. At site A, internal stratigraphy from radar gives an accumulation rate of ~0.14ma–1 compared to 0.155 ma–1 from core analysis. At site H, the radar-derived accumulation rate is 0.06ma–1 which is smaller than the core estimate of 0.086ma–1. Core and radar estimates are consistent given their expected respective errors, although it is possible that some real difference exists because each method samples different time periods. on the whole, the analysis of cores described here confirms accumulation amounts and gradients from earlier work.
The north–south decrease in accumulation rate is probably due to orographic lifting of moisture-laden weather systems originating along the Ross and Amundsen Sea coasts. Reference KreutzKreutz and others (1999) identify these regions as the dominant moisture sources for Siple Dome, based on the glaciochemistry of a shallow ice core collected at the divide. As these weather systems move across the Siple Coast they are forced to rise by the topography of the dome. the elevation change causes air masses to deposit more precipitation on the dome’s northern flank relative to the divide and the southern flank (Reference BromwichBromwich,1988).
The orographically driven accumulation-rate gradient seems to have persisted for several thousand years. Firn-core measurements refer to the most recent ~50 years of snow accumulation, whereas the radar-derived estimates cover the last ~1000–10 000 year period (Reference Nereson, Raymond, Jacobel and WaddingtonNereson and others, 2000). the persistence of this pattern is interpreted as evidence that Siple Dome has existed as an elevated feature and has influenced moisture deposition since at least the Last Glacial Maximum, and was not overrun by the surrounding ice streams.
Additional evidence for the longevity of the dome comes from the thickness-change results. These results have long-term significance because the two quantities being compared, vertical velocity and average accumulation rate, are stable over long periods (Reference Hulbe and WhillansHulbe and Whillans, 1994; Reference Hamilton and WhillansHamilton and Whillans, 2000). Thus, the general lack of detectable thickness changes indicates that there have been no substantial variations in surface elevation of the divide or the flanks for potentially several thousand years. the current elevation difference between the divide summit and the surrounding ice streams is on the order of ~400m. Assuming a fixed elevation for the summit and a constant thinning rate on the flanks since the Last Glacial Maximum, a present rate of thinning of approximately 0.04 ma–1 would be required to account for the elevation difference. Such a signal is detectable using the current method, but only site A (the northernmost flank site) indicates significant thinning at this level. Elsewhere on the dome, thinning since the Last Glacial Maximum cannot have exceeded ~250m, based on the uncertainties in calculated rates of thickness change.
The present results appear to be inconsistent with earlier work regarding thickness changes across Siple Dome. Reference NeresonNereson (2000) solved the continuity equation along a flowline on the southern flank of the dome, close to where the present measurements were made. the results indicated current thickening on this flank at ~0.05–0.1ma–1 in response to the shut-down of rapid ice-stream motion along the southern boundary of the dome about 200–500years ago. At the location of site H (30 km south of the divide), Reference NeresonNereson (2000) calculated an ongoing thickening rate of 0.045 ±0.02ma–1 (see Reference NeresonNereson, 2000, fig. 7) which is not in agreement with the present steady-state result for that site. A possible explanation for some of the disagreement is that the continuity calculations used an incorrect range of flowline divergence parameters. Reference NeresonNereson (2000) also expressed some uncertainty in the accumulation rates used in the calculations, although, as described earlier, the radar-inferred accumulation rates tend to underestimate those from core analyses, which would have the effect of underestimating the rate of thickening. the thickening response obtained from continuity considerations was used in conjunction with numerical modeling to bracket the timing of the shut-down of rapid ice-stream flow along the southern boundary at 200–500years ago (Reference NeresonNereson, 2000). However, the modeled thickness changes at site Hare consistent with the present steady-state results if the model assumes more recent shutdown of rapid ice flow ~100 years ago (Reference NeresonNereson, 2000, fig. 7).
Reference NeresonNereson (2000) did not have the necessary field data to solve the continuity equation for the northern flank of Siple Dome, so no direct comparisons with the present results are possible. However, a small amount of thinning detected at site A, 30 km north of the divide, seems to be inconsistent with an apparent northward migration of the divide inferred from deformation of internal stratigraphy (Reference Nereson, Raymond, Waddington and JacobelNereson and others, 1998a). This migration, likely to have persisted for the past 1000 years, implies that the northern flank should currently be thickening. Two hypotheses are considered as explanations for the calculated thinning: (1) accumulation rate at this site has recently decreased; and (2) there has been a recent increase in the drawdown of ice from this flank towards the grounding line of Ice Stream D. Limited available evidence for changes in accumulation rate (Table 1) does not support the first hypothesis that snowfall at this site has decreased. While it is acknowledged that these records are only a few decades in length, a comparison between core-derived accumulation estimates and those derived from radar stratigraphy implies that snowfall rates have increased in recent times relative to ~1000 years ago. Thus, a change in accumulation rate does not appear to be the cause of thinning at site A. the second hypothesis requires that ice flow at site A be toward the northwest in the direction of Ice Stream D’s grounding line, as is the case (Fig. 1). Other measurements of horizontal velocity (personal communication from T. Scambos, 2001) show that, close to the divide, flow is generally northward and that close to site A ice begins to flow northwestwards. One suggestion is that retreat of the grounding line at the mouth of Ice Stream D is drawing ice from the northern flank of Siple Dome, causing a small amount of thinning. for this scenario not to contradict the inferred migration of the divide over the past 1000 years (Reference Nereson, Raymond, Waddington and JacobelNereson and others, 1998a), the increased drawdown of ice associated with grounding-line retreat is required to have a recent origin.
Conclusions
Siple Dome appears to be close to steady state. No detectable changes in ice thickness are calculated at four of five studied sites, indicating that elevation changes since the Last Glacial Maximum have not exceeded 250 mat the deep ice-core site on the divide. A small amount of thinning detected at the northernmost site might be the result of recent ongoing retreat of Ice Stream D’s grounding line.
The recent flow history of ice surrounding the dome is complex. Ice streams on either side of the dome have ceased rapid motion within the last few centuries (Reference Jacobel, Scambos, Raymond and GadesJacobel and others, 1996; Reference Nereson, Raymond, Waddington and JacobelNereson and others, 1998a), leading to changes in ice thickness on the flanks. the present results imply that the cessation of rapid flow along the southern boundary of Siple Dome occurred more recently than previously thought.
Accumulation rates derived from shallow cores collected alonga transect across the dome show a north–south gradient of decreasing accumulation. These results are consistent with earlier studies, and point to the importance of orographic processes in controlling medium-scale variability in accumulation rate inWest Antarctica.
Results from this study show that Siple Dome is a stable feature in the geography of West Antarctica. No large ongoing changes in ice thickness (elevation) are calculated, indicating that surrounding ice during the Last Glacial Maximum did not overrun the dome. In addition, the measured accumulation-rate gradient is a persistent characteristic of the dome, implying that orographic lifting of weather systems (due to the presence of elevated topography) has been taking place since at least the Last Glacial Maximum.The longevity of Siple Dome has important implications for interpretation of the deep ice-core record and also for reconstructions of the West Antarctic ice sheet at the Last Glacial Maximum (e.g. Reference Conway, Hall, Denton, Gades and WaddingtonConway and others, 1999).
Acknowledgements
S. Price, B. Spikes , K.Taylor, I.Whillans and M.Willis assisted with various aspects of the fieldwork. L. Stearns assisted with the determination of accumulation rates. I am grateful to the Polar Ice Coring Office drilling team for recovering the cores. T. Scambos, D. Morse and an anonymous reviewer provided comments that improved the manuscript. Supported by NSF-9419396.


