

Introduction
Snow can be considered as a heterogeneous dielectric material consisting of ice, air and, in wet snow, of water. The density of snow and its liquid-water content are correlated to the dielectric properties. They are most often measured by capacitive methods. The methods developed for snow (Reference DenothDenoth and others, 1984; Reference DenothDenoth, 1989; Reference MätzlerMätzler, 1996) can only be used for short-term measurements, because the required sensors are of a higher specific density than seasonal snow and absorb a substantial amount of solar radiation when they are located near the surface. Metallic cable time-domain reflectometry (TDR) has gained widespread use for measuring water content in soils and rocks (Reference Topp, Davis and Annan.Topp and others, 1982; Reference Knight., White and Zegelin.Herkelrath and others, 1991). A significant advantage compared to capacitive methods is the small sensitivity to variable conductivity. TDR sensors can be configured in different ways with little effort. This characteristic can be used to make sensors of different geometries, specifically adapted to the medium of interest. A disadvantage compared to capacitive measurements is the complex signal which is received by TDR. This signal requires a non-trivial interpretation before the permittivity ran be calculated. The first application of TDR to the measurement of snow density and wetness was by Reference Stein. and Kane.Stein and Kane (1983). They only showed the signal but did not make calibrations. Reference Schneebeli, Davis. and ArmstrongSchneebeli and Davis (1993) calibrated the dielectric constant and snow wetness for a limited number of values. Reference Stein, Laberge and Lévesque.Stein and others (1997) compared the dielectric constant measured by TDR to snow density and wetness. Reference LundbergLundberg (1996) concentrated on the measurement of snow wetness and fitted an empirical model to seasonal snow of a higher density (350 kgm−3).
Another possibility for measuring the dielectric snow-cover properties over time is radar (Reference Gubler and Hiller.Gubler and Hiller, 1984). Radar is a truly non-destructive technique. However, the layer-to-layer variation of the permittivity can only be determined by destructively measuring the snow density and height of each layer.
Theory
The TDR method measures the return time of an electronic pulse transmitted through a finite-length cable or probe. The return time of the pulse is affected by both the length of the cable or probe (travel distance) and the permittivity of the insulator around the cable or probe (propagation velocity). Changes in impedance along the cable produce additional reflections that can be used to identify the location of the change. When the physical length of the probe is known, the permittivity of the insulator (snow) around the probe can be determined. The band of frequency where the permittivity is measured depends on the rise time of the pulse. Commercial TDR instruments are often in the range 10 MHz to 1 GHz, with the central frequency around 200 MHz. This corresponds to a rise time of about 200 ps.
The apparent permittivity εa is defined as

where ε’ is the real part of the relative permittivity, ε" is the imaginary part of the relative permittivity and the loss tangent ![]() . The real part of the relative permittivity of ice is 3.15 and of air 1.00. The travel time of the electromagnetic pulse within the snow is determined by measuring the impedance mismatch at the beginning and end of the probe. The difference between these two locations gives an electromagnetic length l
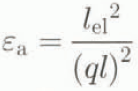
e1. The relation between geometric probe length l, the apparent electromagnetic length lel
and the apparent permittivity εa
is
. The real part of the relative permittivity of ice is 3.15 and of air 1.00. The travel time of the electromagnetic pulse within the snow is determined by measuring the impedance mismatch at the beginning and end of the probe. The difference between these two locations gives an electromagnetic length l
e1. The relation between geometric probe length l, the apparent electromagnetic length lel
and the apparent permittivity εa
is
Due to impedance mismatches caused by impedance jumps (especially within the multiplexer), reflections occur which make calculation of the very small imaginary part of the permittivity ε difficult if not impossible. For this work, we assume that for the frequency domain used by TDR the ratio ![]() . The loss tangent would then be very small and the apparent permittivity corresponds to the real part of the permittivity.
. The loss tangent would then be very small and the apparent permittivity corresponds to the real part of the permittivity.
Method
The experimental equipment consists of a cable tester (Tektronix 1502B), a notebook computer and the TDR probe. For continuous measurements in the snowpack, the automated measurements are done by interfacing a Campbell CR10 data logger and coaxial multiplexer. Two different types of TDR probe have been developed for measurements in snow. One is used for measurements in snow pits or in the laboratory (called the manual probe); the second one is used for long-term measurements within the snowpack (called the snow probe). The manual probe has a length of 28 cm and is two-pronged. Special attention has been given to an electromagnetically smooth transition from the coaxial cable to the two-pronged probe. The resulting signal is then as good as that from a three-pronged probe (cf. Reference Zegelin, White and Jenkins.Zegelin and others, 1989). The ends of the two steel rods are sharp tips, such that even hard snow can be penetrated. A guide keeps the rods parallel when they are inserted and are removed before measurement. The snow probe is constructed from a thin-walled aluminum tube (3 mm diameter, thickness of wall 0.3 mm) (Fig. 1). The length of the probe is 300 mm. Instead of the usual open circuit, the probe is short-circuited. This feature stabilizes the rods mechanically and changes the resulting signal only by sign (Fig. 2). The connectors are screwed SMA type and cables are thin 5 Ohm coaxial (RG-188). The total weight of the sensor is about 10g. A semi-rigid aluminum frame with dimensions of 50 cm × 50 cm has been constructed to position the probes flat on the snow surface. Three probes are fixed on the frame with 0.1 mm diameter nylon thread.

Fig. 1. Sketch of the construction snow probe. The snow probe is connected by a thin coaxial cable to the cable tester or the coaxial multiplexer.

Fig. 2. Example of a digitized waveform from the snow probe. The end refection is inverted compared to a normal probe (see Fig.3).
The electromagnetic length of the signal is calculated directly from the digitized signal. The digitized signal, consisting of 251 values and with a vertical resolution of 128 digits is first smoothed with a five-point moving average and converted to a real valued array (Fig. 2). This array is used to calculate the first derivative (centered difference). High values of the first derivative define an impedance mismatch. The algorithm checks for the first and second high values of the first derivative. These values are then used to locate the steady and rising part of the signal. Straight lines are fitted to the pieces and the intersections of the lines define the start of an impedance mismatch. The difference between these two values is used to calculate the electromagnetic length. This algorithm is similar to that of Reference Heimovaara and Bouten.Heimovaara and Bouten (1990) but a simple linear regression is used instead of a weighted one, with no loss in locating the mismatch.
Laboratory Measurements
The calibration of snow density was done using different snow types and temperatures. The measurements at the Swiss Federal Institute for Snow and Avalanche Research (SFISAR) were made in the field, while those at the Centre d’ Étude de la Neige (CEN) were done using sieved snow in the laboratory (Fig. 3). Both datasets show a similar amount of scatter. No influence of snow type or temperature could be observed. Grain-size has no effect on the measured permittivity. The apparent permittivity is highly correlated with gravimetrically determined snow density (correlation coefficient r = 0.988). The formula
where ρs is the density of snow in kg m−3, is the best fit to the data. This is very similar to the linear model of Reference Tiuri, Sihvola, Nyfors and Hallikainen.Tiuri and others (1984) where they proposed ε’eff = 1 + 0.0017ρs + 0.0007ρs 2 . However, a systematic deviation between the measured values and the second-order polynomial model from Reference Tiuri, Sihvola, Nyfors and Hallikainen.Tiuri and others (1984) as well from Reference MätzlerMätzler (1996), who found that ε’eff = 0.99 + 0.00159ρs + 0.00186ρs 3 . occurs (Fig. 4). The fit of Mätzler shows excellent agreement of the measurements with theory. The permittivities measured with TDR are higher. We suppose that this deviation is caused by the small compaction of the snow around the rods. The highest sensitivity of the electromagnetic field is directly around the rods (Reference Knight., White and Zegelin.Knight and others, 1994) and the sign of the deviation is in the direction expected by such an effect. This hypothesis is supported by comparing the sensors used for the empirical fits of Reference Tiuri, Sihvola, Nyfors and Hallikainen.Tiuri and others (1984), Reference DenothDenoth (1989) and Reference MätzlerMätzler (1996). The measurements by Tiuri and others were made using a two-pronged capacitive probe, those of Denoth using a plate and Mätzler’s using a coaxial probe. The coaxial probe has the least compaction and the most homogeneous electromagnetic field. The measurements by Tiuri and others are between our relationship and that of Mätzler. The relationship of Denoth is between ours and Tiuri and others. Measurements using a coaxial probe correspond to a very high degree to those of Mätzler (personal communication from B. Lesaffre and F. Touvier, 1997). We conclude that the combined effects of compaction and distribution of the electromagnetic field caused by different sensors are important for measuring the relative permittivity in snow.

Fig. 3. Example of a digitized waveform.. The thick line is the aquired wave. The absolute value of the first derivative diminishes with increasing travel time due to dispersion.

Fig. 4. Measured dry-snow density compared to the measured real part of the permittivity (symbols) and compared to empirical fits of snow density to permittivity.
The TDR measurements reported here are significantly better than those reported by Reference Stein, Laberge and Lévesque.Stein and others (1997). Their correlation coefficient r is 0.78 for their best model and over a smaller range of densities (150–400 kgm−3) than measured in this study.
The wet-snow measurements in the laboratory do not show a good correlation to water content, especially when measured with different densities. This is caused by the difficulties in manufacturing sufficiently large and homogeneously wet-snow samples. Due to the rapid drainage of water from the snow, the samples taken for an independent determination of the water are already drier than the measurements taken with TDR at a high snow wetness. A more reliable method must therefore be sought. It was not possible to improve the results ol Reference Schneebeli, Davis. and ArmstrongSchneebeli and Davis (1993) and Reference LundbergLundberg (1996) significantly.
Field Measurements
The field measurements were done at Col de Porte in the French Alps (1325 m a.s.L). The six probes were placed on the snow surface during a snowfall (Fig. 5). The probes were buried about 20 cm deep from day 2 to 22 and 5 cm deep from day 22 to 55 (Fig. 6). The calculated density (Equation (3)) of the snow measured by the probes is shown in Figure 7. The snow was dry until day 19. The increase in density caused by the settlement of the snow can be seen clearly. The calculated densities are lower than those measured in a nearby snow pit. Based on the few data, two explanations are possible. First, it may be the inverse effect observed during the laboratory calibration, because the snow probe causes no compaction compared to the hand probe. Secondly, the snow-pit measurements arc different from the density at the location of the TDR probes. The calculated density from disks moving in the snowpack is significantly lower on day 15 than the density measured in the snow pit (Fig. 5).

Fig. 5. Meteorological and snow data for the field measurements at Col de Porte. The snow density with disk is measured using a moving disk. Their heights are continously measured and the density can be calculated from the initial density and the settlement. The snow temperature is measured at the depths of the TDR snow probes.

Fig. 6. Depth of the TDR snow probes below the surface.

Fig. 7. Density calculated from the change in permittivity within the snow cover shown for the six probes within the same layer. The dots show the density measured in a nearby snow pit.
During the measurements, a high-frequency scatter is observed (Fig. 8). We suppose that this is caused by an instability in the electronics. These jumps could be removed using a median smoother to the time series.

Fig. 8. Original signal of the TDR measurements (line with points ) and median smoothed signal. The jumps are caused by the electronics used.
The sudden increase in density during and after day 23 is caused by liquid water (meltwater) and densification. The calculated density recedes to 200 kg m −3 following day 25. This may be caused by the formation of an air pocket around the probes due to insulation, because from this time the snow probe was buried only by about 50 mm of snow. Although the snow temperature was near to 0°C during the day. the signal shows no meltwater infiltration with daily temperature fluctuations during days 24 to42. From days 42 to 48, an increase in “density” can be recognized but this value cannot be quantitatively interpreted. Afterwards, the probes appeared at the surface of the snow.
Conclusions
TDR can be used to determine snow density with high precision and Over an extended period, even when the sensor is only buried shallowly. It shows a very similar relationship between apparent permittivity and snow density as do other methods, which are based on frequency-domain methods. The lightweight sensors show promising potential for continuous measurement of the permittivity of snow in the field. In addition, the multiplexing possibilities will permit detailed analysis of infiltration patterns and variations in settlement. Calibration of the TDR system for liquid-water content has not yet been successful, because of the difficulties caused by manufacturing wet-snow samples. Infiltration events could be clearly detected with the continuously monitoring snow probe and the estimated water content was reasonable. Additional measurements are necessary, especially at greater depth, to evaluate the performance of the continuous measurements definitively.
Acknowledgements
We thank W. Caviezel for the skillful construction of the probes, R. Wetter for the electronics and C. Quadri for help with measurements.


