1. Introduction
The sea ice that forms in the polar oceans plays a key role in driving the world’s oceanic circulatory system and hence the world’s climatic system. it is therefore important to understand the processes which influence the extent of this sea ice. Reference Squire, Dugan, Wadhams, Rottier and LiuSquire and others (1995) and Reference WadhamsWadhams (2000) have pointed out evidence to suggest that ocean waves play a major role in the fracturing of ice-covered seas. the analysis of this phenomenon involves many complicated variables, and considerable idealization is required. one aspect which is critical to understand is the wave scattering by the region of broken ice, known as the marginal ice zone (miz), which forms at the boundary of open water and frozen seas. this paper presents a simple model for wave propagation through the miz.
The miz is an interfacial region which forms at the boundary of open and frozen oceans. it consists of a vast field of ice floes and is subject to considerable wave action due to its proximity to the open ocean. experiments have shown that the wave intensity decays exponentially with distance from the open ocean and that this rate of decay is highly dependent on the wave period (Reference Wadhams, Squire, Ewing and PascalWadhams and others, 1986, Reference Wadhams, Squire, Goodman, Cowan and Moore1988). it has also been shown experimentally that the ice floes can bend significantly (Reference Squire and MartinSquire and martin, 1980), and it is standard to model ice floes as floating elastic plates (Reference Squire, Dugan, Wadhams, Rottier and LiuSquire and others, 1995).
A number of models for wave propagation in the miz have been presented. the most sophisticated were the fully three-dimensional models using a coupling of solutions for individual ice floes with a transport equation (Reference Masson and LeBlondMasson and leblond, 1989; Reference Meylan, Squire and FoxMeylan and others, 1997). these models, which were derived separately, have been recently shown to be almost identical (Reference Masson and LeBlondMeylan and masson, 2006). another three-dimensional model was developed by Reference Dixon and SquireDixon and squire (2001) based on the coherent potential approximation. we present here a much simpler model based on a two-dimensional solution. while this model is much simpler, it has a number of advantages over the three-dimensional models, the most important being that it is much less computationally demanding. we also believe that a simple model is the best place to begin to make comparisons with data and to test and debug the more sophisticated models. we also believe this simpler model will be able to make the kinds of predictions that are required practically, which the more sophisticated models have not been able to do.
The two-dimensional solution is based on a matched eigenfunction expansion. the model is described in detail in Reference Kohout, Meylan, Sakai, Hanai and LemanKohout and others (in press) where the solution is carefully analyzed for energy conservation, compared with previous results and compared to a series of experiments which were performed by Reference Sakai and HanaiSakai and hanai (2002) using floating plastic sheets in a two-dimensional wave tank. we are therefore confident that the numerical solution presented here is correct.
2. Formulation and Preliminaries
We model the miz as a set of floating elastic plates occupying the water surface. a small-amplitude wave is incident from the left. we assume the problem is linear and ignore any dissipation the submergence of the plates is considered negligible. we assume that the problem is invariant in the y direction. the set of plates consists of two semi-infinite plates separated by a region consisting of a finite number of plates with variable properties. the left plate edges are at x = lμ , and the right plate edges are at x = rμ for the μth plate. we note that we simulate open water by setting the plate properties, such as the thickness, to a negligibly small value. however, in the results we present here, we consider only contiguous plates except for the plate on the left where we set the thickness sufficiently small that it approximates open water. we also assume that the plate edges are free to move at each boundary. a schematic diagram of the problem is shown in figure 1. we consider fluid of finite depth because this is required by our solution method. however, we will set the depth to be sufficiently large to be modelled as infinite in the results. the solution method and formulation of this problem is described in detail in kohout and others (in press).

Fig. 1. A schematic diagram showing the set of ice floes and the coordinate systems used in the solution. The three-dimensional region is defined by -1 < x, y < 1 and -h < z ≤ 0, where we assume constant depth h. I represents the incident wave. Rμ and Tμ represent the reflection and transmission coefficients of the μth plate. lμ and rμ represent the left and right edge of the floe μ. There are Δ floes.
2.1. Assumptions and conditions
We assume that the fluid has constant depth h and occupies the region -1 < x, y < 1 and -h < z ≤ 0. in this region the fluid flow is irrotational and inviscid so that the fluid velocity can be written and the gradient of a velocity potential δ which satisfies laplace’s equation in the fluid region. we consider only incident waves of a single frequency ω and we assume that these waves also have no variation with respect to y. the velocity potential of the wave can therefore be expressed as (Reference StokerStoker, 1957; fox and squire, 1994)
Where δ is a complex-valued potential, ω is the radian frequency and R denotes the real part.
We assume the seabed is impermeable and therefore the velocity component normal to the sea floor vanishes. hence, the velocity potential at the sea floor satisfies
Using linearity at the free surface, the kinematic condition is
(Reference Billingham and KingBillingham and king, 2000), where η is the displacement. we assume the ice floes have uniform mass density ρ i and thickness т (where the thickness of each floe may vary). we assume the amplitude at the free surface is small relative to the wavelength and that the curvature is small and linearity can be applied. we assume the equation of motion for the floe is given by the elastic-plate equation
(Reference Wang and MeylanWang and meylan, 2004), where P is the pressure at the surface, D is the rigidity constant of the plate (D = Yт3=[12(1 - v2)], where Y is the young’s modulus and v is poisson’s ratio) and m = ρiт.
The dynamic condition at the free surface is given by the linearized bournoulli’s equation
(Reference StokerStoker, 1957), where P is the pressure at the water surface and ρ is the water density. equating (4) and (5) gives
Additional constraints apply at the edges of the elastic plates (Reference Fox and SquireFox and squire, 1994). we assume that the plate edges are free, which implies that the bending moment and the shearing forces at the edges are zero. therefore the edge boundary conditions can be expressed as
And
Where l and r represent the left and right edge of the plate.
2.2. Non-dimensionalizing the variables
It is convenient to reduce the number of constants in the equations by non-dimensionalizing. we non-dimensionalize by scaling the spatial variables by a length parameter L, and the time variables by a time parameter ![]() the choice of length parameter L we leave open, but two common values are the water depth h or the characteristic length L = (D/ρg)1=4 which have the effect of removing one further variable from the equations. the non-dimensional variables, denoted by an overbar, are
the choice of length parameter L we leave open, but two common values are the water depth h or the characteristic length L = (D/ρg)1=4 which have the effect of removing one further variable from the equations. the non-dimensional variables, denoted by an overbar, are

The boundary condition given by equation (6) can now be non-dimensionally expressed as
Where = D/(ρgL4) is referred to as the stiffness constant and γ = m/(ρL) is referred to as the mass constant. hereinafter, all equations are expressed non-dimensionally, and for simplicity the overbar will be omitted from the dimensionless variables.
2.3. Eliminating time
The time dependence can be eliminated from equations (2), (9), (7) and (8) using equation (1) to give us the following system of equations throughout the fluid, written entirely in terms of the velocity potential
And also using equation (3)
Where = ω2 and
3. Method of Solution
3.1. Eigenfunction expansion
We apply the eigenfunction matching method to solve for the velocity potential. this method has been applied in many situations for linear water wave problems, and the technique is described in Reference Linton and McIverLinton and mciver (2001). the method was developed by Reference Fox and SquireFox and squire (1994) for the case of the elastic-plate boundary condition.
3.1.1. Separation of variables
The potential velocity can be written in terms of an infinite series of separated eigenfunctions of the form δ=ekx cos [k(z+h)], where k satisfies the dispersion equation
The dispersion equation, because it depends on β and γ, has different solutions under floes of different properties. solving for k, the dispersion equation (15) gives one purely imaginary root with positive imaginary part, two complex roots with positive real part (in all physical cases) and an infinite number of positive real roots which approach n/h as n approaches 1, plus the negative of these roots (Reference Fox and SquireFox and squire, 1994). the imaginary roots correspond to travelling modes propagating along the x axis. the complex roots correspond to damped travelling modes, and the real roots correspond to the evanescent modes. we denote the solutions of the dispersion equation (15) under the μth floe by kμ (n), where n = -2, –1 corresponds to the complex roots with positive real part, n = 0 corresponds to the imaginary root with positive imaginary part, and n positive corresponds to the real roots with positive real part. this allows us to express the potential as a sum of eigenfunctions under each floe.
3.2. Expressions for the potential velocity
The potential δ can now be expressed as the following sum of eigenfunctions:
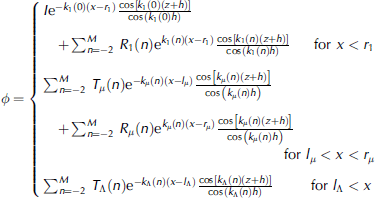
Where μ is the μth plate, Λ is the last plate, rμ represents the x coordinate of the right edge of the μth plate, lμ represents the x coordinate of the left edge of the μth plate, Rμ (n) represents the reflected potential coefficient of the nth mode under the μth plate, Tμ (n) represents the transmitted potential coefficient of the nth mode under the μth plate and I is the incident wave amplitude. note that we have divided by cos(kh). this is so the coefficients are normalized by the potential at the top surface rather than at the bottom surface. this means that if the water is deep and the potential at the bottom surface is small, we avoid the problem of having very small numbers for the coefficients in the expansion. we have truncated the expansion at a finite number of modes and we will solve for the coefficents Rμ (n) and Tμ (n) numerically. finally, we can find the displacement from the potential using equation (3).
3.3. Solving via eigenfunction matching
To solve for the coefficients, we require as many equations as we have unknowns. we impose the condition that the potential and its derivative across each floe boundary are continuous and that the floe satisfies the free-edge conditions. we impose continuity by multiplying the potentials and their derivatives by various orthogonal functions and integrating and imposing the condition that these integrals must be equal. the orthogonal functions we choose are cos(m/h)(z+h), where m is a natural number. these have the advantage that in the limit of large n the vertical eigenfunctions under each plate take this form. the coefficients can now be found through matching the integrals along the water column of the potentials and their derivatives at each adjacent edge:
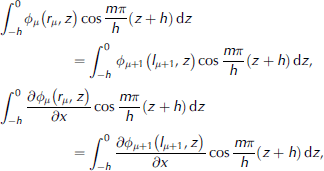
Where m 2 [0,M] and δμ is the potential under the μth plate. this gives us four fewer equations than there are unknowns at each plate boundary.
The remaining four equations are given by the two edge conditions at each plate edge:

This gives us a system of simultaneous equations which we solve for the unknown coefficients Rμ and Tμ .
4. Results
We now have a model which can be used to simulate an ocean wave propagating under a region of ice floes. we will set the water depth sufficiently large so that it can be considered infinite and choose the following values for the constants: Y = 6gpa, v = 0.3, g = 9.8ms–2, ρ = 1025.0 kgm–3 and ρ i = 922.5 kgm–3. we assume that the thickness of the semi-infinite plate on the left is sufficiently small to simulate open water. the semi-infinite plate to the right is a semi-infinite ice floe which is chosen to have the same thickness as the other floes (if the floe thicknesses are different and chosen randomly then the thickness of the semi-infinite floe is also random). a wave is incident from the left hand (open-water side) of unit amplitude and we focus our results on the transmitted energy in the righthand semi-infinite plate which we denote by E. we have four free variables: the incident period, jTj; the length of each floe, L; the thickness of each floe, т; and the number of floes, Λ (note the number of finite floes is Λ– 2).
One of the most important features of our model is that it is fully coherent. this means that we will always observe effects of cancellation and addition of waves, no matter how large the ice-floe sizes or number of ice floes. this can be seen in figure 2 where the transmitted energy in the righthand semi-infinite region, E, is shown as a function of floe length for Λ = 7 for the periods of 6, 8 and 10 s. to remove this resonating effect, we will always use random floe lengths and will present many different solutions. the floe lengths are selected at random between 10 and 1000 m. the first result we establish is to show that the effect of these random floe lengths can be neglected. figure 3 shows results for Λ = 7 for the periods shown. each sample is shown with a plus. it can be seen that there is no correlation between floe length and E. figure 4 shows the displacement for three of the random samples from figure 3. it is interesting to have some visualization of the solution which is provided by the model for each sample. it can be seen that the model provides much more information than just E since it provides the displacement of each ice floe. this implies that the model could be used to predict other effects such as floe break-up. figure 5 shows that as we increase the number of ice floes, there is still no correlation with the total floe length. we conclude that the process of setting the floe lengths to be random will be an effective way to remove the coherent effects which were seen in figure 2, and we will use this in our subsequent work.

Fig. 2. E vs floe length L for the periods T shown. т = 1 m and Λ = 7. The floes are all of identical length.

Fig. 3. E vs the total length of the all the finite-length floes for 100 trials where the length of each plate is chosen at random between 10 and 1000m for the periods T shown. т = 1 m and Λ = 7.

Fig. 4. The displacement vs distance x showing the displacement and floe geometry for three of the realizations used in Figure 3 for the periods T shown. The boxed regions represent each plate.

Fig. 5. As Figure 3 except that the period T = 6 and different values of Λ as shown are used.
Next we examine E in relation to variation in T for fixed floe thickness. figure 6 shows clear relationships between E and T, which depend on the floe thickness; it is also evident that at low periods there is a much greater variability in the value of E than at higher periods. this is to be expected since the greater the reflection, the greater the coherent effects can be. figure 7 shows that as we increase the number of floes, we get a marked decrease in E.

Fig. 6. E vs T for the values of т shown for 100 trials. The length of each plate is randomly chosen between 10 and 1000 m.

Fig. 7. As Figure 6 except that т = 1 and different values of Λ as shown are chosen.
Similar investigations are made into the effect of the floe thickness т. figure 8 shows the effect of increasing the floe thickness for different periods and fixed numbers of floes. a strong decease in E can be seen with increasing floe thickness. figure 9 shows the displacement results for three of the simulations shown in figure 8. figure 10 shows the effect of floe thickness for fixed periods and different numbers of floes. this figure also shows the strong dependence of floe thickness on E and that there is a strong decease in E as the number of floes is increased.

Fig. 8. E vs floe thickness т for 100 trials. The length of each plate is chosen at random between 10 and 1000 m. The thickness of the plates is constant for each trial and is chosen at random between 0.01 and 2m. Λ = 7.
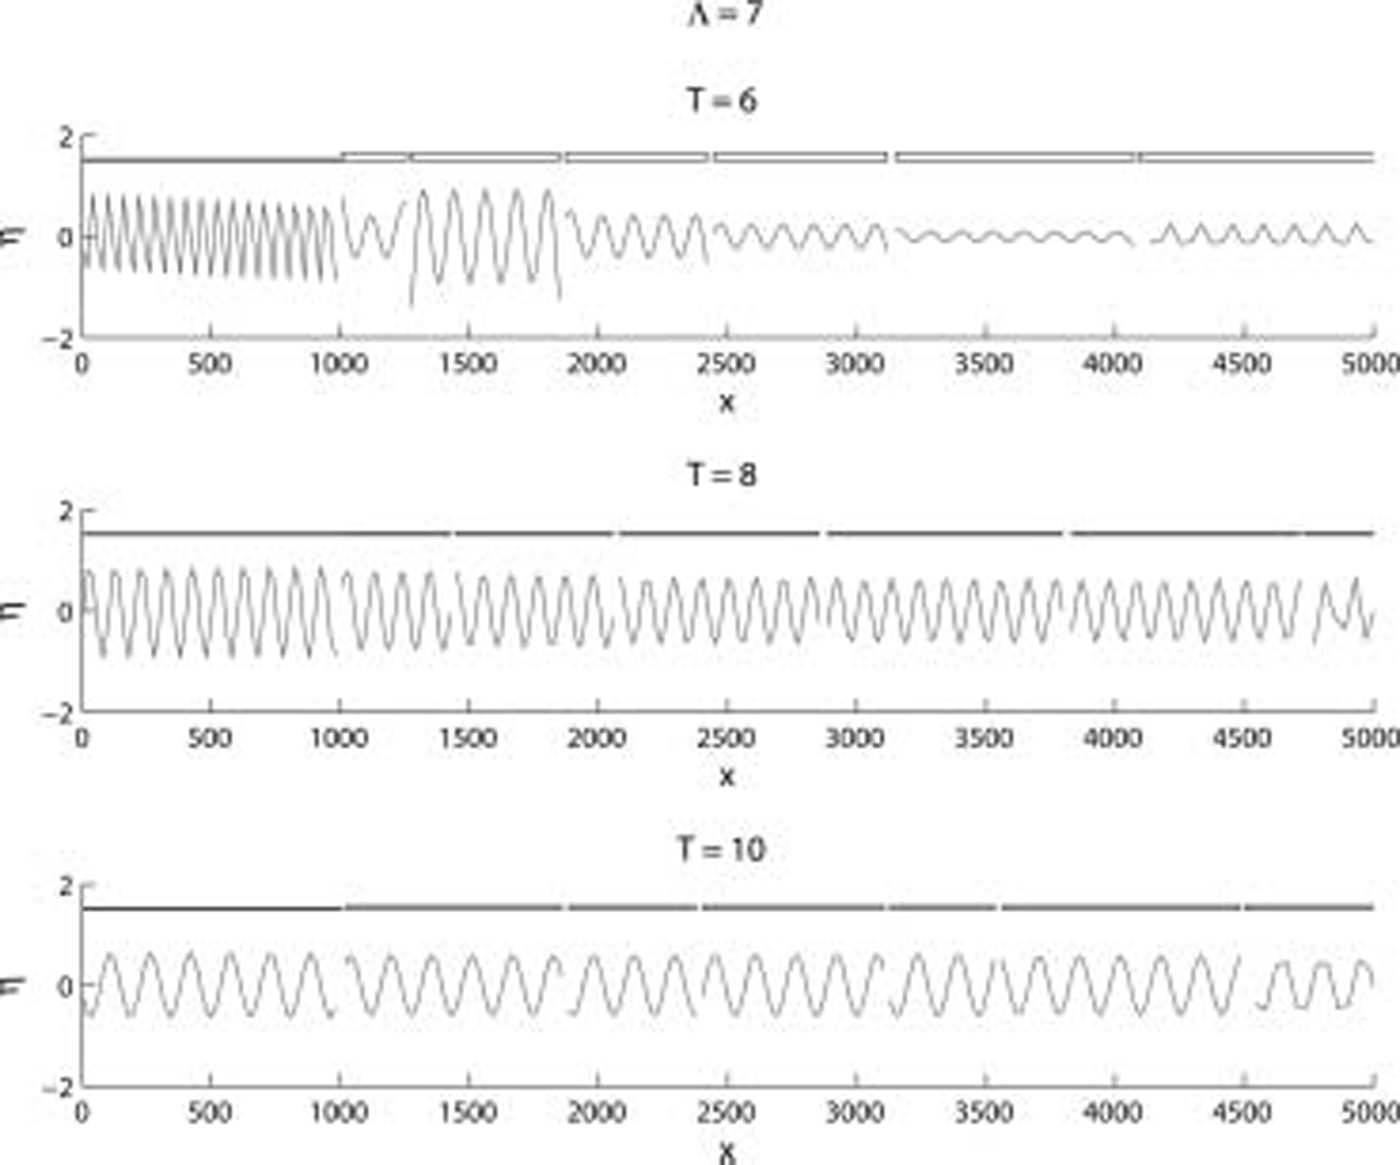
Fig. 9. The displacement vs distance x showing the displacement and floe geometry for three of the realizations used in Figure 8 for the periods T shown. The boxed regions represent each plate.
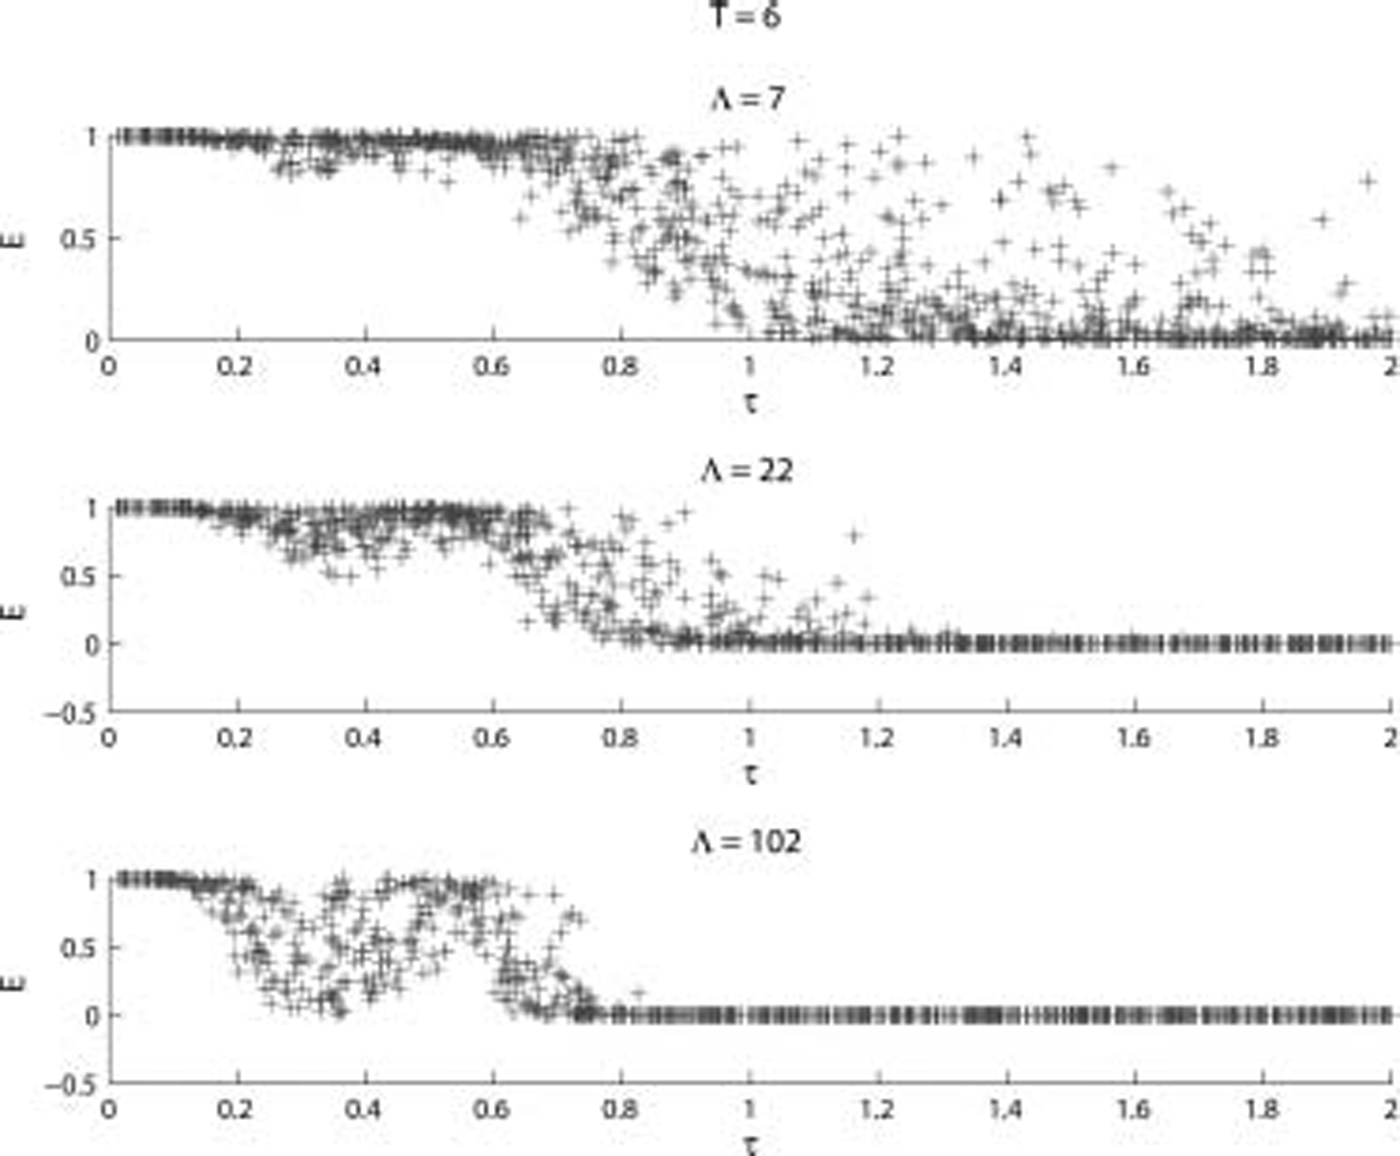
Fig. 10. As Figure 8 except T = 6 and Λ varies as shown.
figures 11 and 12 show the effect of the floe thickness on E for random floe thicknesses. interestingly, considering the strong dependence on т in the previous figures, the results for random floe thicknesses do not show the same strong correlation. figures 11 and 12 show only a slight tendency for a decrease in E as the overall т of each floe increases. the reason for the weak correlation is not properly understood and needs to be the subject of further investigation.
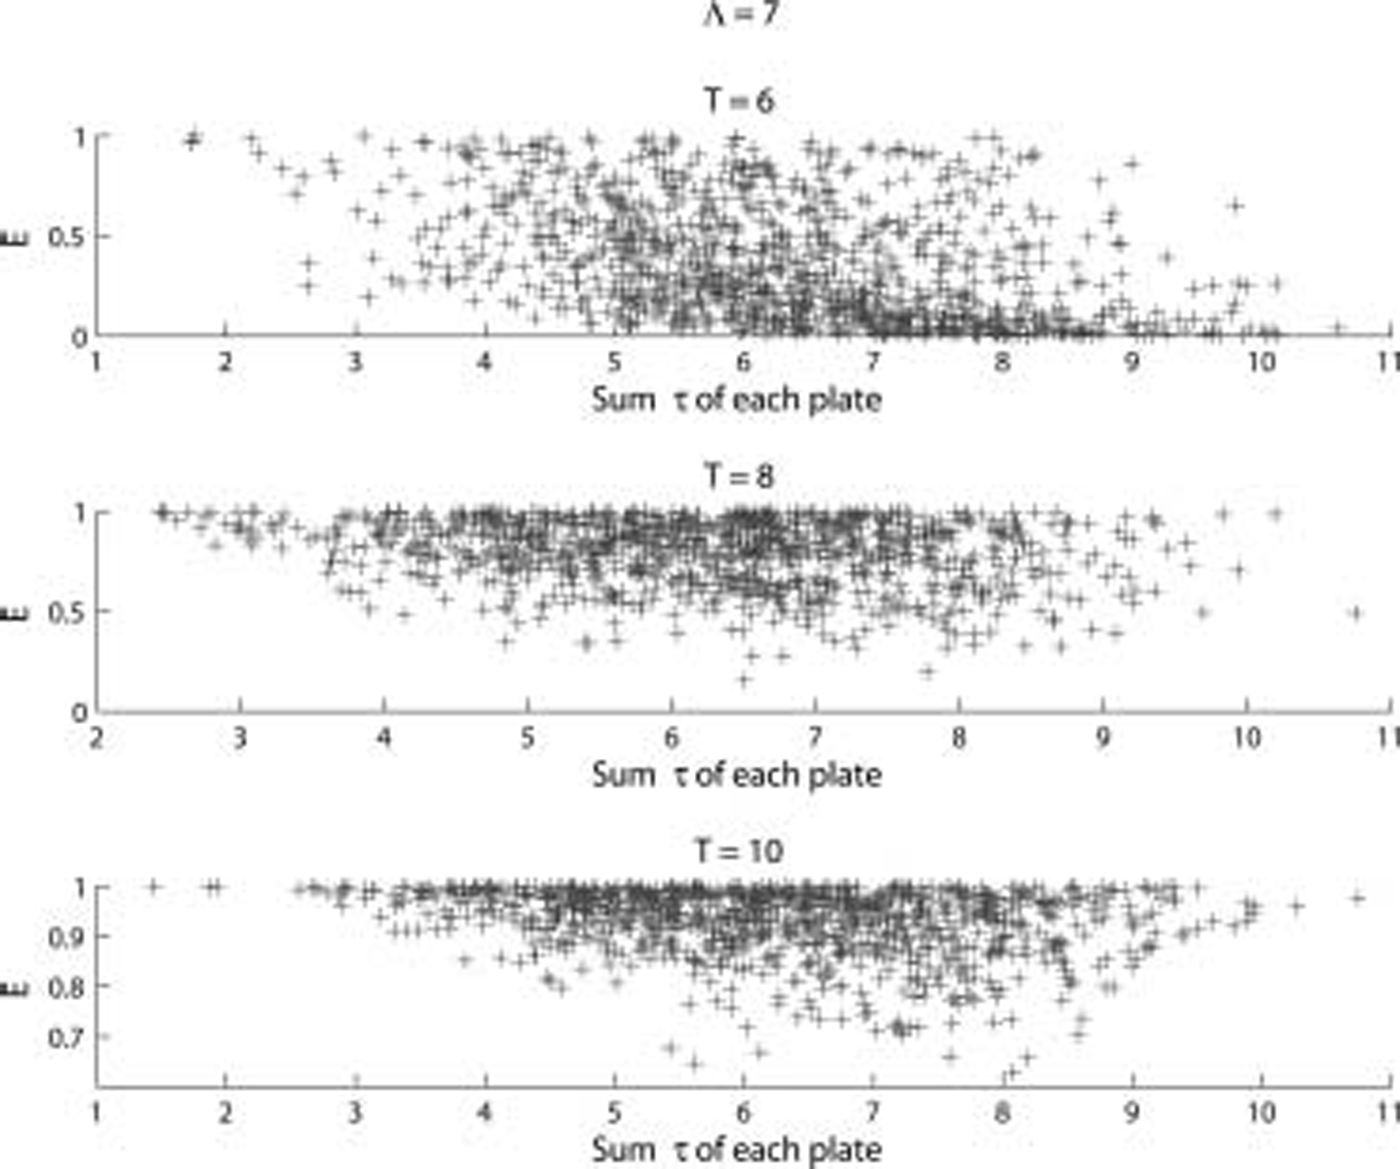
Fig. 11. E vs sum of т for each plate, where т is chosen at random between 0.01 and 2m for each plate for 100 trials for period T shown. Λ = 7.

Fig. 12. As Figure 11 except T = 6 and Λ varies as shown.
figure 13 shows the effect of increasing the number of floes. we see that E depends strongly on the number of floes and that this dependence is much stronger for small periods. figure 14 is figure 13 averaged over five trials. this figure shows more clearly the decay of energy with increasing numbers of floes. it also shows that this decay appears exponential, which agrees with the experimental results of Reference Wadhams, Squire, Ewing and PascalWadhams and others (1986, Reference Wadhams, Squire, Goodman, Cowan and Moore1988).

Fig. 13. E vs Λ for the periods T shown. т = 1 m and the length of each plate is chosen uniformly at random between 10 and 1000 m.

Fig. 14. E vs Λ for the periods T shown. т = 1 m. E is averaged over five trials where the length of each plate for each trial is chosen uniformly at random between 10 and 1000 m.
5. Summary
We have presented a model for wave propagation in the miz based on a solution for wave propagation under two-dimensional floating elastic plates. this model is fully coherent and we showed that this coherence can be removed from the model by averaging over the floe length. we then presented various curves which showed the relationship between transmitted energy and the wave period, floe thickness and number of floes. the results showed that the miz acts as a low-pass filter and that the scattering is most strongly dependent on floe thickness and number. the results presented are preliminary results from the model, and future work is planned to establish much more clearly the relationships between the various parameters. we also plan to compare the results with experimental measurements.


