

Introduction
Recently, natural disasters related to nival–glacial phenomena have become more frequent. Despite the long-term history (half a century) of study of causes and mechanisms of glacier surges, there is now an urgent need to better understand these mechanisms. We are not aware of any systematic scientific programmes of surging-glacier monitoring. Even the World Glacier Monitoring Service in its publication Fluctuations of Glaciers limits itself to descriptions of various surges and does not give recommendations for targeted observations of unstable glaciers.
Such observations are crucially important both for scientific purposes and for the projection of related disastrous phenomena. The notorious collapse of Kolka glacier, Pamirs, central Asia, in 2002 dramatically demonstrates what we might expect from surging glaciers in the absence of a special monitoring service oriented to periodic assessment of their state and surge projection (Reference Kotlyakov, Osipova and TsvetkovKotlyakov and others, 2003a).
Surging glaciers have been studied in the Institute of Geography, Russian Academy of Sciences (RAS), since the beginning of the 1960s. From 1963 until 1985, ground-based observations were conducted on Medvezhy glacier, Pamirs. They embraced two surges and two stages of restoration (Reference Strozzi, Luckman, Murray, Wegmuller and WernerTsvetkov and Sorotokin, 1981; Reference Desinov, Kotlyakov, Osipova and TsvetkovDolgushin and Osipova, 1982). In 1988–91, Medvezhy glacier observations included aerial topographical monitoring which resulted in tracking of the surge preparation (1988), development and termination (1989) and the start of the next quiescent stage (1990–91) (Reference KnizhnikovKotlyakov and others, 1997).
Investigations on Medvezhy glacier and other surging glaciers made it possible to adduce the main characteristics of the surging-glacier regime in various stages of pulsation and then to work out the basic principles of surging-glacier monitoring.
Basic Principles, Methods and Types Of Surging-Glacier Monitoring
We define targeted dynamically unstable glacier monitoring as a system of regular and long-term remote-sensing and ground-based observations of spatial–temporal changes (fluctuations) in glacier size, shape and dynamic regime, aimed at timely detection of its activation as well as projection of time, scale and consequences of possible glacier catastrophes. This monitoring system includes regional and local levels; each has its own appropriation, methods and means for observation, data processing and analysis (Reference Kotlyakov, Osipova and TsvetkovKotlyakov and others, 2003a, Reference Kotlyakov, Desinov, Osipova, Hauser, Tsvetkov and Schneider2006).
Regional monitoring is designed to reveal and catalogue glaciers with dynamically unstable features. To achieve this, as well as to assess the dynamic state of glaciers and the degree of readiness for a surge, satellite-based surveys have recently been widely used, especially for distant mountain regions with limited accessibility. Such monitoring should be systematic, with the periodicity specified above.
Local monitoring of surging glaciers consists of multiannual recurrent measurements of the surface elevation change (Δh) and ice velocity (V r). Depending on the research tasks and glacier size, both ground-based (geodetic and photogrammetric) and remote-sensing (aerial-topographic and satellite) surveys should be involved. The monitoring of dynamically unstable glaciers on the local level should also include mass-balance measurements, glacio-hydrological observations and, in some cases, a number of other measurements relevant to the specific dynamic regime and morphology of the glacier.
It is important for the local monitoring programme to take account of two different surge stages: the restoration (quiescent) stage and the surge itself. In the restoration stage, complete and reliable information about the surface kinematics, ice velocity, etc., can be obtained by ground-based monitoring with application of photo-geodetic methods. Examples of long-term monitoring include those at Medvezhy glacier and at Variegated Glacier, Alaska, USA (e.g. Reference KääbKamb and others, 1985; Reference Kotlyakov, Desinov, Osipova, Hauser, Tsvetkov and SchneiderKotlyakov and others, 2006).
During the surge stage when the glacier becomes too rough for surface travel, the main study emphasis should be directed towards recurrent remote-sensing methods. An example of the effective use of aerial-photo survey for research of a surging regime is the aerial-topographic monitoring of Medvezhy glacier (Reference Murray, Strozzi, Luckman, Jiskoot and ChristakosOsipova and Tsvetkov, 1991). In recent years it has become possible to use high-resolution space images for the assessment of surging glaciers in both stages (e.g. Reference Osipova and TsvetkovOsipova and Tsvetkov 2002a; Reference Antonova, Desinov, Kotlyakov, Mikhaylov and SuslovStrozzi and others, 2002; Reference Eisen, Harrison and RaymondKääb and others, 2003; Reference Kotlyakov, Osipova and TsvetkovMurray and others, 2003). Some results of space-based monitoring of glacier surges in the Pamirs on regional and local levels are presented below.
Study Region
The Pamirs is high-mountain country, in the northwestern part of the central Asian uplands. We conducted our research within Tajikistan. The western part of this region is a system of ranges (Petra Pervogo, Darvazsky, Vanchsky, Yazgulemsky ranges), with predominantly latitudinal extension cut by deep, narrow valleys. In the central part, these ranges are aligned with the meridional Akademiya Nauk range. The east of the region is occupied by the east Pamir plateau with wide valleys and closed depressions as high as 4000ma.s.l. In the mid-1970s, 6730 glaciers (total area 7493 km2) were identified in the Pamirs (Reference LednikovKatalog Lednikov SSSR, 1968–84).
The major part of the glacierization in the central Pamirs is concentrated in the middle section of the Zaalaysky range, and in the junction of the Akademiya Nauk range with the system of ranges with latitudinal extension. Fedchenko glacier is the largest glacier in Eurasia, 77 km long with an area of almost 650 km2 together with its tributaries. Ten other compound glaciers (Oktyabr’sky glacier, Garmo glacier, RGO glacier and others) cover >50km2 each. The surging Medvezhy glacier is also located here (Fig. 1). This region of the Pamirs is ‘convenient’ for elaboration of satellite monitoring due to the high concentration of glaciers, a great number of dynamically unstable glaciers, especially in the central part, and favourable weather conditions (there are many cloud-free days), important for space imagery.

Fig. 1. Glacierization of the central Pamirs (fragment of ETM+ image, 16 September 2000). Encircled numbers indicate glaciers where the surges took place after 1960 (see Table 1).
Cataloguing Of The Pamirs Surging Glaciers
The initial basis for regional dynamically unstable glacier monitoring is a complete inventory of the glaciers, with indicators of instability, both for the present and in the past. A Pamirs surging-glacier inventory up until 1991 was compiled and published by Russian and Uzbek scientists (Reference Osipova and D.G.Osipova and others, 1998). It was based on historical data and accurate stereoscopic analysis of recurrent space images, KFA-1000 from Resurs-F satellites over the period 1973–91. We used a system of deciphering attributes, both dynamic and static, the major part of which were discovered while studying surging glaciers, particularly Medvezhy glacier (Akademiya Nauk SSSR, 1982).
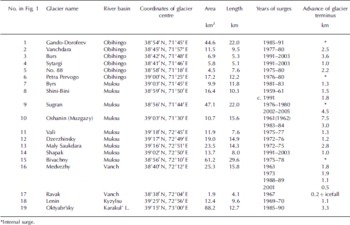
The inventory indicates the location of surging glaciers, dates (year) of their surges, morphological characteristics and their dynamic state on various dates. The 1991 inventory included 630 glaciers with indications of dynamic instability, 51 of them identified as surging, and 215 with signs of current periodic activity (moraine loops, displacement of the activation front, etc.). The remainder of the glaciers indicated past dynamic instability. The group of central Pamir surging glaciers is within a dissected, high mountain range. During the period 1960–90, more than 20 large-scale surges took place in this region. When comparing different space images we rely upon the 1991 inventory for further monitoring of surging glaciers. In particular, comparison of the space images of 1991 with those of the Enhanced Thematic Mapper Plus (ETM+) (Landsat) and the Advanced Spaceborne Thermal Emission and Reflection Radiometer (ASTER) (Terra), obtained in 2000–06, shows changes occurred on (arguably) earlier-surging glaciers, resulting in the discovery of new surges (Table 1; Fig. 1). Up to 2006, the number of glaciers with indicators of surging characteristics increased to 55.
Table 1. The largest identified surges of the Pamir glaciers during 1960–2003
Satellite-Based Monitoring Of Compound Surging Glaciers In The Pamirs
Compound glaciers, consisting of numerous flows and tributaries of various sizes, are characteristic of the glaciation of the Pamirs and of other high-mountain regions of central Asia. The possibility of monitoring these glaciers has arisen only with the advent of long-term recurrent satellite observations. During the past 35 years we have conducted satellite-based monitoring of the evolution of several compound glaciers: Bivachny–MGU and Sugran glaciers (Reference Osipova and TsvetkovOsipova and Tsvetkov, 1999), Octyabr’sky glacier (Reference Osipova and TsvetkovOsipova and Tsvetkov, 2002b), Gando–Dorofeeva glacier (Reference Osipova and TsvetkovOsipova and Tsvetkov, 1999, Reference Osipova and Tsvetkov2001) and RGO glacier (Reference Kotlyakov, Osipova and TsvetkovKotlyakov and others, 2003b).
Data and Methods
The primary research resource for the glacier monitoring has been Soviet space images (scales of photo prints of 30×30 cm are 1 : 200 000 to 1 : 270 000) made by KFA-1000 photo camera in 1972–91 with 5–10m resolution. We used ETM+ and ASTER digital images for the period 2000– 06. The research is based on ice-velocity measurements along longitudinal profiles of surging parts of glaciers, and stereoscopic (except ETM+ images) deciphering (using various space images) of the size and structural changes of the glacier surface. To calculate ice velocity (V r), we measure the displacement of identical contour points on glaciers using stereo pairs compiled from heterogeneous-in-time images. This method, known as the ‘method of pseudo-parallaxes’, was applied for the determination of ice velocity in strict form by Reference LednikovKnizhnikov (1997). Indicative sites of moraine, crevasses and other surface features serve as measurement points, as detailed by Reference Osipova and TsvetkovOsipova and Tsvetkov (1998, Reference Osipova and Tsvetkov1999). Ice-velocity calculation accuracy using space images depends on image resolution and the period between surveys. According to our estimates, the displacement accuracy by this method in the surge recovery stage (KFA-1000) amounts to 10 m. During the surge, when surface structure changes significantly, the measurement errors can reach 50–100 m. This accuracy is acceptable (<10%), taking into account absolute values of the displacements themselves (~1–3 km). For the case of ETM+ and ASTER, the analogous errors are higher. They are in proportion to the image resolution (20–30 m). The main source of errors is the accuracy of identification and observation of identical points on images taken at different times.
For each glacier under consideration, we obtained a series of curves (one curve at each successive survey interval) of V r along the longitudinal profile of the surging section (termini). For Sugran glacier, in addition to annual surveys we managed to obtain eight additional V r curves for the period 8 August 2003 to 14 November 2004, due to frequent Terra/ASTER surveys in 2004. Each velocity curve is constructed of 5–15 points. The advance of some glaciers lasted the entire observation period. Between 8 and 11 curves are available for the analysis of the surge dynamics for each glacier. The analysis also provides some opportunity for data control, based on mutual conformity of the entire number of velocity curves (by excluding possible mistakes in recognition of identical points by the heterogeneous-in-time images).
Another important component of this research is an assessment of the changes in glacier surface morphology over time. Based on stereoscopic revision of heterogeneous-in-time images and aerial-photo images we have deciphered changes in length and width of the glacier, size and pattern of surface moraines, degree of moraine cover and degradation of lower parts of the tongue. We used morphological indicators (change of crevasse character and forms of moraine under the transition from the active part of a tongue to the degrading one), together with velocity curves (transition of V r to zero), to define the position of the foremost activation front (dynamic glacier terminus or ‘surge front’ (Reference Dolgushin and OsipovaEisen and others, 2001)) at the time of each survey. We paid primary attention to the junction sites of the chief trunk and tributaries. We study the interrelations between V r change and moraine shape (which frames a tributary’s junction with the main trunk), and the glacier system evolution at various stages.
Bivachny Glacier
Bivachny glacier, in the past a tributary of Fedchenko glacier, has now lost a dynamic connection with it (Fig. 2). Analysis of velocity curves along a longitudinal profile of the main body of Bivachny glacier (Fig. 3) shows a gradual reinforcement of dynamic activation of the glacier in 1972–75 (curves 1 and 2), a transition to rapid movement in 1975–76 (curve 3) and maximum V r (>1200ma–1) for 1976–78 (curves 4 and 5). After that, V r dropped to 80–100ma–1 (curve 6) over the whole extension of the tongue, and for the subsequent 4 years was close to zero (curve 7), indicating a complete surge termination. In 1985 another activation of the glacier started, evidenced by an increase in V r in its upper section (curve 8). Thus, the transition from the restoration stage to intense surge of the main trunk, and its culmination, termination and start of the next stage of restoration are numerically characterized. In the latter stage, the activation begins in the upper surging section. In the surge stage the maximum velocity is in the middle section of the glacier, where it is necessary to measure V r in the monitoring process. The surge of Bivachny glacier in 1975– 78 concluded 4 km upstream of its junction with Fedchenko glacier, i.e. within its dead tongue, therefore relating to the ‘internal’ category of surging glaciers
Fig. 2. Bivachny glacier (fragment of ETM+ image, 16 September 2000). The longitudinal axis (L), along which the ice-velocity measurements were carried out, is shown by dots. Numbers indicate distance along the longitudinal axis, in km. Traces of clean ‘drops’ of MGU glacier are distinctly visible. They are formed as a result of the surges of the main Bivachny glacier body, which dragged the MGU glacier tongue into the movement.
Fig. 3. The ice velocity V r along the longitudinal axis L (Fig. 2) of Bivachny glacier in 1972–91. The glacier tributary junctions with the main body of Bivachny glacier are shown by arrows. Numbers on the velocity curves indicate time intervals of V r measurements. One can see a gradual movement rate increase at the end of the restoration stage (curves 1–3), a jump in ice velocity in the surge stage (curves 4 and 5), an abrupt drop after the surge (curves 6 and 7), and the onset of the new restoration stage (curve 8).
A significant role in the evolution of Bivachny glacier is played by its large left tributary, MGU glacier. The observations reveal that during the quiescent stage of Bivachny glacier the terminus of MGU glacier advanced to the valley with a velocity of 50–120ma–1. MGU glacier acquired the shape of a paw in the process of slowdown. Gradually, the MGU glacier tongue dammed more than a half of Bivachny glacier, having developed an effective cross-section significantly narrower and damming its upper active part. Upward from the dam, an area of excessive compression strain formed and the main body of Bivachny glacier widened (Fig. 4a). The surge of the main trunk of Bivachny glacier began when stress in the active section overcame the resistance of this dam. Because of rapid ice movement, the glacier ‘paw’ together with the main body shifted along the valley almost 3 km (Fig. 4b). After the surge termination, the Bivachny glacier tongue became inactive, and MGU glacier again started advancing into the main valley, producing prerequisites for the next surge (Fig. 4c). Two to three traces of clean ‘drops’ of the MGU glacier, always distinctly visible in the background of the moraine-covered tongue of Bivachny glacier, point to the periodicity of the above phenomenon. During the second part of the 20th century, three surges of this glacier are determined: in 1958 (Antonova and others, 1977), in 1976–78 (Reference Osipova and TsvetkovOsipova and Tsvetkov, 1999) and soon after 1991 (from comparison of the 1991 images with the ASTER 2003 image).
Fig. 4. The scheme of the flowlines of ice at the Bivachny–MGU glacier confluence before the surge of the main trunk (a), at the culmination (b) and just after the surge (c); see explanations in the text.
Oktyabr’sky Glacier
We defined the position of the activation front of Oktyabr’sky glacier (Fig. 5) in 1972 from morphological features, at distance L = 9 km down the centre line. In 1972–73, ice velocities up to 150 ma–1 were observed along the glacier (Fig. 6, curve 1). The activation front over the year shifted as far as 1.5 km downstream in 1973, and stopped in the area of the tongues of tributary glaciers 1 and 2. In the next several years V r decreased (curves 2–5), and achieved minimal values in 1978–79 (curve 6). Thus, a micro-surge (or the first stage of a surge) of Oktyabr’sky glacier had been completed. After 1979 a gradual increase in V r (curves 7 and 8) started, and by 1985 V r again reached the values of 1972–73 (curve 9) along the whole glacier length. During these years, the activation front shifted downward at a rate of 50–100ma–1, and in 1985 again appeared in the area of the tributaries. Until this time, the tributary tongues moved forward so much towards the valley of the main trunk as to shorten it two-fold. Because of ice continuing to flow in from the upper part of the glacier onto the main trunk above the dam formed by these tributaries, an area with significant longitudinal compression has formed.
Fig. 5. Fragments of photo-images of Oktyabr’sky glacier received by KFA-1000: (a) in 1983 (before the surge) and (b) in 1990 (after the surge). The longitudinal axis (L) is shown in (a) by dots, in km. In the 1983 image (a), one can see that glacier tributaries in the lower part (1 and 2) penetrated into the valley of the main glacier trunk and narrowed its effective cross-section. Above their influx the active part of the tongue expanded. The lower part of it melted. According to the 1990 image (b), the advanced body cut the tongue of glacier 1, and elongated that of glacier 2 over the valley.
Fig. 6. V r along the longitudinal axis L of Oktyabr’sky glacier at the end of the restoration stage (1972–85). For the location of L, see Figure 5. The number 1 (bottom left) indicates the situation of a dynamic end in different years; otherwise symbols are as described for Figure 3. The high activity of the glacier in 1972–73 (curve 1) was followed by a gradual decrease to minimal values of V r in 1978–79 (curves 2 and 6). An increase in ice movement rate occurred until 1985 (curves 7 and 9), when V r again reached the values of 1972–73. A decrease in V r was accompanied by a dynamic terminus retreat as far as 600 m by 1970, and a subsequent 100ma–1 advance. An abrupt drop in velocity to 1979 within L = 6–10 km (curve 9) was conditioned by a dam, produced by the termini of tributary glaciers 1 and 2.
Between 1985 and 1988 the second stage of the surge started. Already for 1985–88 the mean ice velocity V r amounts to 200–250ma–1 along almost the whole glacier extent (Fig. 7), indicating block ice sliding, a characteristic indicator of a surge. For those 3 years the dynamic tongue (the front of the surge), overcoming the tributary glaciers 1 and 2 dam, shifted forward as far as 1 km downstream. The mean value of V r for the 1988–90 period is estimated as 1600ma–1, but at the maximum of the surge it was much more. Up to 21 August 1990 the glacier terminus shifted forward 2 km, and to the moment of the surge termination (September 1990) its total advance reached 3.3 km.
Fig. 7. The Oktyabr’sky glacier motion in the restoration stage (1972–85) and its surge (1985–90): 1. fluctuation of V r variation in the restoration stage; 2. V r for 1985–88 at the start of the surge; 3. displacement of contour points for 1988–90 at the culmination of the surge. 4. the dynamic terminus position in different years. For the position of the longitudinal axis see Figure 5a.
Based on our analysis and aerial images (1946–66), we could follow the evolution of Oktyabr’sky glacier for practically the entire 55 year surge period. Gradual activation and two surge stages were established: a micro-surge which terminated in 1973 within the glacier tongue, and a large-scale surge with advance of the tongue as much as 3.3 km. The study showed the dynamic regime of Oktyabr’sky glacier is mainly determined by the impact of the tributary dam on the main body of the glacier.
Sugran Glacier
Sugran glacier is located in the source of Saukdara river, a tributary of Muksu river. With the help of stereophotogrammetric processing of successive space images, we fixed two of its surges, which differ significantly in character and scale. Sugran glacier represents a complicated system, consisting of three large sources and two tributaries (Fig. 8a). In 1966 (Reference LednikovKatalog Lednikov SSSR, 1968), the glacier terminus was located at 3280ma.s.l., i.e. 1.3 km higher than the influx of Shini-Bini river. On all space images, we could see a distinct contour of young moraine deposits, the remains of the previous surge when its terminus was located at L = 19 km, 1.5 km upstream from the Byrs glacier valley.
Fig. 8. Internal surge of Sugran glacier in the late 1970s (fragments of KFA-1000 space images). The borders of active glacier parts are shown with solid curves, those of the degrading part of Sugran glacier with dashed curves, and the plots of former dead ice and moraines with dotted curve. The longitudinal axis (L) is shown in (a) by dots, marked in km. The 1973 image (a) shows the termination of the restoration stage: the glacier A tongue has already come up to the valley of Sugran glacier, creating an obstacle to the main flow, which expanded and swelled behind it. The 1977 images (b) and 1985 images (c) show the start and termination of the 1976–80 surge. The ice of the main glacier body overcame the resistance of glacier A, moved it downward as far as 2 km, and stretched the tongue of glacier B. The surge terminated within the former contour of the glacier (internal surge).
In 1972–76, ice velocity in the upper part of the main glacier body slowly increased; a well-pronounced activation front was located in the glacier A tongue area, which advanced into the main valley, approximately to its midpoint (Fig. 8a; Fig. 9, curve 1). There is a zone of compression formed above this tributary influx up to 1976. Later, in 1976–80, ice velocity increased sharply, and the character of its distribution along the longitudinal profile changed (Fig. 9, curves 2 and 3). During the surge, in 1976–80 the tongues of the tributaries stretched down the valley (Fig. 8b), displaced as far as 2.2 km (glacier A) and 0.8 km (glacier B) (Fig. 8c). The curves of V r for 1980–85 (Fig. 9, curve 4) and 1985–91 (curve 5) show the surge completion; it terminated in the limits of the glacier tongue, covered with moraine (L = 9–13 km). At this stage, an essential redistribution of ice and its supply into the lower part of the tongue occurred and the tongue expanded considerably (Fig. 8c).
Fig. 9. The annual movement rate V r along the longitudinal axis L of Sugran glacier in 1972–91 (location of L is shown in Fig. 8a). The legend signs are similar to those for Figure 6. The sharp growth of V r (the surge) in 1976–80 (curves 2 and 3) and decrease up to several ma–1 over the subsequent 10 years (curves 4 and 5) are visible. The increase of V r values in the source of the surging part (curve 3) indicates the longitudinal extension, accompanied by lowering and cracking of the glacier surface. The sharp drop of V r within 7–13km is a sign of intense longitudinal compression together with the surface elevation. Below L = 13 km, no motion was detected.
In the 2000 image (Fig. 10a), one can see (by analogy with the previous surge) that the next glacier surge has already started, apparently 2–3 years earlier, in 1997–98. This new surge was monitored until its termination in 2005, and seems to differ significantly from the previous surge. In the first stage it developed as in 1972–80. In 2000/01 and 2001/02, maximum V r was related to the middle part of the Sugran glacier tongue; downslope V r sharply dropped to zero within intensively moraine-covered ice on the glacier terminus (Fig. 11, curves 1 and 2). Thus, the dynamic terminus of the glacier was located approximately at the same place as the previous surge termination (L = 12.8 km). On this basis, we might suggest that the surge terminating in 2002 was similar to the previous surge. Until August 2003, the character of the annual V r distribution along the longitudinal axis sharply changed (Fig. 11, curve 3). The entire moraine-covered tongue activated, the ice velocity increased to 400–500ma–1 in its lower 2–3 km and the dynamic terminus moved forward up to L = 13.7 km (see Fig. 10b). Stereoscopic observation shows that the surface of the lower part of the tongue was elevated, fresh crevasses appeared, and the next surge development became obvious. Its culmination was in 2003–04 (curve 4). V r increased and, correspondingly, longitudinal strain was fixed within 5–15 km for that year. At the same time, the dynamic terminus abutted the rest of the tongue, and moraine deposits, preserved there since the Shini-Bini glacier surge in the early 1990s (L = 14 km), now remained here until June 2004 (Fig. 10c).
Fig. 10. Surge of Sugran glacier in 2000–05 with the advance of its terminus (fragments of ETM+ 2000 (a) and ASTER 2003 (b), 2004 (c) and 2006 (d) images). The legend signs are similar to those for Figure 8. The images for 2000 and 2003 fix a culmination of the first, internal stage. The tongue of glacier A has already stretched due to rapid motion of the main trunk down the valley, but the activation front still has not reached the morphological end of the glacier (the site of Shini-Bini confluence) in 2003. The 2004 image (c) demonstrates termination of the second stage of the surge: the tongues of tributary glaciers A and B are elongated over the valley. The Sugran glacier dynamic terminus, moving as far as 1.8 km (since 2000), abutted on the Shini-Bini glacier deposits, left after its surge in the early 1990s. The 2006 image (d) shows the state of Sugran glacier 1 year after completion of the third stage, an intense advance of its terminus. From November 2004 to June 2005 the terminus moved forward 2.1 km, stopping only 4 km short of the Byrs glacier valley.
Fig. 11. Annual movement rate V r along the longitudinal axis (L) of Sugran glacier in 2000–04 (location of L is shown in Fig. 10a). The legend is similar to that of Figure 6. The graph indicates that before autumn 2002 (curves 1 and 2), activation of the glacier followed the scenario of the previous surge (1976–80). Within the section L = 5–7 km, ice velocity was maximal and reached the same value as last time: 700–1000ma–1. In 2003–04, ice movement within L = 7–13 km acquired a ‘block’ character. The whole covered moraine tongue became active and the speed maximum migrated into the section 11–13 km. The shape of curves 3 and 4 apparently indicates the start of a surge.
Analysis of daily V r in 2003/04 (seven successive ASTER surveys) shows that the ice velocity remained steadily high in the tongue (Fig. 12). Even in the autumn–winter period, V r values were 2.5–3md–1 (900–1100ma–1) at L = 11 km (curve 1). Maximal fixed V r relates to spring/summertime (curve 3) and reaches 3md–1 (1800ma–1) at L = 11 km. Similar regularity was found on Medvezhy glacier in 1977– 79 (Reference Strozzi, Luckman, Murray, Wegmuller and WernerTsvetkov and Sorotokin, 1981), most probably due to meltwater penetrating the glacier during intensive ablation. Values of V r slightly decreased, especially in the upper part of the tongue in autumn (curves 4–7).
Fig. 12. Daily values of the Sugran glacier V r along the longitudinal axis L in 2003–04 (location of L is shown in Fig. 10a). The legend is similar to that of Figure 3. The graph shows that maximum V r is always located in the section L = 10–13 km. Thus it was already possible to anticipate an imminent surge in summer 2004. Even in winter 2003/04 the ice movement rate increased to the glacier terminus, reaching 2.5 md–1 (913ma–1). In spring, an abrupt growth of V r took place (curves 2 and 3), and the activation front reached L = 14 km. After this it slowed down, but increased again in early winter (curve 7).
Because of the high rate of ice movement and halt of the dynamic terminus above the dam of Shini-Bini glacier, the Sugran glacier surface kept rising, and as a result a zone of enhanced compression strain formed. By November 2004 the dynamic terminus of Sugran glacier, after overcoming the Shini-Bini glacier remnants, advanced 0.6 km (to L = 14.6 km). In early fall 2005 we received photographs from tourists, of the Sugran glacier tongue pictured on 30 August 2005 (Fig. 13). By then the surge was over. The only available ASTER image, dated 16 October 2005, shows that the Sugran glacier tongue advanced from November 2004 by 2.1 km (to L = 16.7 km), still short by 3.5 km of the Byrs glacier tongue. We cannot say exactly when the surge culmination took place, but according to the image ETM+ SLC-off (Visualization Viewer, resolution 240 m) we had already identified the surge termination. The surges of several large Pamir glaciers occur in spring. We suggest therefore that the major advance of Sugran glacier may have occurred in May–June 2005. In total, the glacier advanced 4 km between August 2002 and August 2005.
Fig. 13. The termination of the Sugran glacier surge in 2005. Photograph by D.V. Popov, 30 August 2005.
The analysis of ASTER images of 12 June 2006 and 3 November 2006 (Fig. 10d) shows that almost the whole extent of the surging part of Sugran glacier became dead. No ice movement was detected between L = 7 and 16.7 km (taking into account the image resolution). Thus the Sugran glacier surge took place between 1998 (?) and 2005, in three stages divided by halts and retardations. The first finished in 2001/02, when dead ice of the previous surge stopped the terminus movement. The end of the second stage is linked with the delay of the dynamic terminus by dead ice and moraine remains of the moving tongue of Shini-Bini glacier. During the third stage, the glacier terminus advanced along the valley almost free of ice and moraine.
Such surges (with two or more stages) have been observed on other glaciers (e.g. Oktyabr’sky glacier (see above), Variegated Glacier in 1982–83 (Reference KääbKamb and others, 1985) and two phases of the Bering Glacier (Alaska) surge, separated by a period of 6 years (Reference Osipova, Tsvetkov, Shchetinnikov and RudakPost, 1972)). Our observations show that the halts in glacier advance are conditioned by damming of the tributaries (Oktyabr’sky glacier) or dead ice massifs (Sugran glacier). Among the two Sugran glacier surges studied, the first terminated within its dead ice. Because of this surge, ice mass was transferred into the lower part of the tongue, its surface elevation probably affecting the scale of the subsequent surge. A similar ‘inadequate’ surge was observed on Medvezhy glacier in 2001 (Reference Antonova, Desinov, Kotlyakov, Mikhaylov and SuslovDesinov and others, 2001). The surge in 1995 on Variegated Glacier also completed within the tongue (Reference Dolgushin and OsipovaEisen and others, 2001).
The morphological features of the glacier itself and its valley (see Fig. 8) largely determine the dynamics of Sugran glacier. Large ice masses from three firn basins below the equilibrium-line altitude merge and fit into the narrow valley (700–900 m). Downstream 4 km from the confluence of these three ice masses into the main trunk a tributary, glacier A, joins it, narrowing the valley and blocking movement. Glacier B, a lower left tributary, also affects the movement of the main glacier body. The advance rate of the front is further influenced by three abrupt turnings of the valley at L = 2, 6 and 8 km. Further, the ice surface is covered with moraine, reducing the ablation in this area of the glacier and obstructing the movement of the ice mass located upstream.
Conclusions
We have attempted here to highlight the essential role of damming in the dynamic regime of compound glaciers, using Sugran glacier, in particular, as an example. From our study of two surges of Sugran glacier and experience of other surging glaciers we conclude that indicators such as ‘critical mass’ and the time between surges do not always enable us to forecast reliably the next activation and catastrophic advance of a dynamically unstable glacier influenced by a changing climate. The only reliable tools for such projection are targeted remote sensing together with ground-based monitoring of the evolution of glacier surges. To obtain initial information about the state and development of a glacier surge, it is sensible to use recurrent space surveys of the study area. The longer the observation period, the more reliable is the result. We can obtain comprehensive information about glacier dynamic regimes from analysis of series of ice-velocity curves and stereo images of glacier surface change in the surging section of the glacier. The ice-movement rate, shape of the ice-velocity curve and character of their change serve as reliable indicators of the surge evolution. An increase in ice-movement rate in the lower section of a glacier, where a zone of longitudinal compression exists, directly indicates a surge is imminent.
The quality of glacier surge monitoring may be improved by means of recurrent aerial-topographic and ground-based photo-geodetic surveys, facilitating observation of surface elevation change. We are sure that space surveys, allowing identification of surface change within metre accuracy, will be open to users in the near future. Space monitoring of surging glaciers is unable to solve the surge cause/mechanism issues. For this, we require more detailed observations of many parameters, including inner and external mass-exchange, hydrological, climatic and other characteristics. However, for operational information about imminent glaciological events with possible catastrophic consequences, satellite-based remote sensing is useful, especially of distant glacierized regions.
Acknowledgements
We thank the US Geological Survey and the organizers of the Global Land Ice Measurements from Space (GLIMS) project for providing ASTER space images. Support was provided by project HIII-9757.2006.5.


