

Introduction
Remotely acquired microwave data in conjunction with essential ground observations will most likely lead to advanced extraction of snow properties beyond conventional techniques. Landsat visible and near-infrared data have recently become near operational for use in measurements of snow covered areas (Reference RangoRango 1975, Reference Rango1978). Operational NOAA satellites provide continuous global coverage with 4 km spatial resolution. Both Landsat and NOAA data acquisition are hampered by cloud cover, sometimes at critical times when a snowpack is ripe and ready to melt. Furthermore, information on water equivalent, free water content and other snowpack properties germane to accurate snow melt run-off prediction is not currently available using visible and near-infrared data because only surface and near surface snow contribute to the measured reflectances.
Microwave remote sensors which have the capability to penetrate the snowpack and respond to variations in snow properties, could provide information about snow depth and snow water equivalent (Reference Rango, Chang and FosterRango and others 1979; Reference Chang, Foster, Hall, Rango and HartlineChang and others 1982). However, due to the coarse spatial resolution of the present microwave radiometers, combinations of vegetation, terrain and snow information within a pixel greatly complicate the retrieval algorithm development.
Algorithms need to be developed that are specific to physiographic areas like the Colorado River basin and the north slope of Alaska. These algorithms will take into account additional parameters related to microwave signatures. Until these algorithms are operational, the use of remotely collected microwave data for global quantitative snowpack analysis will not be operational due to the complexities involved in the data analysis.
Microwave Emission from Snow
Microwave emission from a layer of snow over ground consists of two parts: (1) emission by the snow volume and (2) emission by the underlying ground. Snow particles act as scattering centers for microwave radiation from a snowpack. The scattering effect which redistributes the upwelling radiation according to snow thickness and crystal size, provides the physical basis for microwave detection of snow. Mie scattering theory is used to account for the energy redistribution by snow crystals. Although the snow crystal usually is not spherical in shape, its ensemble scattering properties can be mimicked by spheres (Reference Chang, Gloersen, Schmugge, Wilheit and ZwallyChang and others 1976). Theoretical computations indicate that scattering by individual snow crystals can be the dominant modification factor of upwelling 37 GHz (0.8 cm) radiation in the dry snow cases (Reference Chang, Foster, Hall, Rango and HartlineChang and others 1982). The effect of scattering is lessened by using the longer wavelengths. Fig.1 shows the calculated brightness temperatures versus snow water equivalent for SMMR frequencies. The effective microwave penetration depth into a dry snowpack, typically 10–100 times the wavelength, depends on the wavelength used and the characteristic crystal size of the snowpack. When the wavelength is much larger than the crystal size (> 5 cm), absorption will be the dominant effect. The brightness temperature will resemble the physical temperature of the snowpack. When the wavelength is comparable to the snow crystal size (< 1 cm), scattering becomes the dominant effect.

Fig. 1. Calculated brightness temperatures versus snow water equivalent for five SMMR frequencies with horizontal polarization and 50° incidence angle.
Nimbus-7 SMMR is a five - frequency, dual-polarized microwave radiometer which measures the upwelling microwave radiation at 6.6, 10.7, 18.0, 21.0, and 37.0 GHz (4.6, 2.8, 1.7, 1.4 and 0.8 cm) while scanning 25°to either side of the spacecraft (approximately 780 km swath width) with a constant incidence angle of approximately 50° with respect to the Earth’s surface. The spatial resolution varies from 25 km for the 37 GHz (0.8 cm) to 150 km for the 6.6 GHz (4.6 cm). A detailed description of this instrument can be found in Reference Gloersen and BarathGloersen and Barath (1977). The Nimbus-7 satellite was launched on October 24, 1978, into a sun-synchronous polar orbit with local noon/midnight equatorial crossing.
Using the multifrequency analysis approach, one may make inferences regarding not only the thickness of the snowpack, but the underlying soil (wet versus dry) condition. The shorter wavelengths, such as 0,8 cm (37 GHz), sense near surface (0–50 cm) temperature and emissivity, and surface roughness. At the intermediate wavelengths (1.4 and 1.7 cm), the radiance is less affected by the surface and more information is obtained on the internal characteristics of the snowpack. All of the above generalizations apply to snow conditions encountered by various satellite observations for different regions of the world.
The presence of liquid water content in a snowpack completely changes the observed microwave signatures (Reference Chang and ShiueChang and Shiue 1980; Reference Mätzler, Schanda, Hofer and GoodMätzler and others 1980; Reference Stiles and UlabyStiles and Ulaby 1980). A few per cent of liquid water in snow will cause a sharp increase in the brightness temperature (Reference Chang, Gloersen and RangoChang and Gloersen 1975), This is because the emission of a small amount of liquid water within the snowpack alters the emitting radiance of dry snow.
The condition of the ground beneath the snow determines the intensity of the radiation emitted from below. Dry or frozen ground has a high emissivity (0.9 - 0.95) whereas unfrozen wet ground has a much lower emissivity (0.7). Knowledge of the condition of ground is important for the interpretation of observed brightness temperature of a shallow snowpack, The difference of vertical and horizontal polarized brightness temperature at 2.8 cm wavelength could reflect the frozen and thawed soil condition under a shallow snowpack.
Snow-Parameter Retrieval Algorithm
Reference Kunzi, Patil and RottKunzi and others (1982) reported an algorithm to retrieve snow cover parameters using the Nimbus-7 SMMR data. The brightness temperature gradients of 37 and 18 GHz were used to discriminate snow parameters. The snow water equivalent relationship was derived from the regressing brightness gradient and the measured snow water equivalent. Based on the SMMR data for the 1978–1979 winter season, encouraging results were obtained. Reference Chang, Foster, Hall, Rango and HartlineChang and others (1982) reported snow parameter retrieval results based on a theoretically derived algorithm and the results compared favorably with snow data taken from Eurasia and the Canadian high plains. These relationships will be used for the snow parameter retrieval algorithm used in this study. The snow depth-brightness temperature relationship for a uniform snow field can be expressed as follows (Reference ChangChang 1986):
where T118H and T37H are the brightness temperature at 18 and 37 GHz horizontal polarization. This equation was derived from linearly fitting the data shown in Fig.1 assuming a snow density of 0.3 Mg/m3 and its application should be limited to snow depths less than 1 meter. Since the snow within a SMMR footprint (25 km × 25 km) can be quite variable, pixels with derived snow depth less than 2.5 cm will be assigned as no snow. The snow covered area is defined where derived snow depth is thicker than 2.5 cm.
Intercomparison of SMMR—Derived Snow Maps and Others
Snow cover maps are routinely produced by the National Environmental Satellite Data and Information Service of the National Oceanic and Atmospheric Administration (NOAA/NESDIS) and by the U.S. Air Force Global Weather Center (USAFGWC). NESDIS monitors continental snow cover extent using NOAA satellites on a weekly basis (Reference Dewey and HeimDewey and Heim 1981). Skilled analysts hand prepare the snow cover chart based on imagery information. The Air Force charts rely on snow depth reported by weather stations. A complex computer program is then used to extrapolate the point measurements to area snow coverage. Reference Kukla and RobinsonKukla and Robinson (1981) reviewed the accuracy of these two products. Table I shows the variation and differences between them for the Northern Hemisphere snow covered area for the year of 1979. The snow covered area derived by NESDIS varied from 49.3 million km2 in the 1978 winter season to 4.2 million kms in the summer of 1979. The differences between NESDIS and Air Force products are substantial in the fast-changing fall season. For example, in the 45th week of 1979, a difference of 12.5 million km2 was observed between these two products. The major differences are in Europe and Asia (Fig.2). Persistent cloud cover probably was probably the reason for the differences, A six-year snow cover/snow depth data set has been produced using Nimbus-7 SMMR data. It covers the period of November 1978 to October 1984. Snow parameters were derived based on Equation (1) using calibrated SMMR brightness temperatures. Fig.3 shows a sample SMMR snow map (February 1983). In order to compare the different snow maps, both NESDIS and USAFGWC maps were projected onto a one degree by one degree SMMR map grid. Generally the major snowfield features matched well with those of NESDIS snow cover maps except in very shallow snow covered areas. Due to this limitation, total snow covered area derived from SMMR is usually about 10% less than the other two products. Fig.4 shows a typical comparison of the Northern Hemisphere snow covered areas derived from these three methods for each month of 1981.
Table I Northern Hemisphere Snow-Covered Area Comparison for 1979 (Units: Millions Km2)


Fig. 2. Differences in NESDIS and USAFGWC snow cover map (November 1979).
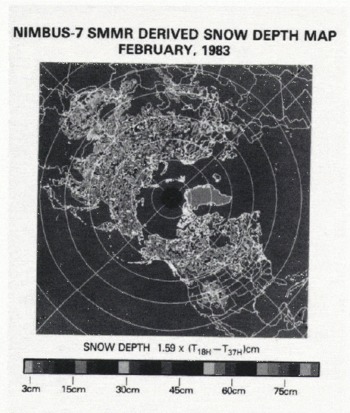
Fig. 3. SMMR-derived snow map (February 1983). (Also reproduced in colour in appendix, at end of volume.)

Fig. 4. Comparisons of weekly snow covered area derived by NESDIS, USAFGWC and SMMR for 1981.
In order to make a preliminary evaluation of the accuracy of these products, the continental United States was chosen as the test area. The snow depths reported by weather stations were used as the reference point measurements. A subjective analysis similar to those used in the meteorological data analysis was performed to draw the snow covered area. Then the NESDIS and SMMR snow boundary lines were overlaid on the same chart. The snow cover maps for mid-January and mid-February of 1983 were chosen for comparison (Figs 5 and 6). In the western US, all three products gave very similar results for both January and February. Due to deeper snow conditions, mountainous terrain did not seem to affect the snow boundary determination. The January snow cover in the eastern US was very sparse and shallow. Only a small area in New England showed in the SMMR snow map. This is probably because the heavier vegetation cover and denser urban development in the eastern US masked out the microwave signatures. The threshold for snow/no-snow discrimination needs adjustment for this area. But in February the SMMR map matched better in the eastern US, because there was more snow on the ground. The southernmost snow boundary is nearly always slightly different in each map and the presence of shallow and patchy snow probably is the reason. No effort was made to compare the derived snow depth and those reported by weather stations.

Fig. 5. Comparisons of National Weather Stations reported snow depth with NESDIS and SMMR snow covered area, mid-January 1983.

Fig. 6. Comparisons of National Weather Stations snow depth with NESDIS and SMMR snow covered area, mid-February 1983.
Canadian High Plains and Russian Steppes
Reference Rango, Chang and FosterRango and others (1979) reported good correlations for brightness temperature and snow depth over the Canadian high plains using Nimbus-5 and Nimbus-6 Electrically Scanned Microwave Radiometer (ESMR) data. Reference Chang, Foster, Hall, Rango and HartlineChang and others (1982) reported similar results for the Russian steppes and the Canadian high plains. The vegetation, topography, climate and latitude in these two areas are comparable. The vegetation is predominantly a variety of grasses and the topography is generally flat. Both areas experience very cold winters with snow covering the ground from December through March. Air temperatures for the study areas, before and after satellite passes, were below 0°C with little chance of significant melting; dry snow conditions were assumed. Regression from both test sites is significant at the 0.005 level with R2 values of 0.75 for Russian and 0.81 for Canadian sites using only the 37 GHz vertically polarized brightness temperatures (Fig.7). Due to lack of snow water equivalent data for large area comparisons, snow depth information was utilized. A snow density of 0.3 Mg/m3 was assumed to relate the snow depth to snow water equivalent. The data displayed considerable scatter, which is probably due to inhomogeneity within each footprint. The theoretically calculated brightness curve for a mean snow grain radius of 0.35 mm fits well with the observed conditions. Snow depth and snow water equivalent for these areas could be inferred from microwave brightness temperatures measured by the SMMR spaceborne sensors.

Fig. 7. SMMR brightness temperature versus snow water equivalent for (a) Russian steppes 15 February 1979 and (b) Canadian High Plains, 12 February 1983.
Colorado River Basin Study
In 1983 the snowfall for the Colorado River basin was well above average. Serious flooding in the western US was predicted for the spring melting season. A cooperative project between the US Geological Survey and the National Aeronautics and Space Administration was set up to explore the potential of using passive microwave data for determining snowpack properties in this mountainous region. In order to analyze the relationship between microwave brightness temperature and snow parameters, a common geographical grid was established to register all the available information, which includes elevation, slope, vegetation type, vegetation cover amount, snow course data, climatology data and SNOTEL data. The mesoscale footprint of the SMMR, an ellipsoid of approximately 40 km × 50 km for the 18 GHz (1.7 cm) radiometer, complicates the determination of snow water equivalent from microwave radiances in the mountainous regions. The R2 between TB and snow depth for a 1/4° × 1/4° grid usually is only about 0.5 because of the difficulty in making the comparison between a point surface measurement and a mesoscale measurement from space. Analysis is now being concentrated on combining geographical information and microwave information to develop a better snow parameter retrieval algorithm for use in the mountainous regions.
Alaska Study Area
In northern Alaska the difference between the soil temperature and the air temperature can be as large as 40°C. This steep temperature gradient in the snowpack promotes metamorphism and the formation of depth hoar crystals. The crystal size of depth hoar is usually larger than that of new snow crystals. Lower brightness temperatures were observed by the Nimbus-7 SMMR in this area, typically with a snowpack of 30—50 cm in depth, and can be explained by radiation interacting with a depth hoar layer (Reference Hall, Chang and FosterHall and others 1986). In order to develop a retrieval algorithm for this area, information on the history of the thickness of the depth hoar layer and the characteristic grain size is needed. Based on this information and a snow energy and mass balance model, physical properties of the snowpack can be estimated.
Discussion
Six year Nimbus-7 SMMR derived Northern Hemisphere snow parameter maps have been produced using a simple algorithm. The snow boundary lines derived by NESDIS, USAFGWC and SMMR were compared. Normally, the SMMR derived snow boundary maps showed less snow than those of the NESDIS and the USAFGWC snow maps. This is because microwaves can penetrate through a shallow snowpack without registering a noticeable scattering effect. However, when the microwave signatures indicate snow, the entire field of view is probably snow covered. Over the mountainous area, terrain effects tend to modify the microwave signatures. The sensitivity of microwave radiation with respect to snow depth will be reduced, but the snow boundary can still be delineated. For heavily vegetated areas, the sensitivity of microwaves for detecting snow will also be reduced. The vegetation effect can be predetermined and classified by using visible and infrared imagery data. The depth hoar layer within a snowpack will greatly alter the microwave signatures. By taking into account all these factors, different algorithms will be developed to account for different snow conditions.
To evaluate the quality of retrieved snow water equivalent from passive microwave data, several areas were chosen for comparison. The best results were found in the Canadian high plains and the Russian steppe areas. The R2 for these uniform and homogeneous areas are typically between 0.75 and 0.8. The results from mountainous areas, forested areas and snowpacks with depth hoar layers are not as good. The R2 for these areas usually is only about 0.5 or less. Different algorithms are required to retrieve the snow parameters in these regions. Further tests are required before regional algorithms can be used in combination for global operational purposes.


