

1. Introduction
A few centuries ago, snow avalanches were depicted as ever growing snowballs rolling down mountainsides. One aspect of this naïve concept of avalanching has been vindicated by recent observations and measurements (Issler and others, unpublished; Reference Sovilla, Sommavilla and TomaselliSovilla and others, 2001): the entrainment of snow has now been recognized as a major factor in the dynamics of avalanches. It must be concluded that perhaps the majority of medium to large avalanches double or even triple their mass from release to runout; in the track, the moving mass may be more than five times the original mass (Reference Sovilla, Sommavilla and TomaselliSovilla and others, 2001). From measurements with profiling radars (Dufour and others, unpublished), erosion rates of >200 kgm–2 s–1 have been inferred (Reference IsslerIssler, 2003) during the very rapid removal of up to 1 m of fresh snow at the avalanche front, while they were found to be in the range 10– 50 kgm–2 s–1 during episodes of more gradual entrainment in the head of dry snow avalanches.
It has long been recognized that entrainment has two aspects: One concerns the breaking up of the snow cover into particles (ranging in size from snow grains to large blocks); this process is the main focus of this paper and will be termed erosion. The erosion speed, we, is the velocity (measured in the direction perpendicular to the ground) at which the surface of the intact snow cover is lowered due to erosion. The other aspect is the entrainment of the eroded snow into the flow through acceleration and possibly mixing. The entrainment rate, qe = ρsηewe (kgm–2 s–1), is the snow mass per unit time and unit area that is incorporated into the avalanche, where ηe is the fraction of the eroded snow that is eventually entrained. Entrainment distributes the avalanche momentum over a growing mass; the velocity diminishes unless there is suficient net momentum gain from the gravitational and resistance forces, mfG and mfR (m is the avalanching mass). To see this, the momentum equation for an avalanche entraining mass from a resting snowpack is ![]() or, rewritten as equation of motion,
or, rewritten as equation of motion, ![]() The effect on the avalanche of the entrained mass is that of a pseudo-force which causes a deceleration
The effect on the avalanche of the entrained mass is that of a pseudo-force which causes a deceleration

Typical values for medium-size dry-snow avalanches on a 30° slope are fG = g sin 30° ≈ 5ms–2, uav ≈ 30 ms–1, flow depth hav ≈ 1m, and ratio of avalanche density to snow-cover density ρav/ρs ≈1–2. For ηewe of 0.05–0.10ms–1, fE ≈ (0.15–0.6)fG is a substantial factor in the dynamics of the avalanche. In traditional avalanche models, these entrainment effects are subsumed in the velocity-dependent resistive forces and may contribute significantly to the wide scatter of back-calculated friction coefficients through the strong dependence of erosion and entrainment on topography, snow and avalanche properties.
This paper focuses on erosion mechanisms, but one should keep in mind that the entrainment rates that can be realized in snow avalanches are often limited, not by the work needed for eroding the snow, but by the large fraction of the available shear stress that is absorbed in the acceleration of the eroded snow.
The majority of dynamical (dense-flow) avalanche models that include snow entrainment do not model a specific entrainment process but add mass to the front of the avalanche at a rate specified by the user (Reference BriukhanovBriukhanov and others, 1967; Reference Brugnot and PochatBrugnot and Pochat, 1981; Reference HungrHungr, 1995; Reference Sailer, Rammer and SamplSailer and others, 2002; Reference Sovilla and BarteltSovilla and Bartelt, 2002). A heuristic velocity-dependent entrainment function is used by Reference Maeno and NishimuraMaeno and Nishimura (1987). Eglit (Reference Eglit1983, Reference Eglit1998) assumes the entrainment rate to be proportional to the velocity, in analogy to the entrainment of ambient fluid in buoyant plumes or jets. Reference Grigoryan and OstroumovGrigoryan and Ostroumov (1977) describe the erosion and entrainment process in terms of a compressive shock front propagating through the snow cover underneath the avalanche body, inclined at an angle α = arctan(we/uav) to the ground. The hydrostatic and dynamic pressures of the avalanche at the interface to the snow cover determine the compression of the eroded snow and the angle α, and thus the entrainment rate. For powder-snow avalanches, an entrainment function derived from flume experiments (Reference Parker, Garcia, Fukushima and YuParker and others, 1987) has been used by Reference Fukushima and ParkerFukushima and Parker (1990) and in adapted form by Reference GauerGauer (1995) to dynamically determine the mass increase of the flow.
The objective of this paper is to infer which erosion mechanisms are most likely to occur in real avalanches and therefore should be studied in more detail, both experimentally and theoretically. We build on concepts sketched in Reference Issler, Gauer and BarboliniIssler and others (2000) and draw on work on wear and fatigue in solid mechanics and on river-bed erosion in hydraulics (see section 2). In section 5, we compare our order-of-magnitude estimates of the erosion speeds of the proposed mechanisms with the data from several measured avalanches.
2. Erosion Processes in Other Phenomena, and Specific Features of Erosion in Snow Avalanches
Reference RabinowiczRabinowicz (1995) distinguishes four main types of wear, namely adhesive wear, abrasive wear, corrosive wear and surface fatigue wear, and a few special mechanisms. Among them, abrasive wear and possibly surface fatigue wear should be most relevant to erosion in avalanches. Impact erosion is generally believed to be the dominant mechanism in blowing and drifting snow, and has also been conjectured (Reference IsslerIssler, 1998) to dominate in the saltation layer of powder-snow avalanches.
Abrasive wear occurs when hard asperities or particles slide over a softer surface, digging into it and plowing grooves.The snow particles in an avalanche undergo significant compression, by which their strength increases greatly; they are thus capable of indenting the usually much softer snow cover. Mears (Reference Mears1980, fig. 7) provides photographic evidence of abrasive processes at the base of the dense core of avalanches. Surface fatigue wear can be observed during repeated or continuous sliding over a surface. The sliding induces surface or subsurface cracks which eventually result in the break-up of the surface. This mechanism is often observed during springtime, when small avalanches break loose and start to erode the whole snowpack. The photograph mentioned above also shows a crack from the sliding surface deep into the snowpack. Impact erosion occurs when particles impinge on the snow-cover surface and, while moving along the surface, abrade material or initiate cracking of the surface. In section 3, we present models for the abrasion and impact erosion in avalanches.
Three main erosion mechanisms are discussed in the fluvial hydraulics literature (see, e.g., Reference PartheniadesPartheniades, 1965; Reference MehtaMehta, 1991; Reference Zreik, Krishnappan, Germaine, Madsen and LaddZreik and others, 1998): Gradual erosion of single particles from the surface occurs already at shear stresses an order of magnitude smaller than the mechanical shear strength of the bed. (In non-cohesive granular beds, surface erosion is also observed to set in at shear stresses about one order of magnitude lower than the mechanical shear strength.) Under stresses comparable to the shear strength, entire chunks of material are ripped off the bed following failure along a deeply embedded plane (mass erosion).
Finally, waves cause cyclic loading/unloading and shear stress; this may lead to fluidization of the surface layer and subsequent entrainment and mixing (Reference MehtaMehta, 1991).
The mechanisms observed in fluvial systems need not be directly relevant to (dense) snow avalanches because of the low density of air and the overwhelming effect of particle interactions with the snow cover. Nevertheless, there is presently an indication that mass erosion may also occur in snow avalanches (see section 5), and fluidization of the snowpack immediately in front of the avalanche (due to excess pore pressure generated during snow compression) or inside a dilute head (as a consequence of under-pressure at the snow-cover surface) is considered in section 4.
In all erosion processes, an important factor is the strength of the eroded material. The snow strength generally grows substantially with depth as the density increases (except for weak layers) and will usually exceed the avalanche stress at some point. It is indeed often observed that erosion proceeds only to the interface between the fresh snow and the old snowpack (Issler and others, unpublished; Reference Sovilla, Sommavilla and TomaselliSovilla and others, 2001). The strength of snow shows a varying strain-rate dependency. Reference Abele and GowAbele and Gow (1975) performed strength tests under rapid uniaxial loading in which the strain rates were close to those expected in the case of an avalanche. The stress–strain curves indicate an initial phase of plastic behavior, when the major principal stress exceeds the yield strength, Y. During the plastic collapse, the stress stays approximately constant until the strain reaches the critical plastic strain, εm, beyond which rapid strain hardening occurs. Based on these tests, the following relations between the yield strength under compression, Y (in kPa), and the snow-cover density, ρs (in kgm–3), and between εm and ρs, are derived to characterize the snow-cover properties:
Some inferences can immediately be drawn from these properties: (i) the exponential dependence of snow strength on snow density leads to a strong variability of erosion speeds; (ii) the yield strength Y can be used in first estimates of erosion rates, but will lead to overestimates; and (iii) strain hardening will limit the densification to values similar in large, fast avalanches to those found in smaller ones, despite significantly higher stresses.
3. Erosion by Direct Particle–Particle Interaction
Measurements with profiling radar (see Fig. 1) show relatively long episodes with gradual erosion at moderate rates, indicating the importance of snow erosion due to particles impinging on the snow surface within the saltation layer of avalanches. Each impact partly leads to a densification of the snowpack, partly to loosening of snow and its entrainment by the ambient flow. The impacting particle itself may rebound from the surface or penetrate it and get stuck. The particle sizes range from approximately 0.25 mm to a few decimeters.

Fig. 1. Radar distance of the snow surface from ground υs time (thick line), and the corresponding erosion speed (thin line). The association to the different flow regimes is based on the radar echo intensity. Vallée de la Sionne (Switzerland) test site, radar A2, event of 25 February 1999 (derived from radar plot in Dufour and others (unpublished)).
At the base of the dense avalanche core, the particles are in continuous contact and slide over one another. Hard particles will plow grooves in the snowpack under their own weight and the overburden load. The snow cover is partly compacted and partly loosened and entrained by the avalanche. This process is commonly known as abrasion. In the following, we present a simple model for impact erosion and its adaptation to the abrasion mechanism.
3.1. Erosion due to particle impact
According to Johnson (Reference Johnson2001, ch. 11), the impact of snow particles on the snowpack during an avalanche can cause the whole range from elastic–plastic over fully plastic to extensive plastic displacement (flow) and the onset of hydrodynamic behavior. For a first estimate of potential impact erosion speeds, we assume fully plastic impacts. We treat the avalanche particle as a rigid sphere with radius r (= dp/2), density ρp and mass mp = ρpVp and the snow-pack as a porous, rigid and perfectly plastic material with compressive yield strength Y. During impact the latter decelerates the particle and deflects it upwards (provided the particle is not completely submerged in the snow cover). If the impact angle α (measured from the x axis and thus negative) is suficiently small, the particle will not be stopped completely but will leave the snow cover again.
The equations of motion for the impinging particle read (neglecting aerodynamic drag):


where η is the slope angle, PL = pdAe is the force due to the plastic flow pressure acting in the line of penetrating motion and μPL is the contribution of the Coulomb friction tangential to the motion. Ae is the projection of the instantaneous contact area onto the plane defined by ![]() and the y axis (see Fig. 2).
and the y axis (see Fig. 2).
Fig. 2. Rigid snow particle impacting onto the plastic snow-pack. Adapted from Reference Rickerby and MacmillanRickerby and Macmillan (1980).
The plastic flow pressure is approximated as pd ≈ cpY. For solids, cp ≈ 3 in the fully plastic stage. cp is close to unity in porous media in the fully plastic stage and for small indentations. With increasing indentation, cp increases to about 3, reflecting strain hardening. Thus, snow as a porous medium might have a cp similar to that of foams, for which Reference Wilesa, Johnson and AshbyWilesa and others (1975) give

for the case of an indenting sphere. The critical strain εm is given in Equation (3). Further hardening of the snowpack due to dynamic flow effects is disregarded. The total volume Ve of the impact crater is

where A(t) is the penetrating cross-sectional area perpendicular to the line of motion, Up(t) is the instantaneous velocity of the particle, and ti is the duration of the impact. For a full description of the geometric relations we refer to Reference Rickerby and MacmillanRickerby andMacmillan (1980). To calculate the total crater volume, Equations (4) and (5) are solved numerically. The impact angle αi, needed as an initial condition, depends on the ratio between terminal velocity of the particle, Wf, and avalanche velocity and might also be influenced by the turbulence. The number of particle impacts per unit time and unit area, Ni, can be approximated by

here c/2 is the volume concentration of particles in downward motion. The erosion speed due to particle impacts can now be written as
Each particle impact causes a momentum transfer mp(Up1║ - Up0║) from the avalanche to the snowpack even without entrainment, where Up0║ and Up1║ are the mean particle velocities parallel to the surface before and after the impact, respectively. Some of this momentum is returned to the flow by the fraction ηei of ejected particles (with mean initial velocity Upe║) that are eventually entrained by the avalanche. The difference of the two contributions is the so-called grain-borne shear stress:
Figures Fig. 3 and Fig. 4 plot the calculated impact erosion speeds and grain-borne shear stresses due to particle impact vs the snow density. The essentially exponential dependence on the snow density is a result of Equation (2). Another controlling factor is the impact angle. The erosion speed grows with increasing impact angle and thus with particle size because larger particles have a higher fall velocity Wf and thus tend to impact under a steeper angle. The dependence on the impact angle also influences the relationship between avalanche speed and erosion speed because the impact angle decreases with increasing avalanche speed. If the impact angle is artificially kept constant in the simulations, wie / un av, with n > 2, but if it is made to vary according to αi = -arctan(Wf cos ϕ/uav), one finds 1 < n < 2 (for dp = 25 mm, n ≈ 1.5). Note that the growth of the erosion speed with increasing impact angle is sharply limited by the maximum angle (depending on the impact velocity) beyond which the particle is absorbed in the snowpack.
Fig. 3. Impact erosion speed υs snow density, with the avalanche velocity as parameter; ρav =10 kg m–3; dp=0.25mm; ϕ = 0°.
Fig. 4. Shear stress due to momentum loss of impacting particles υs snow density, with the avalanche velocity as parameter; ρav =10 kg m–3; dp=0.25mm; ϕ = 0°; Upe =0.
3.2. Abrasion
The methods developed for impact erosion may also be applied to estimate the abrasion speed. Consider a snow particle indenting the snowpack and sliding parallel to the surface (α = 0). The particle equations of motion (4) and (5) are supplemented with an overburden load L and the traction exerted by the avalanche:


L is determined by the effective pressure transferred through the particle lattice within the avalanche. We assume that each snow block at the interface carries the load L = ρavghav/Nb, with Nb the number of blocks per unit footprint area. For simplicity, the traction is expressed as a drag: ![]() , with Up the velocity of the sliding particle. The drag coefficient, CD, depends on the flow regime.
, with Up the velocity of the sliding particle. The drag coefficient, CD, depends on the flow regime.
In the present case of surface-parallel sliding, the lefthand side of Equation (12) vanishes, and the plastic-flow pressure times the z component of Ae balances the load due to the particle and its overburden. At the same time the plastic-flow pressure times the x component of Ae acts as the retarding force in Equation (11). Summing the retarding forces over all Nb blocks gives the frictional stress, τf, acting at the bottom of the avalanche. As long as the slope-parallel component of gravity and the drag force acting on the blocks together equal or exceed the retarding force, the blocks plow through the snow cover and erode it. If the retarding force exceeds the driving forces, the blocks decelerate and the drag force grows accordingly; however, if the maximum drag force is insuficient to overcome the retarding force on the block, deposition begins. The total shear stress at the interface between the plowing blocks and the overriding layer of the avalanche also includes the drag forces on the eroded snow that accelerate it to the avalanche velocity during mixing.
The material eroded by one block per unit time is proportional to the penetrating cross-sectional area, A, perpendicular to the flow direction and the mean velocity of the block, ![]() Hence, the erosion speed due to abrasion is
Hence, the erosion speed due to abrasion is
Figures Fig. 5 and Fig. 6 show the simulated abrasion rates and frictional stresses, τf, as functions of the snow-cover density. The parameters used are given in Table 1. The avalanche speed, uav, is not treated as a dynamical variable here but as an externally prescribed constant. The determining factors for the abrasion speed are the snow density (via the exponential dependence of strength on density) and the effective overburden of the particles at the base. There is only a weak particle-size dependence. The shear stress between the plowing particles and the snow cover diminishes with increasing snow strength because the grooves strongly diminish in depth and the slope-parallel component of the resistance force at the interface becomes rather small while the slope-perpendicular component remains constant.
Fig. 5. Abrasion speed vs density of the snowpack for the parameter sets listed in Table 1. Avalanche velocity is treated as an externally prescribed constant; erosion rates in real avalanches would be significantly lower.
Fig. 6. Shear (frictional) stress due to abrasion vs snow density for the parameter sets listed in Table 1. The inset shows the corresponding friction coefficient μ (ratio of shear stress vs normal stress).
Table 1. Compilation of parameters used in the simulation of abrasion

4. Erosion Mechanisms at the Avalanche Front
In avalanches, aerodynamic entrainment of the snow cover might play a role just in front of the avalanche where ambient air is rapidly displaced by the approaching avalanche. This phase may last about 1–2 s in a developed powder-snow avalanche. Estimates using the widely used excess shear-stress approach for the erosion speed (see, e.g., Reference Anderson and HaffAnderson and Haff, 1991) show that the erosion speeds are in the range 0–0.003ms–1 under the most favorable assumptions, and are thus negligible.
4.1. Fluidization of the snowpack by pore-air displacement
Excess pore-water pressure can fluidize river beds and thus significantly affect the erosion process (Reference Simon and CollisonSimon and Collison, 2001). An air-pressure gradient can also arise at the front of snow avalanches where (i) the rapid flow of the dilute snow-air mixture causes a pressure drop above the snow cover, or (ii) the snow cover is rapidly compacted by the avalanche and pore air tries to escape through the undisturbed snow cover.
The first-mentioned situation is expected to occur during the passage of a dilute avalanche front, in which the pressure drop is ![]() ρaf and uaf are the density and avalanche speed at the front. This pressure drop has been measured in experiments with ping-pong balls (McEl-waine and Nishimura, 2001). Due to this drop, a pressure difference between the interior of the snowpack and the surface builds up during a short but finite time, tf, of front passage, persists for a while and vanishes gradually. A given volume of snow becomes fluidized when the force due to the flow of escaping air exactly balances the net force due to gravity and strength. Taking for simplicity a hexahedral control volume with length l (~ uavtf) and width ω, and assuming tensile strength Yt and shear strength Ys, fluidization should occur to a depth
ρaf and uaf are the density and avalanche speed at the front. This pressure drop has been measured in experiments with ping-pong balls (McEl-waine and Nishimura, 2001). Due to this drop, a pressure difference between the interior of the snowpack and the surface builds up during a short but finite time, tf, of front passage, persists for a while and vanishes gradually. A given volume of snow becomes fluidized when the force due to the flow of escaping air exactly balances the net force due to gravity and strength. Taking for simplicity a hexahedral control volume with length l (~ uavtf) and width ω, and assuming tensile strength Yt and shear strength Ys, fluidization should occur to a depth

This is an implicit equation for de, showing that simultaneous fluidization of as large an area as the pressure gradient permits is most advantageous. The effectiveness in fluidizing the top of the snow cover moreover depends crucially on the ratio of the build-up time, tf, to the pressure relaxation time, tr (≈ νd/(kRT), where k is the intrinsic permeability of the snowpack, the kinematic viscosity of air, R the specific gas constant of air and T the temperature). The erosion speed wef is on the order of de/tf. At present, it is unclear whether fluidization due to pressure drop can occur at the front of the saltation layer, as no firm data from snow avalanches are available. Estimates of the pressure drop required for fluidizing snow covers with density 75– 200 kgm–3 yield velocities in the range 20–75ms–1 if a (powder-snow) avalanche density of 5 kgm–3 is assumed. However, even if complete fluidization is not reached, this mechanism will contribute to the weakening and destruction of the snowpack and is a candidate mechanism for the blast-like erosion seen in Figure 1.
The second mechanism involves rapid (adiabatic) compression of the snow cover by the weight of the avalanche flowing over it or plowing into it. Snow compaction from a density ρs0 to ρs1 leads to a pore-air pressure rise

where p0 is atmospheric pressure and ρi the density of ice. Some of the pore air is pressed at high speed through the snow cover ahead of the avalanche front in a narrow zone, the length of which is comparable to the erosion depth at the front, i.e. a few meters or probably less. The pressure gradient is non-uniform and depends strongly on the geometry of the avalanche head; it should be greatest where the avalanche front intersects the snow cover. Depending on the snow strength and the pressure difference Δp, there is a limiting depth de below which the pressure gradient is too weak to fluidize the snow cover.
To illustrate the mechanism, we approximate the streamlines ahead of the (slope-perpendicular) avalanche front by concentric quarter-circles about the intersection of the avalanche front and the snow cover (point M in Fig. 7). From the balance of the moments of the gravity, pressure and shear forces, the erosion depth is estimated as
Fig. 7. Schematic representation of airflow through the snow-pack ahead of the moving avalanche.

The mean erosion speed according to Equation (16) is equal to uav. However, this estimate implies that the penetration depth of the avalanche front adapts to potential erosion depth. For a more comprehensive approach see the discussion in section 6 and the following subsection.
4.2. Plowing
It has been observed that the front of dense-flow avalanches plows through the snowpack and entrains large quantities of snow thereby, even at moderate velocities. Such plowing implies that the snowpack undergoes strong, rapid shearing and compaction just ahead of the avalanche. We expect the length of this area to be about 1–3m. Part of the snow cover is compacted and overflowed by the avalanche (which may ultimately abrade it). The upper part of the plowed snow-cover layer is pushed onto the avalanche front where it may pile up or be advected to the avalanche body, possibly being comminuted and suspended.
In order to describe the compaction and erosion process, consider a prismatic control volume bounded by three surfaces (see Fig. 8). Surface b forms the shear surface, surface c is the boundary towards the avalanche, and surface a forms the boundary to the airflow above. Across each of these surfaces, the jump conditions for mass and momentum must be fulfilled:
Fig. 8. Schematic representation of the head region of a dense-flow avalanche plowing through the snowpack. The triangle represents the control volume for which the jump conditions have to be solved de indicates the erosion depth and dc the part of the snowpack that will be compacted by the avalanche.
where r indicates the surfaces a, b and c, respectively. Cr is the velocity of the (non-material) surfaces, and tr . nr is the normal stress onto the respective surface. The erosion depth de is strongly influenced by the normal stresses at the shear plane b. Here, the determining quantities are the compressibility of the snowpack and the overburden load from the avalanche head. Across the interface a, excess pore-air pressure generated by the compaction may play a role in supporting the development of the saltation layer on the upper surface of the dense core. Along the surface c, dispersive pressure may come into play. Further study of this problem is needed in order to obtain approximate solutions that can be compared to measurements.
Two entrainment models have been published that contain elements of the analysis suggested above: Grigorian and Ostroumov (1977) consider only one jump surface underneath the dense core; the entire entrainment is into the dense flow. The model by Reference Sailer, Rammer and SamplSailer and others (2002) distinguishes between entrainment into the dense flow and into the suspension layer, but the jump conditions for the momentum are not evaluated and hence neither the erosion depth nor the ratio between entrainment at the bottom and at the top can be determined dynamically in their model.
5. Comparison with Experiments and Field Observations
Figure 1shows the time evolution of the snow-cover and flow depths as well as the erosion speed for the giant avalanche of 25 February 1999 at the Vallée de la Sionne test site in Switzerland. The plot is derived from data from a profiling radar located in the upper track (Dufour and others, unpublished). The association of different areas in the avalanche with different flow regimes is based on the radar echo intensity; the suspension layer is invisible to the frequency-modulated continuous wave radar. The preliminary analysis of simultaneous Doppler radar measurements indicates velocities on the order of 50 ms–1 at that point. The snow density was in the range 170–300 kgm–3. Approximately 0.7 m of snow are eroded virtually instantaneously at the leading front of the saltation layer, corresponding to an erosion speed of about 2.5 ms–1. In the following 5 s, erosion is more gradual, with erosion speeds decreasing from 0.25 ms–1 to near zero. During this time, an approximately 0.5 m thick layer of higher echo intensity can be seen, indicating a higher density and/or larger block size than in the upper reaches of the saltation layer. The second peak at 18– 19 s in the erosion speed curve is tentatively interpreted as a snow block ripped out of a stronger layer. After that, the average erosion speed is about 0.05 ms–1 and no denser bottom layer is found until the dense core arrives. During the first second of its passage, the erosion speed jumps back to about 0.15 ms–1, but no further erosion is observed afterwards. Snow deposition takes place during the last 10 s of the passage of the dense part. Over the entire avalanche passage (lasting about 45 s), the mean erosion speed is 0.05 ms–1.
This recording suggests that both a very rapid plowing or fluidization mechanism at the front and gradual, impact-driven erosion in a relatively dilute avalanche head (tentatively identified as the saltation layer, with an estimated density around 100 kgm–3) may occur in large dry-snow avalanches. Additional radar recordings from the same site lend support to this conclusion (Dufour and others, unpublished), although the ratio of the masses entrained by the different mechanisms varies considerably. A much more detailed analysis combining data from different sensors and comprising all avalanches measured at the test site is needed in order to correlate these differences with the dynamics of the avalanches.
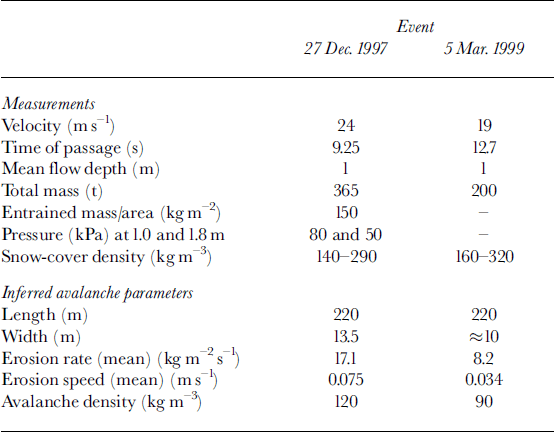
For a number of small avalanches, Reference Sovilla, Sommavilla and TomaselliSovilla and others (2001) carried out a systematic study of the mass balance at the avalanche test site Monte Pizzac at Arabba in the Dolomites, Italy. Additional information on these avalanches is contained in Reference Sommavilla and SovillaSommavilla and Sovilla (1998) and Reference Sovilla and BarteltSovilla and Bartelt (2002). Perhaps the best described of these events is that of 21 December 1997. The most reliable data for the estimation of the erosion speed are given at pole 1 (position A) at 2024 ma.s.l. For the event of 5 March 1999, the width of the track swept by the avalanche had to be estimated. Both events are classified as dry dense-flow avalanches. Table 2 summarizes the measurements for these two events at pole 1 and gives the calculated mean erosion speed and the inferred avalanche density. The avalanche density of the 21 December 1997 event, inferred from the volume and mass estimates, compares quite well with the reported pressures if pimpact ≈ ρav u2 av is assumed for the 10 cm diameter load cells used at Monte Pizzac. The pressure sensor at 1m above ground was just above the snow surface and thus should reflect the pressure in the flowing part of the avalanche.
Table 2. Compilation of measurements at pole 1 in the Monte Pizzac path (after Reference Sommavilla and SovillaSommavilla and Sovilla, 1998; Reference Sovilla, Sommavilla and TomaselliSovilla and others, 2001; Reference Sovilla and BarteltSovilla and Bartelt, 2002), and calculated erosion speeds and avalanche densities at the same point
Field observations on a small to medium avalanche in Seewis, Grisons, Switzerland (Issler and others, unpublished), where the powder-snow part separated from the dense flow at a sharp turn of the gully, allow the erosion speed within the saltation layer to be estimated, provided several reasonable but not directly verifiable assumptions are made. The new-snow layer had a depth of 0.7–1m and a density of approximately 120 kgm–3. Tracers (mostly fir needles and twigs) in two snow pits excavated at different locations showed that the new-snow layer was completely eroded at one location and reduced to 10–20 cm at the other; it remains an open question whether old snow was eroded at the location of the first snow pit.
In the first pit location, the deposit depth measured 30– 50 cm and the largest particles had diameters up to 40 cm; in the second, the deposit depth measured 5–10 cm and the largest snow particles were the size of an egg. Depending on the assumed deposit density (measurements are not available), mass deposition from the tail of the powder-snow avalanchewas comparable to the erosion in the head at snow pit 1, but clearly less at pit 2 despite the less violent erosion there. This can be explained by the location of the snow pits: pit 2 is close to the side of the path, but in fairly steep terrain, so the velocities were generally lower than in the center of the track, but even the dilute tail is expected not to decelerate. Pit 1, in contrast, is in the center of the powder-snow avalanche path, but further downstream in less steep terrain shortly after the cloud had to climb about 20 m along the steep side-wall of the gully turn.
From numerical simulations, the front velocity and the length of the powder-snow avalanche are estimated as 35 ms–1 and 300 m, respectively. If we further assume that erosion occurred only in the front half and deposition only in the tail half, the mean erosion speed was around 0.2 ms–1 at pit 1 and 0.1 ms–1 at pit 2. Similar erosion speeds are inferred in the run-up area of the large 10 February 1999 avalanche at Vallée de la Sionne where almost the entire snowpack of 2m depth was eroded near the shelter (Dufour and others, 1999) and the deposit depth varied from 0.2 to 2 m over distances of 10–20m.
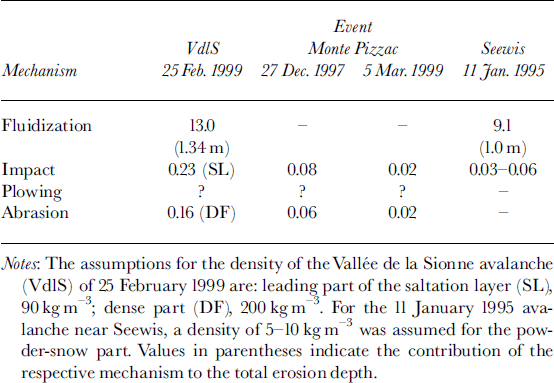
Table 3 summarizes the predicted contributions to the erosion speeds from fluidization, impact erosion and abrasion in the four avalanches discussed in section 5. We have not developed a dynamical model for the plowing mechanism yet, so no predictions can be made; it is very likely, however, that the powder-snow part of the Seewis avalanche did not erode by plowing. Considering the uncertainty and incompleteness of the measurements, the agreement between the measured (or inferred) entrainment speeds and the model predictions is encouraging. For the two events at Monte Pizzac, simulated abrasion and impact erosion speeds are similar; it is quite conceivable that the front of those avalanches was more dilute than the main body and that impact erosion dominated in the front, abrasion in the body. For the 25 February 1999 event at Vallée de la Sionne, the maximum impact erosion speed is approximately 1.3 m s–1 for reasonable assumptions. This is about half the erosion speed inferred from the radar measurement; thus the observed erosion during the front passage cannot be explained by impact erosion alone. The field observations from Seewis also indicate that either our estimates are too low, or an additional mechanism is operating; fluidization is an obvious candidate, but more work is needed to make testable predictions.
Table 3. Simulated erosion speeds in m s–1 for the four events described in the text
6. Discussion and Conclusions
In this exploratory study, five potential mechanisms for erosion in snow avalanches have been identified. Surface fatigue wear may occasionally occur as localized mobilization of a deeper layer in the snowpack, but may be neglected at present. Impact erosion and abrasion have many common aspects, but the conditions for their occurrence are quite different, especially with regard to the avalanche density. Neither mechanism has been observed directly, but grooves and impact holes have been seen in several cases. Under the mechanical conditions in the saltation layer (relatively low density, large blocks, high velocities), impact erosion appears quite unavoidable. It is conceivable that the saltation layer often erodes the snow cover down to a hard layer of old snow on which the snow blocks in the bottom layer of the dense core are quickly comminuted and abrasion becomes negligible.
The plowing and fluidization mechanisms may be more intimately connected than our crude and incomplete treatment in section 4 suggests; perhaps they should be regarded as two aspects of a single phenomenon. After all, plowing represents the most efficient mechanism for generating a strong pressure gradient in the snow cover immediately in front of the avalanche. Both processes are subjected to feedback mechanisms that require further study and need to be formulated mathematically.
We wish to emphasize two points: First, abrasion, impact erosion, plowing and fluidization all have the potential to contribute strongly to entrainment under certain conditions, and they do so in different locations of the avalanche. Thus they all need to be studied further and eventually incorporated into a comprehensive entrainment/deposition model for avalanche simulation codes. Second, when soft fresh snow is abundant, i.e. under the conditions that favor large, catastrophic mixed avalanches, acceleration of the eroded snow and mixing with the avalanche is the limiting factor. The resistance of the snow cover against erosion becomes important if the snow cover is old and/or relatively warm and humid.
Further progress in the modeling of erosion and entrainment requires not only dedicated theoretical studies of the candidate mechanisms, but also a series of experiments that shed light on the unresolved questions. Some of the experiments are best carried out in the laboratory (or on an outdoor chute); others require a well-equipped full-size test site. In the authors’opinion, the most promising approaches are:
High-resolution close-up videos ofavalanches in (natural) chutes, taken from the side, will help distinguish between different erosion mechanisms.
Pore pressure measurements. Such measurements have been carried out at the bottom of debris flows (Reference IversonIverson, 1997) and should also be feasible in snow avalanches, preferably at several levels on an instrument support structure.
Particle-impact experiments with snowballs of various sizes and hardness, different velocities, and impact angles onto a snow surface of known properties.
Direct measurements of the erosion rate. In real avalanches, the erosion rate is usually limited by the large force needed to accelerate the eroded snow. It might be possible to design laboratory experiments in which the “avalanche” body is pulled across the snow cover at constant speed, irrespective of the entrainment rate and the force needed.
Tracer experiments to determine the degree of mixing of eroded snow into the avalanche. In chutes or small avalanche tracks, various kinds of tracers could be deployed in different locations along the track and at various depths in the snow cover before the avalanche release.
Measurement of velocity profiles and density.
More than one erosion mechanism has to be included in a satisfactory avalanche model: the measurements available so far indicate clearly that entrainment takes place both at the front and along the bottom of the avalanche body. The flow regime determines which mechanism is dominant; plowing and abrasion require a dense, solid-like avalanche body, perhaps a plug flow, whereas impact erosion seems to be limited to more dilute flows (probably identifiable with the saltation layer). We anticipate a delicate interplay between erosion by fluidization and the avalanche density: the pressure gradient necessary for fluidization is produced only if the avalanching snow is sufficiently hard, dense and impermeable, but the fluidization process itself tends to dilute the avalanche front.
The erosion models presented here were not designed for direct use in any numerical code. Once the mechanisms are better understood, they have to be formulated in terms of the dynamical variables and parameters of the respective model. In view of the flow-regime dependence discussed above, advanced avalanche models explicitly recognizing different flow regimes (e.g. multi-layer models or models with dispersive pressure regulating the local density) are to be preferred over simple two-parameter models as platforms for realistic entrainment modules.
Acknowledgements
This work was funded through the Norwegian Geotechnical Institute’s (NGI) SIP programs “Avalanche research” and “Offshore Geohazards” and through the European Union project SATSIE (Avalanche Studies and Model Validation in Europe), contract No. EVG1-CT2002-00059. We have received valuable information through enjoyable discussions with E. Adams, M. Barbolini, R. E. Brown, M. E. Eglit, H. Gubler, M. Schaer, J. Schweizer and B. Sovilla. We also wish to thank our colleagues of the avalanche group at NGI for their interest and discussions.


