


1. Glaciers in China
Western China is characterized by numerous mountain ranges and high, broad plateaus; 14 mountain ranges run in parallel from north to south, including the Altai, Tien Shan, Pamirs, Karakoram, Kunlun and Himalaya, with the latter four ranges surrounding the Tibetan Plateau (henceforth TP). These four mountain ranges and plateau are the highest in the world (e.g. the average elevation of the TP is 4500m a.s.l.). The cold environment resulting from these high elevations provides excellent conditions for alpine glaciers to develop. It is estimated the total glacierized area in China and other mountainous parts of central Asia is 114 800 km2 (Reference Dyurgerov, Meier and ArmstrongDyurgerov and others, 2002). In the mountain ranges of central Asia, 46 377 glaciers are situated within China; they have a total area of 59425 km2 (Fig. 1) (Reference Shi, Liu, Wang, Liu and YeShi and others, 2005), according to the Chinese Glacier Inventory (CGI), based on aerial photographs taken from the late 1950s to the early 1980s and large-scale topographic maps.

Fig. 1. Geographical setting and glacier distribution in western China. (Map produced by Mi Desheng.)
Our analysis based on observed physical properties (e.g. ice temperature, surface velocity, general climatic characteristics) indicates that these glaciers can be categorized into three types, extremely continental, subcontinental and monsoonal maritime (Reference Shi and LiuShi and Liu, 2000), each with its own distinct physical properties (e.g. ice temperature, precipitation, air temperature). Continental glaciers are mainly located in the central and western Kunlun Shan, the Qiangtang plateau, the east Pamirs, the west Tanggula mountains and the west Qilian Shan. Subcontinental glaciers are distributed over the Tien Shan, the northern slopes of the central and western Himalaya and the north slope of the Karakoram mountains. Small glaciers (area <1.0 km2) comprise 77% of glaciers in western China, but only 20% of the total glacierized area. Large glaciers (area >10 km2) are relatively scarce, but account for 37.6% of the glacierized area; 33 of these are >100 km2 in area and constitute 10.4% and 26.3% of the total area and total ice volume, respectively, of glaciers in China (Reference Shi, Liu, Wang, Liu and YeShi and others, 2005).
Glaciers are an economically important fresh-water resource in China and other parts of central Asia (Reference Yang and ZengYang and Zeng, 2001), where many large river systems have their sources in glacierized regions (e.g. Huanghe, Changjiang, Yarlung Zangbo (Brahmaputra), Tarim, Mekong, Nujiang (Salween) and the Ganges). Therefore, glacier changes are likely to have a major impact on human activities and the preservation of the environment, especially in those river systems that depend on meltwater from glaciers to provide an adequate supply of water. Until recently, there has not been general agreement about glacier changes in the region, and in particular the impact on water resources of recent glacier retreat taking place under present-day warming. In this paper, we present an integrated assessment of glacier changes in China during the past several decades.
2. Climate Change During Recent Decades
Global climate change is well described in Reference Folland and HoughtonFolland and others (2001). The Intergovernmental Panel on Climate Change report showed that global climate warming since the end of the 19th century has increased the Earth’s temperature by 0.6±0.2˚C, and the warming is more pronounced on land surface areas at mid- and high latitudes in the Northern Hemisphere. Such rapid warming was largely attributed to enhanced anthropogenic emission due to fossil energy consumption. It was shown that the air-temperature increase during the 20th century is likely to have been the largest in any century during the past 1000years, and the 1990s are likely to have been the warmest decade of the millennium (Reference Folland and HoughtonFolland and others, 2001). An intensification of the global hydrological cycle was also observed; measurements of land surface precipitation showed an increase of 0. 5 - 1% per decade throughout the mid- and high latitudes of the Northern Hemisphere. Over much of the subtropical land areas, rainfall decreased during the 20th century (by - 0. 3% per decade) (Reference Folland and HoughtonFolland and others, 2001).
The general warming during the last century is observed in western China, but with some peculiarities. An analysis of climate in the region determined that air temperature during the last 120 years has increased by about 1.2˚C, twice the global warming rate, and the most pronounced warming occurred during the last two decades (Reference Wang and DongWang and Dong, 2002). However, a cooling trend was recorded during the 1980s and 1990s in the north-central TP as shown by an analysis of δ18O in an ice core from the Malan ice cap (Reference Wang, Thompson, Davis, Mosley-Thompson, Yao and PuWang and others, 2003) and by variations in the altitude of the 0˚C isotherm in the atmosphere based on radiosonde measurements (Reference Zhang, Lianmei and QingZhang and others, 2005). Most of western China saw an increase in precipitation during the past 50 years (e.g. an 18% increase during the second half of the 20th century in the northwest provinces (Xinjiang, west Gansu and north Qinghai)) (Reference Wang, Zhu and CaiWang and others, 2004). However, seasonal snow cover observed at meteorological stations tended to increase on the TP, though no obvious trend has been observed in Xinjiang since the 1950s (Qin and others, in press).
3. A Brief Review of Glacier Change Measurements
Several glaciers in China have been monitored for several decades: Urumqi glacier No. 1 (UG1) at the source of the Ürumqi river on the northern slope of the Tien Shan; Qiyi glacier in the central part of the Qilian Shan; Hailuogou glacier on the eastern slope of the Gongga Shan, at the eastern margin of the TP; Xiaodongkemadi glacier in the Tanggula mountains; and Meikuang glacier in the eastern Kunlun Shan. In the following, we give a brief summary of these results.
Ürumqi glacier No. 1 has two branches. It is a cirque-valley glacier and was 2.20 km long and had an area of 1.73 km2 in 2000 (Reference Jiao, Jing and HanJiao and others, 2004). The glacier has been monitored since 1959; it was determined that it has had a continuous retreat of its terminus and separated into two glaciers in 1993. It shrank by 0.22 km2 from 1962 to 2001, and the terminus of the lowest part of the east branch had retreated 171 m by 2000 (Fig. 2). The retreat of the glacier is closely related to a general mass loss of 10 597 mm from 1959 to 2002. Mass wastage has been accelerating, with a total mass loss of 4437 mm since 1995/96.
Qiyi glacier is a cirque-valley glacier with an area of 2.98 km2 and a length of 3.8 km. The mass-balance series was reconstructed based on observations during two periods, 1974−77 and 1983−88, and the meteorological data at a station about 50 km north of the glacier. Statistical equations have been established to relate mass-balance components (e.g. equilibrium-line altitude (ELA), ablation, accumulation rates) to meteorological parameters at this station. The estimated glacier mass balance was positive between 1956 and 1988, with a cumulative sum of 1637 mm (Fig. 3a) (Reference Liu, Xie, Yang and WeiLiu and others, 1992). In general, the mass-exchange level on the glacier was low, but during 1976 there was a transition from positive to negative anomalies in mass balance and location of the ELA. The decreasing mass-balance trend was also more obvious after 1976 than before. Photogrammetry in 1956 and in situ observations during 1975 and 1997 indicate that the terminus of this glacier retreated at a rate of 2 ma−1 from 1956 to 1975, and at a rate of 1 ma−1 from 1975 to 1997 (Reference Liu, Xie, Liu, Shi, Huang, Yao and DengLiu and others, 2000). The most recent observation shows that glacier terminus retreat had increased to 2 m again in 2001/02.
Hailuogou glacier is a large valley glacier 13 km long and with an area of 25.7 km2. The mass balance was reconstructed based on mass-balance measurements, hydrological data 1 km from the glacier terminus and meteorological data of a station about 60 km from the glacier (Reference Xie, Su, Shen and FengXie and others, 1998). The glacier mass balance shows that this glacier has been in a mass-loss state, with periodic fluctuations, since 1960 (Fig. 3b), as confirmed by the observed 545 m retreat of the terminus since 1966 (Reference Su, Liu, Wang, Su, Wang and XieSu and others, 1998; Reference Xie, Su, Shen and FengXie and others, 1998). The terminus of the glacier has been in general retreat, though it was relatively stable from 1970 to the late 1980s, subsequently retreating at a rate of 17 m a−1 from 1990 to 1995 and at an accelerated rate of 18.3 m a−1 from 1996 to 1998.
Meikuang and Xiaodongkemadi glaciers have been observed since 1989 and showed a change to an accelerated mass loss after 1993 and 1994. The cumulative mass balance of the two glaciers was –2200 and –1600 mm, respectively, after 1993/94 (Reference Pu, Su, Yao and XiePu and others, 1998). In response to the negative mass balance, the two glaciers began to retreat in 1994 (Xiaodongkemadi glacier retreated by 13 m during the period 1994–2001) (Reference Pu, Yao and WangPu and others, 2004).
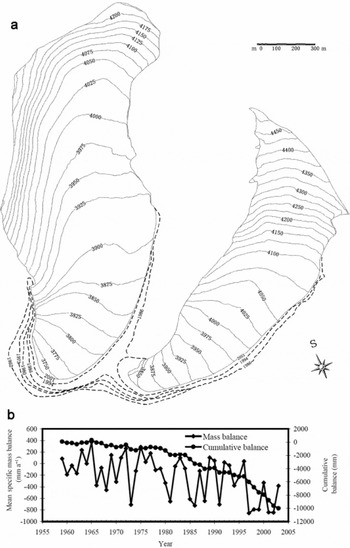
Fig. 2. (a) Repeated photogrammetric mapping of UG1 at different times during the past 40 years (Wang and others, in press). Dashed line with number shows the terminus position in the numbered year, and solid line with number is the altitude isoline. (b) Mass-balance processes (adapted from Reference Li, Han, Jing, Yang and JiaoLi and others, 2003).

Fig. 3. Reconstructed annual specific mass balance for Qiyi glacier (a) and Hailuogou glacier (b).
Different researchers have compiled statistics on the percentage of glaciers in China that have retreated or advanced during different periods of time; statistical data were based on glacier change measurements using topographic maps or, occasionally, in situ observations (Reference LiLi and others, 1986; Zhang and Wang, 1995; Reference Su, Liu, Wang, Su, Wang and XieSu and others, 1998). The analyses show that 55.4% of the glaciers were in retreat during the 1950s–70s, and 48% retreated and 30% were stable during the 1960s and 1970s. Two-thirds of 178 sampled glaciers were in a state of retreat between 1973 and 1981.
4. Regional Pattern of Glacier Changes
With the improvement of satellite remote sensing, remotely sensed digital images have been widely used to extract information about glacier changes in China (S. Reference Liu, Xie, Liu, Kang, Cheng and DongLiu and others, 2002, Reference Liu, Sun, Shen and Li2003, Reference Liu2004, Reference Liu2005; Reference Lu, Yao, Liu, Ding and LiLu and others, 2002; Reference Jin, Tao, Li and WuJin and others, 2004; Reference Shangguan, Liu and DingShangguan and others, 2004a, b). Table 1 shows regions where glacier changes during the last 50 years were documented with remote-sensing techniques and Geographic Information System methodologies. Remote-sensing imagery is geometrically corrected on the basis of rectification to topographic maps. To remove the influence of shadowed areas on images and to reduce interpretation errors, we applied an orthogonal correction to imagery by referencing to a digital elevation model (DEM) with 90 m cell resolution (level 1 , the cell resolution used for 1:250 000 scale DEMs of topography), so that the positional error is reduced to about one pixel. Errors of visual identification of glacier margins on images are estimated at one to two pixels. Therefore, data showing glacier length changes are reliable only when they exceed 90m. With this technique, we have analyzed changes of >5000 glaciers with length changes >90m (complemented, in part, by results from other researchers) during the past several decades in different areas of western China. We have compared the glacier area identified by the visual interpretation with that made by the computer-based classification, in order to assess the accuracy of the digitized glaciers. In general, the visual interpretation has a larger error for glaciers <0.02 km2, with errors of 8–12%, while for large glaciers the errors are reduced to 1% (Reference ShangguanShangguan and others, 2006). In the following, we present a brief discussion of glacier changes in different regions of western China.
Table 1. Data types used for analyzing glacier changes during past decades in selected mountain regions in China

Qilian Shan
A comparison of glacier termini from Landsat Thematic Mapper (TM) images acquired in 2000 and 2001 and aerial photographs taken in 1956, 1966 and 1972 indicated that the 33 glaciers monitored on the northeastern slope of the eastern end of the mountains were all receding, with a mean length reduction of 11.5m a−1. Six glaciers completely disappeared during 1972 and 2001. In the western section of the mountains, 95% of the monitored glaciers retreated at a mean rate of 4.9 m a−1 , but we determined that ten glaciers advanced between 1956 and 2000/01. Our analysis indicated that about 170 glaciers monitored on the northwestern slope of the western section lost 4.8% of their total area during 1956−90, with a much more intensive area reduction (23%) for small glaciers (<1 km2) (Reference Liu, Sun, Shen and LiLiu and others, 2003).
Tien Shan
There are ∼9000 glaciers, with a total area of 9225 km2, in the Chinese Tien Shan. Repeat aerial photogrammetric mapping from two acquisitions of aerial photographs has been carried out for measurement of glacier variations in the Ürumqi river basin (1962 and 1992) and source tributaries of the Yili river basin (1962 and 1989) on the north slope of the Tien Shan. All of the 251 glaciers studied retreated during the periods indicated above, but the overall area reduction differed significantly between the two basins: 13.8% in the Ürümqi river basin, but only 3.1% in the Yili river basin. However, the estimated ice-volume change indicates that the average thickness of glaciers after thinning is similar for the two basins: 5.8 m for the Ürümqi and 6.1 m for the Yili (S. Reference Liu, Xie, Liu, Kang, Cheng and DongLiu and others, 2002). As for glacier changes on the south slope of the Chinese Tien Shan, our analysis based on a comparison of aerial photographs taken in the early 1960s with Landsat TM images in 1999 and 2000 shows that 69.4% of the monitored glaciers have receded and 30.4% have advanced during the past 40 years. Subtracting the area increase from the advance of some monitored glaciers with a total area of 2093.8 km2 in the early 1960s, glaciers in the southern Tien Shan still lost 4.6% of their area.
Eastern Pamirs
The earliest glaciological investigations by Chinese scientists began in 1956, when a joint team of mountaineering specialists and glaciologists established benchmarks at the termini of 16 glaciers in the region. The glaciers were revisited sequentially in 1960, the late 1970s and 1987; the observations of glaciers proved that glacier retreat was a common characteristic, except for one glacier which began to advance after the late 1970s (Reference Su, Liu, Wang, Su, Wang and XieSu and others, 1998). Analysis of Advanced Spaceborne Thermal Emission and Reflection Radiometer (ASTER) and Landsat TM images acquired in 2001 shows that glaciers in the region were losing ice mass, although about 26% of glaciers had advanced compared with aerial photographs taken in 1965 (additional aerial photographs of some glaciers were taken in 1975).
Karakoram
The north slope of Karakoram is one of the most highly glacierized areas in China, and the second highest mountain peak in the world, K2, is located there. Early research from in situ observations in 1937, topographic maps in 1968 and a Landsat Multispectral Scanner (MSS) image in 1973 show that K2 (Qoger) Glacier retreated by 1.7 km between 1937 and 1968 but the retreat slowed between 1968 and 1973. Similar changes occurred in two nearby glaciers, but two advancing glaciers were found in the region during the same period (Reference ZhangZhang, 1980). A careful analysis based on maps and Landsat Enhanced Thematic Mapper Plus (ETM+) imagery indicates that glacier changes in this region are complicated; some of the large glaciers were in a steady state (equilibrium) or have advanced or even surged during recent decades (Table 2) (Reference Shangguan, Liu and DingShangguan and others, 2004b).
Table 2. Changes of some large glaciers during the last 30 years on the north slope of Karakoram (Reference Shangguan, Liu and DingShangguan and others, 2004b)

Tibetan Plateau
The broad area and regional high elevation of the TP provide optimum conditions for the development of glaciers under present-day climatic conditions. Glaciers on the TP account for 84% and 81.6%, respectively, of the total area and volume of glaciers (including those in Karakoram and the Qilian Shan) in China. Due to the complex meteorological factors of the westerlies and south Asian monsoons, glaciers on the TP are of monsoonal maritime (temperate, southeast part and Hengduan Shan), subcontinental (Himalaya, central northeast part) and extremely continental (central and northwest part) types. Glacier changes in the TP reflect differing patterns of climate in different parts of this large region. Glaciers in the Kunlun Shan, a mountain range along the northern margin of the TP, which extends from west to east, have generally retreated during the past four decades, but the reduction in glacier area is larger (17%) than that in 1966 (S. Reference Liu, Xie, Liu, Kang, Cheng and DongLiu and others, 2002) at the eastern end and smaller (0.3%) than that in 1970 (Reference Shangguan, Liu and DingShangguan and others, 2004a) at the western end of the mountains, with intermediate changes in the central section (Reference LiuLiu and others, 2004). In the central part of the TP, glaciers have been in relative equilibrium but with a trend toward a general retreat state during the past three decades (e.g. a decrease of 1.7% in glacier area in the basin that serves as the source of the Yangtze river) (Reference Lu, Yao, Liu, Ding and LiLu and others, 2002). However, glaciers on the north slope of the Himalaya have experienced extensive wastage as indicated by Reference Jin, Tao, Li and WuJin and others (2004); many small glaciers may have actually disappeared during the last 20 years.
5. Discussion and Concluding Remarks
By integrating the results of glacier changes in western China during the past 50 years (Table 3), we conclude that 82.2% of all the monitored glaciers retreated, while the others advanced. Advancing glaciers have not necessarily advanced over the entire observational period, and many may now be in retreat, as regional climate warming has been much more evident since the 1980s than in previous decades. Even allowing for the increase in area of some glaciers, the monitored glaciers still show a total area loss of 4.5% from the late 1950s to the late 1970s. As reflected by mass-balance variations on UG1 and other representative glaciers, mass wastage has tended to accelerate since the late 1970s or early 1980s, and especially during the 1990s. We conclude that widespread and intensive mass loss of glaciers can be forecast under continuing global warming.
Table 3. Glacier changes during the past few decades monitored by remote-sensing method

As can be seen from Table 3, the period of observation of glacier changes differs for the regions considered here, due to differences in the acquisition times of the aerial photographs and satellite images. To examine the regional characteristics of glacier changes, we calculated annual percentages of area changes (henceforth APAC) in every river basin or mountain region as shown in Figure 4. Of the 15 glacierized basins or mountains regions monitored, the APAC shows large regional differences that can be classified into three groups: class A (APAC ≤ 0. 1% a−1 (regions 3, 5, 6, 8 and 14)); class B ( 0. 1% a−1 <APAC ≤ 0.2% a−1 (regions 2, 4 and 10)); and class C (APAC > 0.2% a−1 (regions 1, 7, 9, 12 and 15)). These regional differences in glacier area reduction may arise from some combination of the differences in (1) monitoring period, (2) regional climate changes and (3) individual glacier responses to those changes.

Fig. 4. (a) Annual percentage glacier area changes in each river basin or mountain range. (b) The monitored regions: 1. Gaiz river; 2. Yarkant river; 3. Hotan river; 4. Keliya river; 5. Xinqingfeng (XQF) ice cap; 6. Geladandong mountain; 7. Pengqu river; 8. Gangri Gabu range; 9. A’nyêmaqên mountains; 10. west Qilian Shan; 11. Aksu river; 12. Kaidu river; 13. Kashi river; 14. Sikeshu river; 15. Ürümqi river.
To examine this further, we use recent climate change on the TP to explore regional differences in the high-elevation regions in western China. A comprehensive analysis of climate change over the TP from 1967 and 1997 was conducted by Reference Zhao, Chien-Lu, Daqing, Cheng, Ding and LiuZhao and others (2004). They divided the TP into four sub-regions and used a dataset consisting of records from 50 meteorological stations across the TP (Table 4). Over this three-decade period, a warming trend was found in all four regions, but the nature of this trend differed regionally. Air temperatures increased more during the cold season (October-March) than during the warm season (April-September), particularly on the northern part of the TP where the cold-season mean increased by ∼1 ˚C over the three decades, compared to 0.4−0.5˚C in the central and southeastern parts of the TP. Over the same period, warm-season temperatures increased by ∼0.35−0.65˚C in the central and southeastern parts of the TP. Annual precipitation totals decreased in the northeast while they increased in the northwest, central and southeast. The largest increase in annual precipitation, ∼13mm, representing 35% of the 31 year mean (1967−97), occurred in the northwestern part of the TP, mainly on the north slope of the western Kunlun Shan. In the southeastern region of the TP, the average annual precipitation increase was ∼30 mm, or 5.3% of the 31 year mean (1967−97). In the interior (central region), the average annual increase was ∼20 mm, or 4.1% of the 31 year mean, while in the northeast the annual mean precipitation decreased by ∼4 mm, or 2% of the 31 year mean. Based on ice-core δ18O records and radiosonde observations, Reference Shi, Liu, Wang, Liu and YeShi and others (2005) suggest that the northern part of the TP may have experienced a cooling trend in the last few decades (1961−2002). The results presented by Reference Zhao, Chien-Lu, Daqing, Cheng, Ding and LiuZhao and others (2004) suggest that the greatest warming over the TP was not in the central region.
Table 4. Climate change over the TP, 1967–98 (Reference Zhao, Chien-Lu, Daqing, Cheng, Ding and LiuZhao and others, 2004)

As the central and northwestern parts of the TP contain predominantly polar-type glaciers, it is possible that their slower dynamic response explains why they have exhibited small changes during the last 40 years. Glacier changes in the southeastern TP may have resulted from the smaller warming trend and increased precipitation, coupled with the fact that the temperate glaciers that dominate the region are more dynamically sensitive. Many of the glaciers in this region have advanced, indicating an overall positive mass balance. Data from two meteorological stations in the area, in the Gangri Gabu range, record a 20% increase in annual precipitation (1961−2002) that likely contributed to a positive mass balance for many of the glaciers over the last two decades. Glaciers in the northeastern TP fall into the subcontinental- or the subpolar-type glacier categories. During the last four decades (prior to 2000), pronounced warming and reduction of precipitation, especially since the late 1980s, likely resulted in a dramatic glacier mass loss, as evidenced in the A’nyemaqen mountains where the largest annual mean area reduction in the percentage of glaciers was observed (Table 4).
In summary, over the last five decades the overall trend for glaciers in western China has been one of retreat; however, regional differences exist. These we attribute to different dynamical responses of the glaciers as a function of their different sizes and physical properties, along with regional climate-change differences. We conclude that strong warming and reduced precipitation are likely key drivers for the extensive ice-cover reduction in the eastern and southern parts of the TP. In contrast, recent cooling in the northwestern and central part of the TP may partially explain the relatively stable condition of those glaciers. The modest warming trend and increase in precipitation in the southeastern part of the TP could account for the modest changes in glaciers there. Although precipitation has increased in northwest China (e.g. Tien Shan, Qilian Shan, eastern Pamirs), the strong warming may be the principal factor driving glacier retreat, although large glaciers with heavy debris cover in their ablation areas may also contribute to the ice-extent variations in the region.
Glacier recession is a key factor in the variability of water resources in the arid river systems of northwest China. The recent increase in discharge by these rivers may be partially related to the increase in glacial runoff caused by ice loss during glacier retreat. Although the glaciers that we (and others) have monitored account for only 10% of the number and 24% of the total area of glaciers in China, our results may be extrapolated to infer glacier changes in various mountain regions of China. However, a more comprehensive glacier-monitoring effort is needed, as there are regions where glacier changes have yet to be assessed. In addition, to determine ice-volume changes and validate these results requires higher-resolution images with stereoscopic capability, such as the ASTER instrument, synthetic aperture radar (SAR)/interferometric SAR (InSAR), and laser altimetry techniques. Furthermore, field investigations must be intensified and modeling techniques applied to several typical glacierized watersheds to better understand glacial-runoff processes.
Acknowledgements
We thank R.S. Williams, Jr for technical review and careful editing of the manuscript, an anonymous referee for helpful suggestions, Mi Desheng for producing the Figure 1 map, and E. Mosley-Thompson for helping us prepare the final version of the paper. This research was financially supported by the China National Natural Science Foundation (grants 90202013 and 40371026) and the Chinese Academy of Sciences (grant Nos. KZCX3-SW-345, KZCX3-SW-339 and 2004102).


