


INTRODUCTION
Supraglacial lakes (SGLs) are known to affect the stability of ice shelves, which have an important buttressing effect on outlet glaciers around ice sheets (e.g. Scambos and others, Reference Scambos, Bohlander, Shuman and Skvarca2004; Dupont and Alley, Reference Dupont and Alley2005; De Rydt and others, Reference De Rydt, Gudmundsson, Rott and Bamber2015). Therefore, SGLs on ice shelves are likely to play an important role in the response of ice sheets to climate change, with recent studies suggesting that surface meltwater could become a primary factor in the future demise of Antarctica's ice shelves (e.g. DeConto and Pollard, Reference DeConto and Pollard2016).
Around the north coast of the GrIS, numerous outlet glaciers terminate in narrow floating ice shelves, situated in confined fjords; features that we call ‘tongues’ in this study. In comparison, Antarctic ice shelves are more typically present in wider embayments. However, as the floating glacier ice in both environments is commonly constrained by embayment walls, both are typically subject to stress at their lateral margins and exhibit shear profiles in their seaward velocity. Although the magnitudes of these shear stresses will differ, floating ice shelves and tongues are considered similar in their form and environmental setting.
Although recent research has shown that numerous Antarctic ice shelves experience surface melting sufficient to enable widespread surface stream and lake formation (Langley and others, Reference Langley, Leeson, Stokes and Jamieson2016; Lenaerts and others, Reference Lenaerts2016; Bell and others, Reference Bell2017; Kingslake and others, Reference Kingslake, Ely, Das and Bell2017), to our knowledge, no studies of SGLs on the floating tongues around the Greenland ice sheet (GrIS) exist. Therefore, our prior knowledge of the evolution and effects of SGLs on the stability of the floating glacier ice around Greenland comes from previous studies of SGLs on Antarctic ice shelves.
Around the Antarctic ice sheet (AIS), SGLs on ice shelves have been shown to promote ice-shelf instability and potential break-up in three ways. SGLs can: (i) fill and propagate fractures downwards through the ice (i.e. ‘hydrofracture’, Weertman, Reference Weertman1973; van der Veen, Reference van der Veen1998, Reference van der Veen2007; Alley and others, Reference Alley, Dupont, Parizek and Anandakrishnan2005), enabling them to drain rapidly (Scambos and others, Reference Scambos, Hulbe, Fahnestock and Bohlander2000, Reference Scambos, Hulbe, Fahnestock, Domack, Burnett, Leventer, Conley, Kirby and Bindschadler2003; Gilbert and Domack, Reference Gilbert and Domack2003; Banwell and others, Reference Banwell, MacAyeal and Sergienko2013); (ii) act as time-dependent loads, which can cause a flexural response of the ice shelf, thereby weakening the ice shelf (MacAyeal and Sergienko, Reference MacAyeal and Sergienko2013; Banwell and MacAyeal, Reference Banwell and MacAyeal2015); and (iii) have a positive feedback effect on surface melt rates through enhanced lake-bottom ablation due to the lower albedo of water compared with the surrounding ice/snow (Tedesco and others, Reference Tedesco2012).
While SGLs on grounded ice form in depressions that reflect bedrock topography and ice flow conditions (Echelmeyer and others, Reference Echelmeyer, Clarke and Harrison1991; Sergienko, Reference Sergienko2013), SGLs on floating ice shelves develop within surface topographic undulations that form in response to a variety of processes, including: (i) basal crevassing (McGrath and others, Reference McGrath2012) and channelling (Le Brocq and others, Reference Le Brocq2013); (ii) grounding-line flexure (e.g. Walker and others, Reference Walker2013); and (iii) incomplete flexural rebound from previous lake drainage events that often result in the formation of ‘dolines’ (Glasser and Scambos, Reference Glasser and Scambos2008; Banwell and MacAyeal, Reference Banwell and MacAyeal2015). This means that in contrast to SGLs on grounded ice that remain in a fixed interannual location (Thomsen and others, Reference Thomsen, Thorningm and Braithwaite1988; Selmes and others, Reference Selmes, Murray and James2011), SGLs on floating ice usually advect with ice flow (Banwell and others, Reference Banwell2014; Langley and others, Reference Langley, Leeson, Stokes and Jamieson2016). Alternatively, SGLs on ice shelves may form in ‘pressure rolls’ associated with compressive stress at the boundaries between floating ice and land. Consequently, SGLs in these pressure rolls will migrate at a speed and direction that differs from ice flow (LaBarbera and MacAyeal, Reference LaBarbera and MacAyeal2011). In addition to the presence of a surface topographic depression, lake formation on floating or grounded ice requires a surface of bare ice or firn that is sufficiently impermeable to enable water to pond (Scambos and others, Reference Scambos, Hulbe, Fahnestock and Bohlander2000; Banwell and others, Reference Banwell2012; Lenaerts and others, Reference Lenaerts2016; Bevan and others, Reference Bevan2017).
Although various studies have suggested that SGLs on Antarctic ice shelves may have drained rapidly by hydrofracture, such as on the Larsen B Ice Shelf (Scambos and others, Reference Scambos, Hulbe, Fahnestock, Domack, Burnett, Leventer, Conley, Kirby and Bindschadler2003; Glasser and Scambos, Reference Glasser and Scambos2008; Banwell and others, Reference Banwell, MacAyeal and Sergienko2013), no direct observations exist. The quickest observed SGL drainage event on an ice shelf took 5 days (Langley and others, Reference Langley, Leeson, Stokes and Jamieson2016), however, the precision of this drainage time is likely to be limited by the return-time of satellite imagery. Based on the physics of the hydrofracture mechanism (e.g. Weertman, Reference Weertman1973; van der Veen, Reference van der Veen1998, Reference van der Veen2007; Alley and others, Reference Alley, Dupont, Parizek and Anandakrishnan2005), lake drainage through this process is likely to occur over the order of a few hours on floating ice (Banwell and MacAyeal, Reference Banwell and MacAyeal2015), comparable with the time that this process has been observed to take on the grounded ice of the GrIS (e.g. Das and others, Reference Das2008; Tedesco and others, Reference Tedesco2013; Williamson and others, Reference Williamson, Willis, Arnold and Banwell2018). Alternatively, SGLs on Antarctic ice shelves have been observed to drain more slowly by overspilling their basins. And/or, they may either partially drain, or not drain at all, and instead re-freeze (Langley and others, Reference Langley, Leeson, Stokes and Jamieson2016) and/or become covered in snow (Koenig and others, Reference Koenig2015; Lenaerts and others, Reference Lenaerts2016).
For both the AIS and GrIS, the loss of the buttressing forces provided by floating ice shelves and tongues has been observed and modelled to significantly increase upstream outlet glacier flow speeds. For example, the collapse of Antarctica's Larsen B Ice Shelf in 2002 caused a multi-annual sixfold increase in speed, grounding-line retreat and thinning of tributary glaciers feeding it (Rignot and others, Reference Rignot2004; Scambos and others, Reference Scambos, Bohlander, Shuman and Skvarca2004; Rott and others, Reference Rott, Müller, Nagler and Floricioiu2011; De Rydt and others, Reference De Rydt, Gudmundsson, Rott and Bamber2015; Wuite and others, Reference Wuite2015). Similarly, the loss of 95% of north Greenland's Zachariae Isstrom's ice shelf between 2002 and 2014 caused the glacier's flow rate to almost double (Mouginot and others, Reference Mouginot2015).
Given the importance of the buttressing force of ice shelves against inland ice, and the clear link between ice shelf SGLs and stability that has already been established in Antarctica, this study aims to present the first analysis of SGLs on one of Greenland's floating tongues.
Focusing on Petermann Glacier, northwest Greenland, our first objective is to analyse the inter- and intraseasonal evolution in the overall pattern of lakes on its floating ice tongue over three consecutive melt seasons, 2014, 2015 and 2016. Our second objective is to focus more specifically on the inter- and intraseasonal evolution of two individual SGLs that repeatedly fill and drain during the three melt seasons. And finally, to help determine the extent to which our extensive knowledge of SGLs on the GrIS's grounded ice can be applied to SGLs on floating tongues, our third objective is to compare the characteristics of a subset of SGLs on the floating tongue to SGLs on the grounded ice of Petermann Glacier during June 2014.
STUDY SITE
Petermann Glacier (Fig. 1), northwest Greenland (81°N), drains ~4% of the ice sheet northwards into Petermann Fjord (Münchow and others, Reference Münchow, Padman and Fricker2014). It terminates in a floating tongue that had an area of ~1000 km2 in 2016. As is typical of floating tongues and ice shelves, it has a low surface gradient; the elevation change is only ~40 m over a distance of ~40 km from the ice front to the grounding line. Ice thickness varies across the tongue but ranges from ~600 m by the grounding line to <100 m close to the terminus (Münchow and others, Reference Münchow, Padman and Fricker2014). It is one of only seven glaciers in Greenland with a permanently floating tongue, all of which are located on the north coast (Moon and others, Reference Moon, Joughin, Smith and Howat2012).
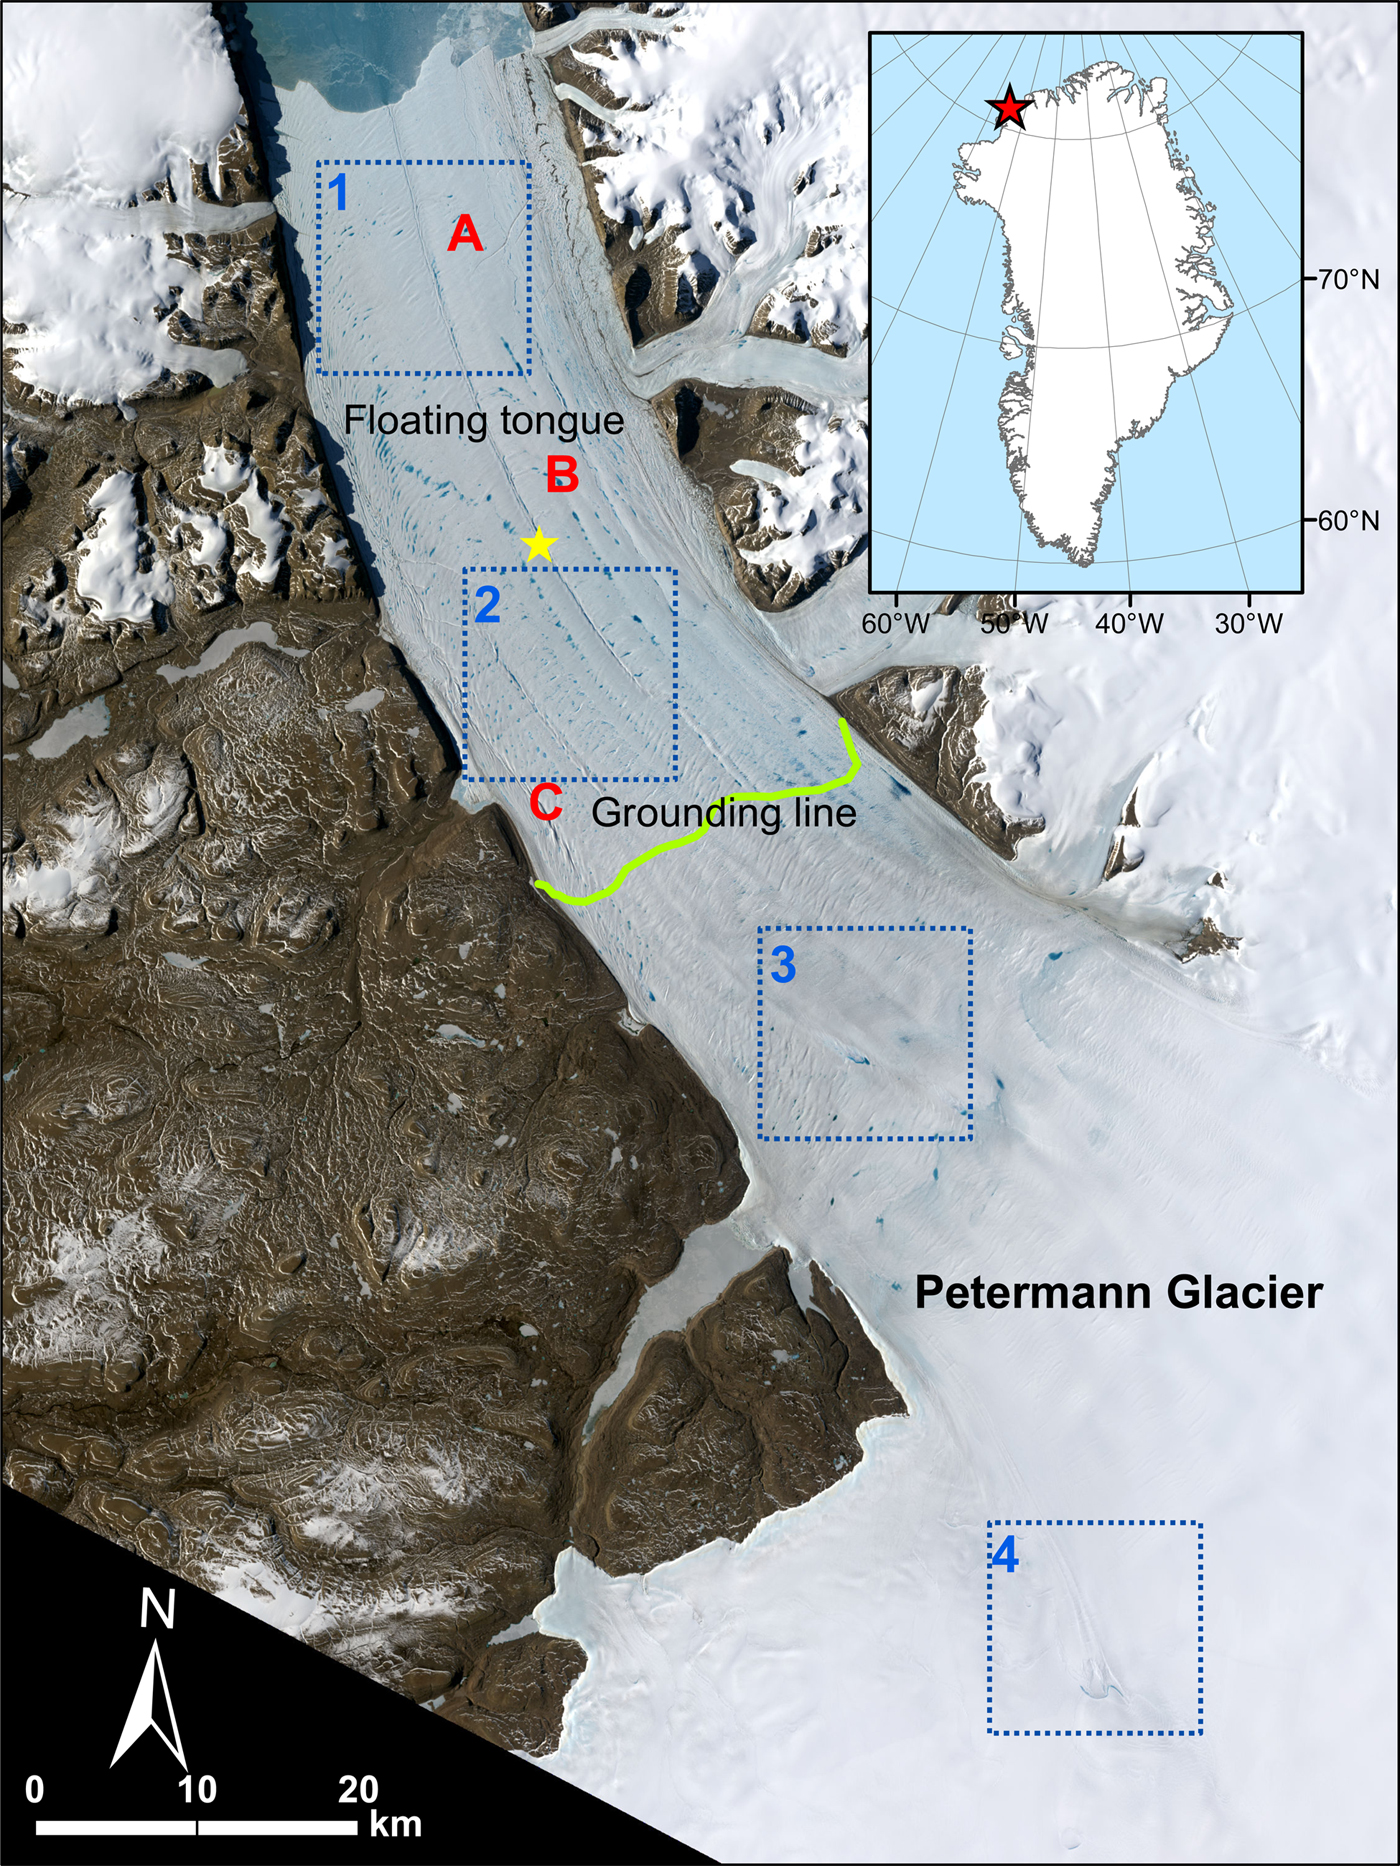
Fig. 1. The study site, Petermann Glacier, northwest Greenland, shown in a pan-sharpened true colour Landsat 8 OLI image, dated 18 June 2016. The approximate grounding line position (following Rignot, Reference Rignot1998) is shown by the green line. The letters A, B and C indicate the locations of lakes shown in Figures 6 and 7, and the numbers 1–4 indicate the location of the subsampled areas used to compare SGLs on the floating and grounded ice in Figures 8 and 9. The yellow star indicates the location of the ~5.5 km2 pixel from HIRHAM5's output used to represent daily mean surface temperature.
The glacier lost ~40% of its tongue in two massive calving events in 2010 and 2012, and its terminus is now at its most retreated position since records began (Nick and others, Reference Nick2012; Münchow and others, Reference Münchow, Padman and Fricker2014). These large calving events, however, did not cause a significant change in the velocity or thickness of the glacier (Nick and others, Reference Nick2012) and research suggests that the grounded glacier is currently dynamically stable. Its grounding line is at ~600 m below sea level on a forward slope, and the bed remains below sea level up to ~80 km inland of the grounding line (Rignot, Reference Rignot1998; Bamber and others, Reference Bamber, Siegert, Griggs, Marshall and Spada2013). Although the position of the grounding line has varied by an average of 470 m between 1992 and 2011 (with a maximum range of 7 km), it experienced no systematic retreat or advance (Hogg and others, Reference Hogg, Shepherd, Gourmelen and Engdahl2016). However, this does not preclude the potential for future changes in the glacier's velocity and mass balance in response to tongue break-up events (Nick and others, Reference Nick2012; Hogg and others, Reference Hogg, Shepherd, Gourmelen and Engdahl2016).
For the GrIS as a whole, the average daily melt during the summers of the study period 2014–16 was largely unremarkable compared with the preceding decade but continued the overall trend of increased melting (Tedesco and others, Reference Tedesco2014, Reference Tedesco2015, Reference Tedesco2016). Additionally, data from an ice-sheet wide network of weather stations (PROMICE) suggests that net ablation, especially in northern regions, has been larger in recent years (2008–15) than during any period in the previous ~150 years (van As and others, Reference van As2016).
DATA AND METHODS
Satellite image acquisition and processing
All Landsat 8 Operational Land Imager (OLI) images of Petermann's floating tongue that were either completely or partially cloud-free for the boreal summers (i.e. June–August) of 2014, 2015 and 2016 were downloaded from the EarthExplorer website (Tables S1 and S2).
OLI imagery was partly chosen for its high spatial resolution (30 m), compared with, for example, Moderate Resolution Imaging Spectroradiometer (MODIS) imagery; the resolution (250 m) of which precludes such accurate lake identification and volume analysis. OLI imagery also does not have the missing scanlines of Landsat 7 Enhanced Thematic Mapper Plus (ETM+), and therefore, we choose to study the three summers succeeding the launch of Landsat 8. Compared with ETM+, OLI also has enhanced radiometric resolution (12 bit compared with 8 bit), and features narrower multispectral and panchromatic bands, allowing for improved lake-identification and lake-depth estimation. Additionally, OLI has a higher temporal acquisition rate than ETM+ and although it has a 16-day revisit time, the overlap between orbits means that images of the study site were sometimes acquired for consecutive days.
Once acquired, images were cropped to the area of interest in ArcMap™. Subsequently, the up-glacier boundary of the floating tongue was defined, based on the position of the grounding line estimated by Rignot (Reference Rignot1998). As mentioned in the section above, although the grounding line position has varied over the last three decades, it has not systematically retreated or advanced, and thus this grounding line position is considered the best estimate for this study.
Seasonal evolution of SGLs from 2014 to 2016 (objective i)
To conduct analysis of the inter- and intraseasonal evolution of SGLs (2014–16), only images that were completely cloud-free over the tongue (15 images in 2014, 18 in 2015 and 24 in 2016) were used (Table S1). Following processing (section ‘Satellite image acquisition and processing’), a mask of SGL boundaries in each image was produced in MATLAB™ using a lake boundary/area algorithm, following the method of Banwell and others (Reference Banwell2014), which is based on the algorithm developed by Box and Ski (Reference Box and Ski2007) (see the Supplementary Information for further details). From the masks, total lake number (TLN) and total lake area (TLA) were calculated for each image in each of the three melt seasons. Next, following the method of Sneed and Hamilton (Reference Sneed and Hamilton2007) and Banwell and others (Reference Banwell2014), but adapted for OLI instead of ETM+ (Pope and others, Reference Pope2016), a lake-depth algorithm was applied to calculate the water depth of all pixels previously identified as being part of a lake (see the Supplementary Information for further details). Using these results, total lake volume (TLV) and mean lake depth (MLD) for each image was calculated.
Next, to analyse the inter- and intraseasonal evolution of TLN, TLV, TLA and MLD in response to air temperature and thus surface melt conditions on the floating tongue, these four calculated statistics were compared with both the surface air temperature and surface runoff products from the Danish Meteorological Institute's (DMI) HIRHAM5 regional climate model for all years. These data were sourced from HIRHAM5's daily meteorological re-analysis product for 2014 (documented in Langen and others, Reference Langen, Fausto, Vandecrux, Mottram and Box2017) and the operational product for 2015 and 2016 (as the reanalysis product for 2015 and 2016 was not yet available at the time of our study). A single ~5.5 km2 cell, located mid-way up the tongue (at 60.6°W, 80.7°N, Fig. 1), from the DMI's model output, was used to represent mean daily air temperatures of the tongue throughout the study period. This was deemed acceptable as the magnitudes and seasonal trends in runoff (and therefore air temperatures) across the relatively flat tongue do not show significant variation (Fig. 2). Additionally, for each year, HIRHAM5's surface runoff product was used to analyse the mean daily surface runoff across the tongue for the periods 1–15 June, 16–30 June, 1–15 July, 16–31 July, 1–15 August and 16–31 August. There is no observational weather data available for the region during the study period with which to facilitate an assessment of HIRHAM5's validity in the study area. However, HIRHAM5's overall performance has been validated against observations from the PROMICE network of automatic weather stations across the GrIS (Langen and others, Reference Langen2015, Reference Langen, Fausto, Vandecrux, Mottram and Box2017), and we regard this validation sufficient for the present study.
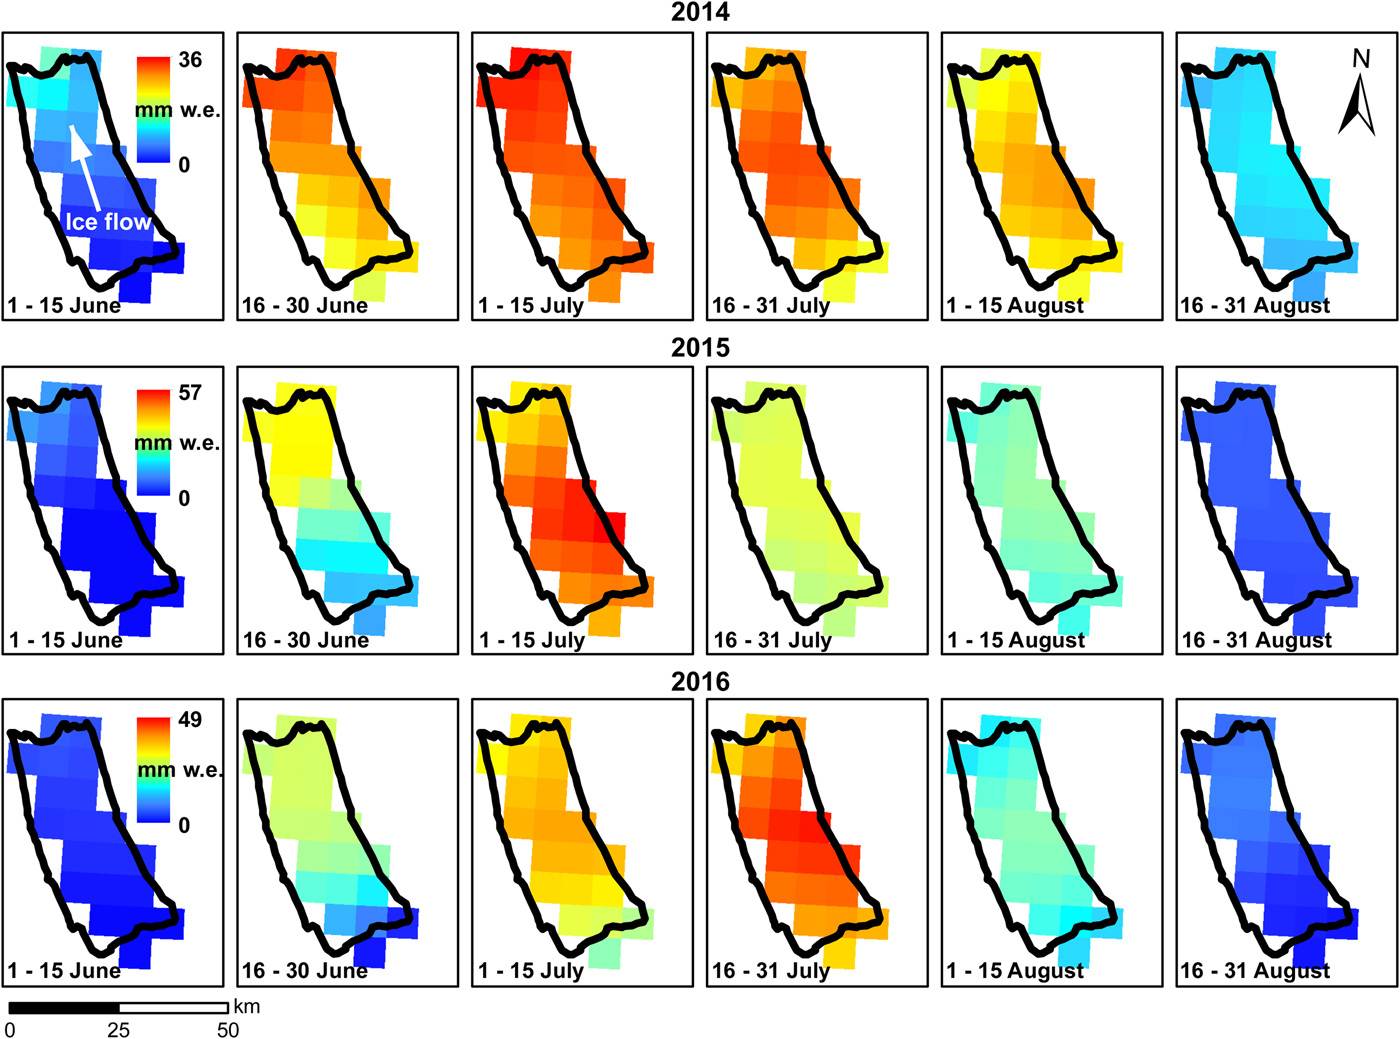
Fig. 2. Mean daily surface runoff (mm w.e.) through the 2014, 2015 and 2016 melt seasons. Petermann's floating tongue is shown by the black outline. Plots within each year have the same colour bar scale.
Seasonal evolution of individual SGLs (2014–16) (objective ii)
To analyse the inter- and intraseasonal evolution of individual lakes, with a specific focus on their filling and drainage patterns, two lakes that were observed to fill and drain from a sequence of high-temporal resolution imagery were chosen (Lakes A and B, locations indicated in Fig. 1). This analysis made use of images that were completely cloud-free over the tongue and also the images that were at least cloud-free at the sites of the specific lakes (15 images for Lake A, 33 for Lake B; Table S2). All selected images were cropped to only include Lake A or B, and lake volumes in each image were calculated using the lake boundary/area and depth algorithms. A lake was deemed to have drained ‘rapidly’ if >90% of volume drained within 48 h (Selmes and others, Reference Selmes, Murray and James2011), or ‘slowly’ if drainage exceeded this time. Finally, to include examples of lakes that do not drain in our analysis, two cloud-free images of a group of lakes (location indicated by C in Fig. 1) that freeze-over and/or are buried by snow were analysed by manual visual interpretation.
Comparison of SGLs on the floating tongue and grounded ice (objective iii)
To compare SGLs on the floating tongue with those on the grounded ice, four equally-sized areas (187 km2) were selected, two of which are located on the tongue (Sites 1 and 2 in Fig. 1) and two on the grounded ice (Sites 3 and 4 in Fig. 1). An OLI image dated 30 June 2014 was used to analyse SGLs within Sites 2, 3 and 4, but as Site 1 did not fall within this image, an OLI image captured 3 days earlier (27 June 2014) was instead used for this site. These images from late June were chosen because it was then that SGLs were widespread on both the floating tongue and the up-glacier grounded ice, and there was no single cloud-free image that included all four sites around this time.
The two images were cropped to each site's area of interest and the lake boundary/area and lake-depth algorithms were used to calculate the maximum and mean depths, and areas, for SGLs in each site. The results from the two floating tongue sites (1 and 2) and two grounded sites (3 and 4) were each combined into ‘floating’ and ‘grounded’ sets of results, respectively, and were quantitatively compared.
RESULTS
Intra- and interseasonal evolution of meltwater features on the floating tongue (2014–16)
In each of the three melt seasons studied, SGLs first start to develop on the tongue in early June, before rapidly increasing in total number, volume, area and density over the following days and weeks (Fig. 3). For example, in just 1 day (11–12 June 2016) TLN, TLA and TLV increase by 173%, 270% and 248%, respectively (Fig. 3 and Fig. S1). Mean daily temperatures >0 °C are also first recorded in the first half of June each year. Peak TLN, TLA and TLV are reached in late June or early July in each year, but these peaks do not always occur simultaneously. Following these times, TLN, TLA and TLV decline throughout the rest of the summer, though some fluctuations around this trend do occur. Conversely, air temperatures peak in July or August, and the longest continuous periods of daily mean temperatures >0 °C occur in these months, while TLN, TLA and TLV decline (Fig. 3 and Fig. S1). In contrast to TLN, TLA and TLV, MLD does not decline through July and August. Instead, after rising through June/early-July, MLD then becomes relatively stable (1–1.5 m) until the end of the season (Fig. 3).
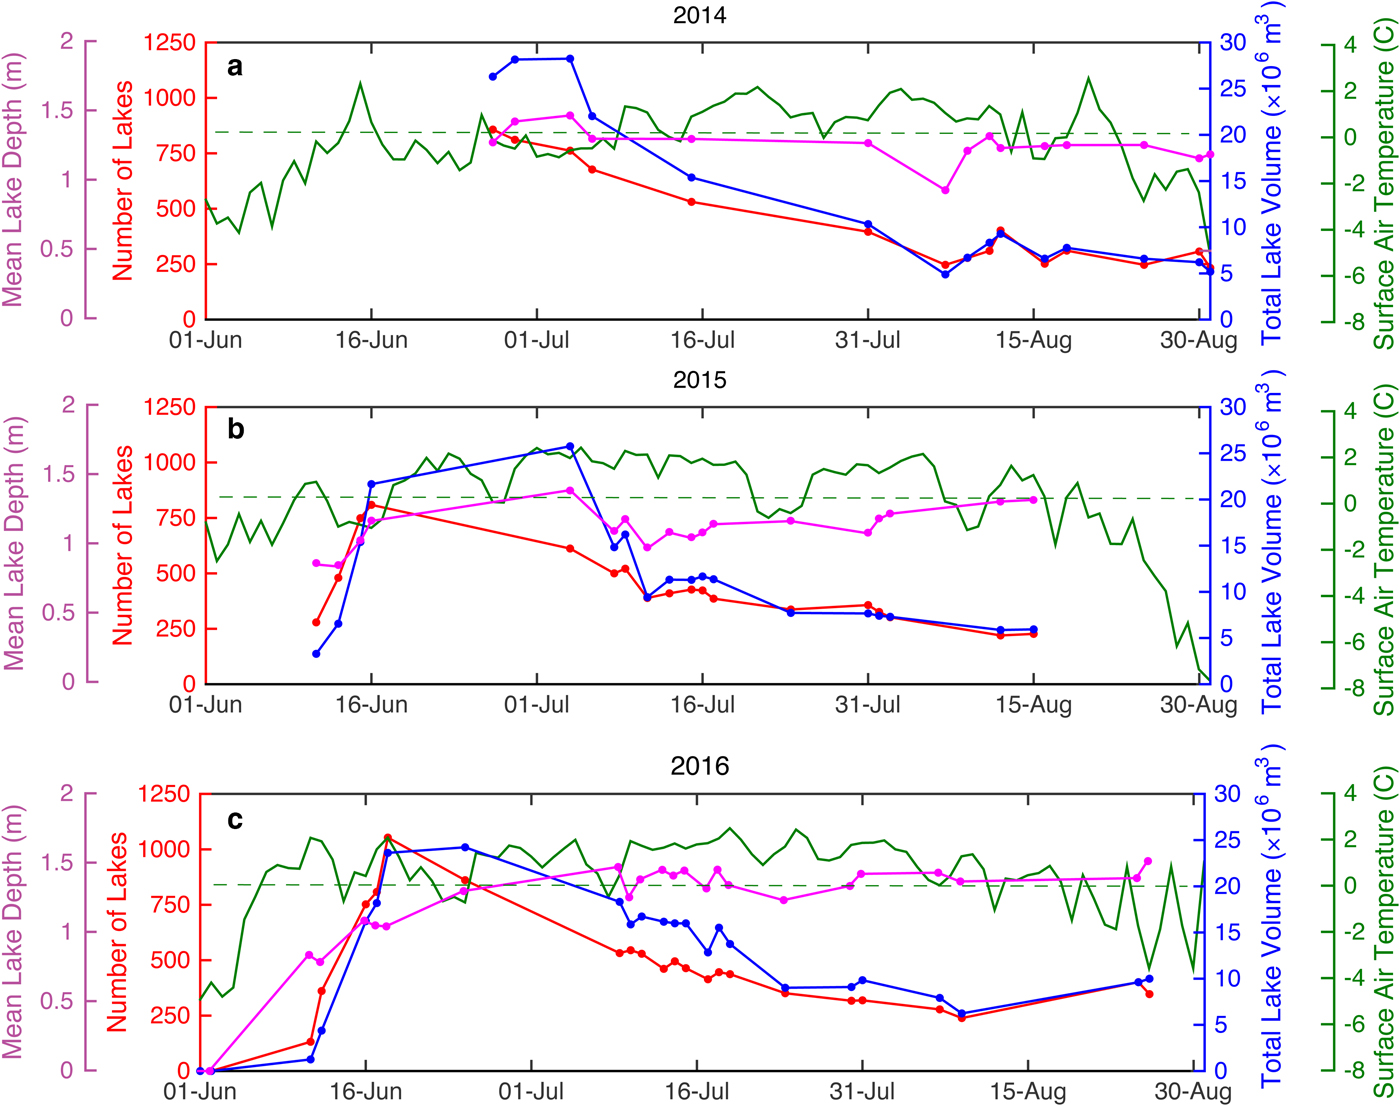
Fig. 3. Total lake number (TLN, red), total lake volume (TLV, blue), mean lake depth (MLD, purple) and daily mean surface air temperature (green) on Petermann's floating tongue in (a) 2014, (b) 2015 and (c) 2016.
SGL development varies spatially across the tongue during each melt season (Fig. S2). SGLs evolve up-glacier in both 2015 and 2016 (unfortunately, there is insufficient imagery during 2014 to evaluate this phenomenon). For example, between 16 June and 4 July 2015 (Fig. S2), the areal extent of SGLs declines on the lower part of the tongue, but increases in the upper ~18 km, close to the grounding line. A similar pattern is observed between 18 June and 25 June 2016. In both cases, this pattern of SGL expansion close to the grounding line is concurrent with an overall decrease in TLN, and an overall increase in TLV and MLD across the whole tongue (Fig. 3) (TLA slightly increases over this period in 2015 but decreases in 2016; Fig. S1). In each year, higher runoff values spread up-glacier as runoff increases. The location of the highest runoff value in each period also moves closer to the grounding line through June and July (Fig. 2).
At the time of peak TLA (Fig. S1), the area of the tongue covered by SGLs in 2014, 2015 and 2016, is 2.5, 2.3 and 2.8%, respectively. The warmest melt season out of the three studied is 2016, with a mean temperature of 0.65 °C, and the coldest melt season is 2014, with a mean temperature of −0.06 °C (Fig. 3). Not surprisingly, 2016 also has the greatest number of days (69) with a mean temperature >0 °C and the earliest day (7 June) with a mean temperature >0 °C. In contrast, 2014 has the smallest number of days (41) with a mean temperature >0 °C and the latest day (14 June) with a mean temperature >0 °C. Further, 2016 records the highest TLN (1053 lakes) and TLA (22.62 km3) and earliest peak TLV (24.22 × 10⁶ m3). However, although 2014 records the lowest mean temperature, it has the highest peak TLV (28.24 × 10⁶ m3, which occurs 9 days later than in 2016).
While the pattern of lake distribution across the tongue appears broadly similar in each year, there are small interannual differences in SGL locations due to ice flow (Fig. 4). During our study period, SGLs migrate down-glacier with ice flow at ~1.2 km a−1, which is comparable with the velocity observations made by Nick and others (Reference Nick2012) (1.1–1.4 km a−1).
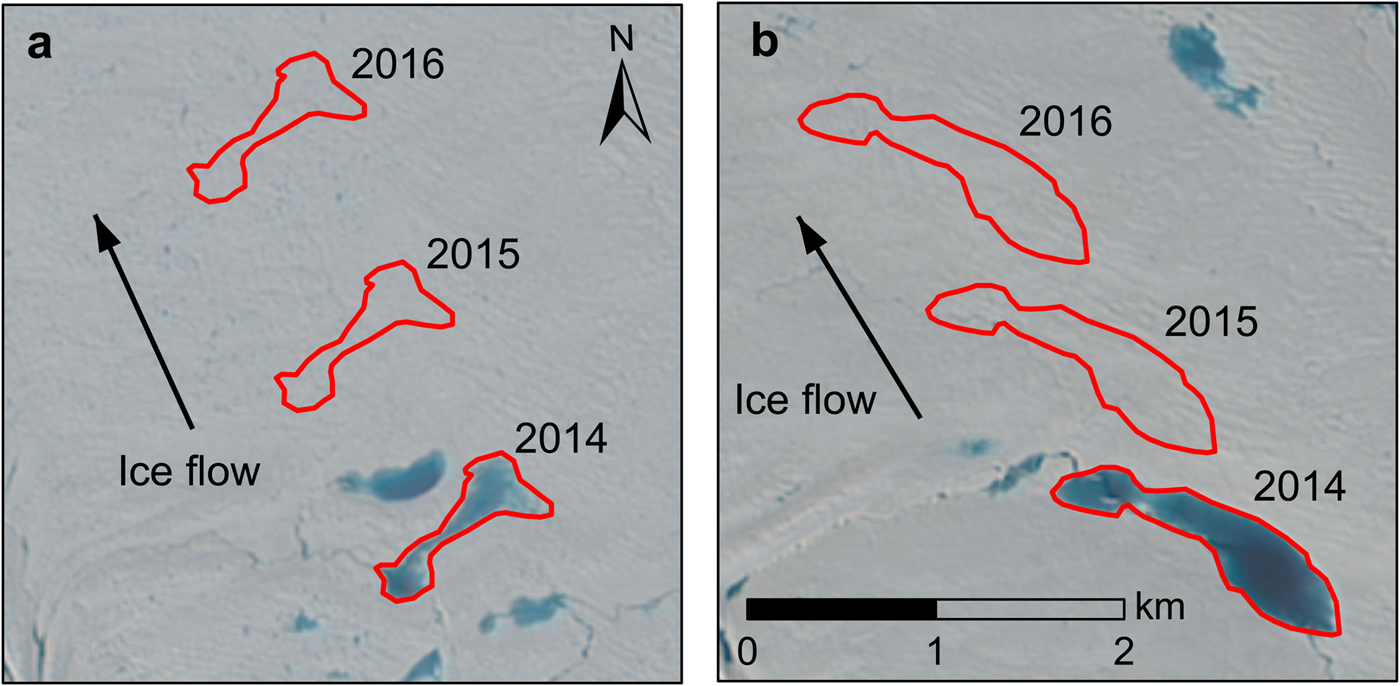
Fig. 4. The down-glacier interannual migrations of Lakes A and B between 2014 and 2016. (a) Lake A and (b) Lake B on 24 June 2014 and their positions on 16 June 2015 and 18 June 2016. The background of both panels is an OLI image dated 24 June 2014.
We also note that in each melt season, a supraglacial river forms along the centre-line of the tongue and terminates at the ice front (Fig. 5), which is likely the same river identified in 2014 by Bell and others (Reference Bell2017). The river is visible in imagery between 27 June and 18 August 2014, 11 June and 14 August 2015, and 11 June and 9 August 2016. Each year, it reoccupies the same central channel that was observed by Münchow and others (Reference Münchow, Padman and Fricker2014), identified as an area of low ice thickness. Each summer, the river begins its activity on the same date that SGLs are first identified (mid-late June). On 15 July 2016, a meltwater plume is visible in the ocean where the river terminates at the ice front (Fig. 5d). In all three melt seasons, the river remains active until it empties in mid-late August.
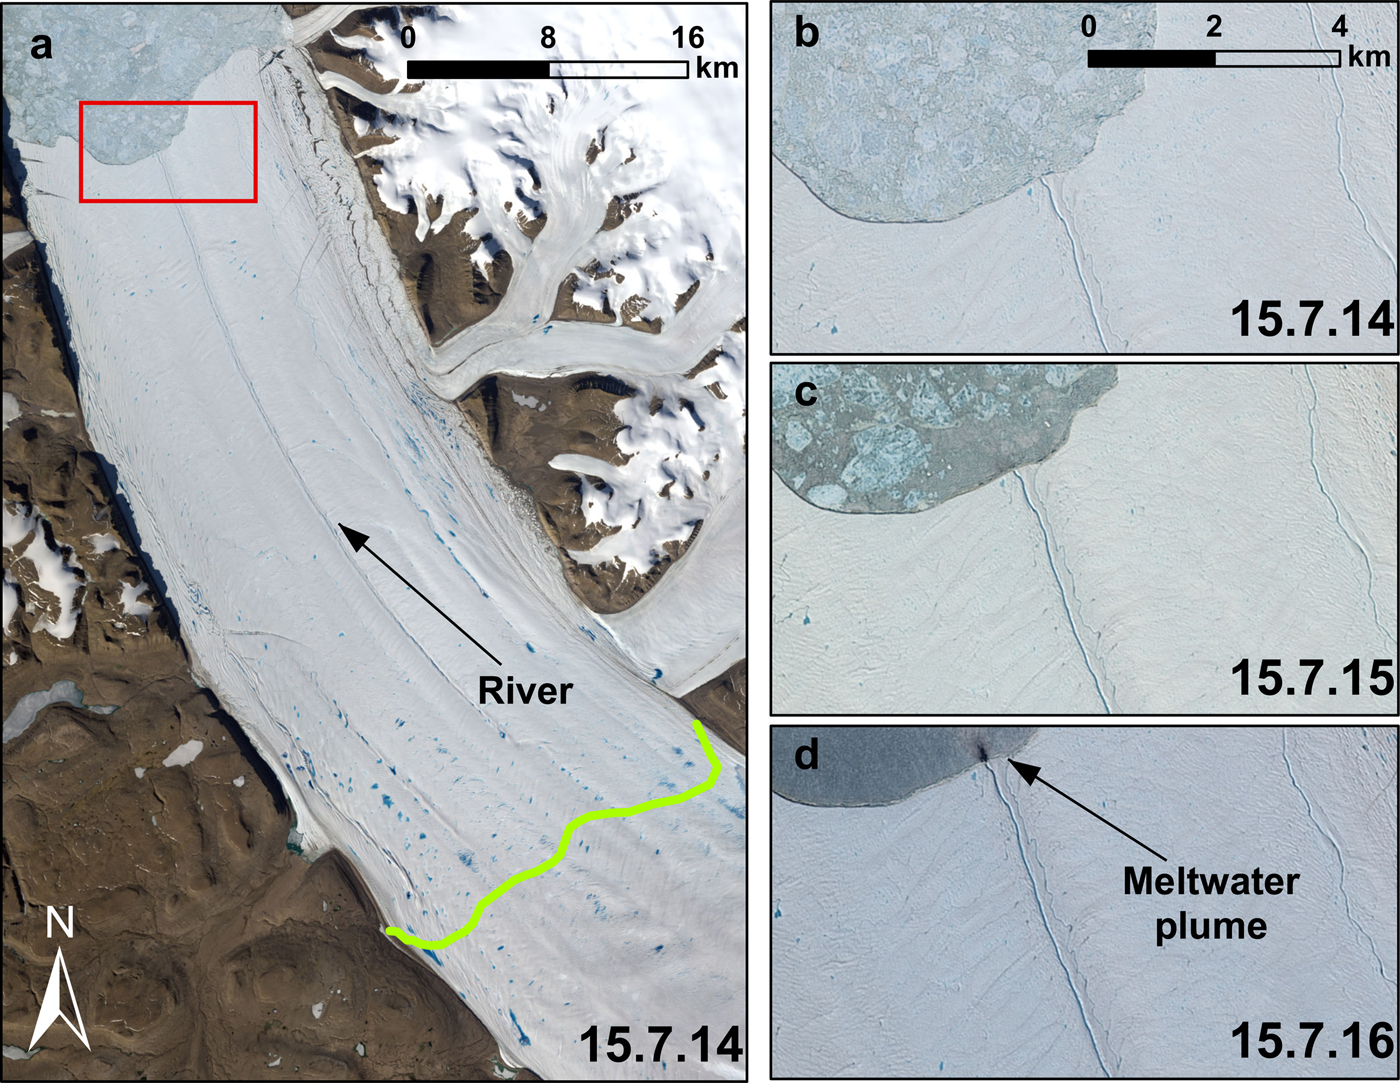
Fig. 5. The active river that forms annually down the centre-line of Petermann's floating tongue and terminates in the ocean. The whole tongue is shown on 15 July 2014, and just the terminus area is shown on 15 July in (b) 2014, (c) 2015 and (d) 2016 in pan-sharpened OLI images. The red box shows the location and extent of (b–d) and the green line indicates the location of the grounding line (following Rignot, Reference Rignot1998). Note the visible meltwater plume in the ocean where the river terminates in 2016 (d).
Individual lake development and drainage on the floating tongue (2014–16)
Following lake development in early June in all 3 years, SGLs generally expand in the area, coalesce with nearby lakes and then drain or become covered by snow or ice. We observe two instances of SGLs draining ‘rapidly’, both in 2014 (Figs 4 and 6a and b). For example, between 24 and 25 June 2014, Lake A loses 96% of its 12.37 × 10⁴ m3 volume and the remainder drains over the following day (Fig. 7a). The same lake, however, does not drain as rapidly in other years, taking >4 days to drain in 2015 and >6 days to drain in 2016 (Fig. 7a). Lake B also drains rapidly between 25 and 27 June 2014, when it loses 32% of its volume after 1 day and 92% after 2 days (Fig. 7b). Like Lake A, Lake B also does not drain as rapidly in other years, taking >18 days to drain more than 90% of its volume in 2015 and >7 days in 2016 (Fig. 7b). Many SGLs, such as Lakes A and B in 2015 and 2016, drain slowly over several days to weeks by overflow into surface channels. Some of these SGLs drain fully and others only partially. Finally, many other SGLs do not drain at all, especially those close to the grounding line, such as those at location C (Fig. 1) and instead freeze-over and/or are buried by snowfall events in late August and early September (Fig. 6c).
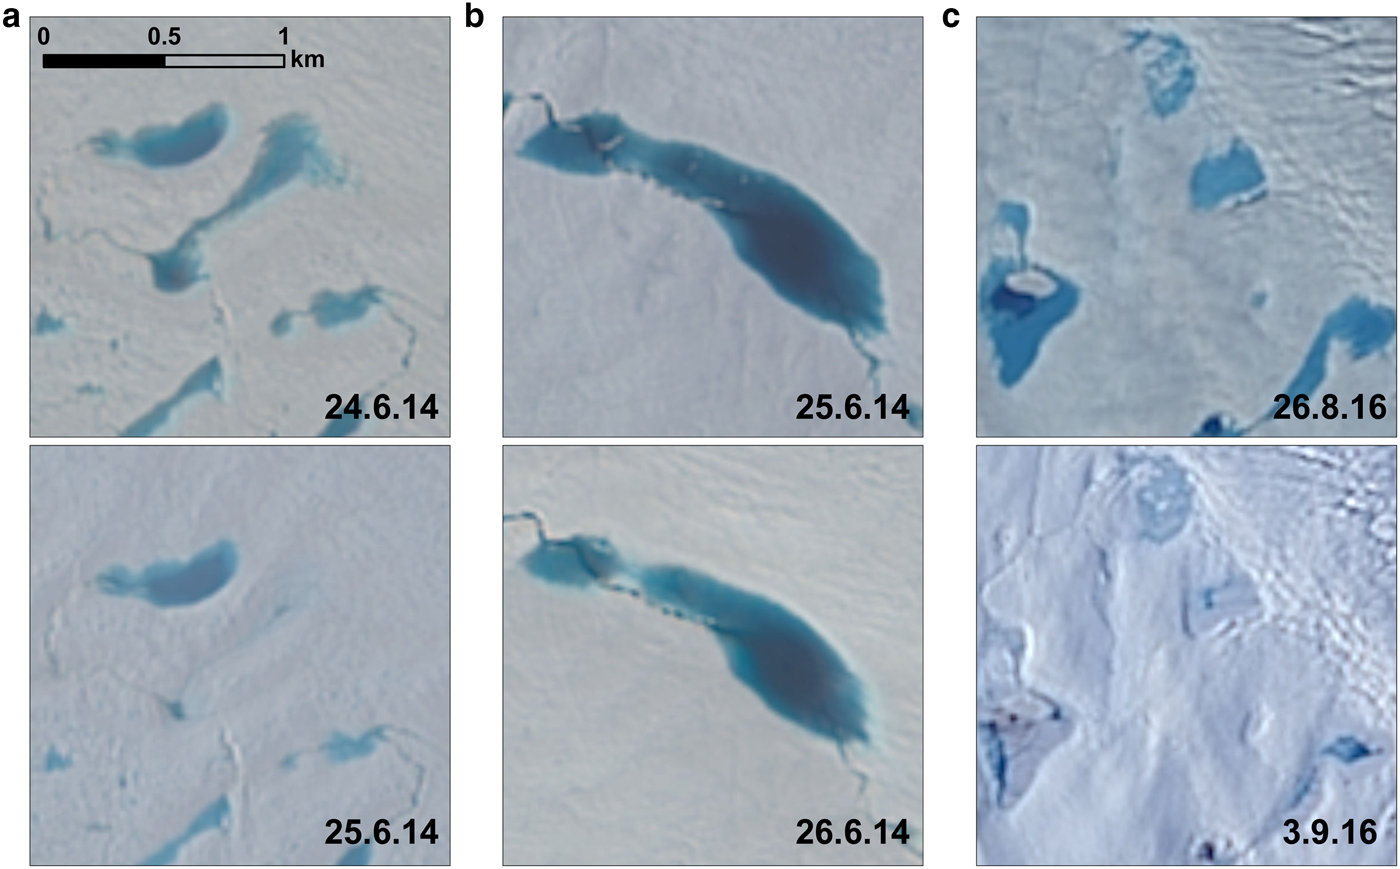
Fig. 6. Examples of lake drainage and burial/freeze-over events. Lake locations are indicated in Figure 1. (a) Lake A on 24 and 25 June 2014, before and after the rapid lake drainage event is shown in Figure 7a. (b) Lake B on 25 and 26 June 2014, during the rapid lake drainage event, is shown in Figure 7b. (c) A group of lakes (C) that become buried by snow and ice between 26 August and 3 September 2016.

Fig. 7. Development and drainage of lakes (a) A, and (b) B, from 2014–16. In 2014, Lakes A and B drain ‘rapidly’, with Lake A losing 96% of its volume in one day and Lake B losing 30% of its volume 1 day, followed by a further 61% of its peak volume over the following day. Lakes A and B both drain ‘slowly’ in 2015 and 2016.
Comparison of lakes on floating ice with those on grounded ice
Compared with SGLs on the floating tongue (Fig. 8), those on the grounded ice have a larger mean area of 0.140 km2 (Std dev.: 0.228 km2) and a larger median area of 0.025 km2 (Fig. 9). In contrast, SGLs on the floating tongue have a mean area of 0.025 km2 (Std dev.: 0.033 km2) and a median area of 0.013 km2 (18% and 52% of the values for grounded SGLs, respectively). SGLs on the grounded ice also reach a much higher maximum area (1.329 km2) than those on the floating tongue (0.277 km2).
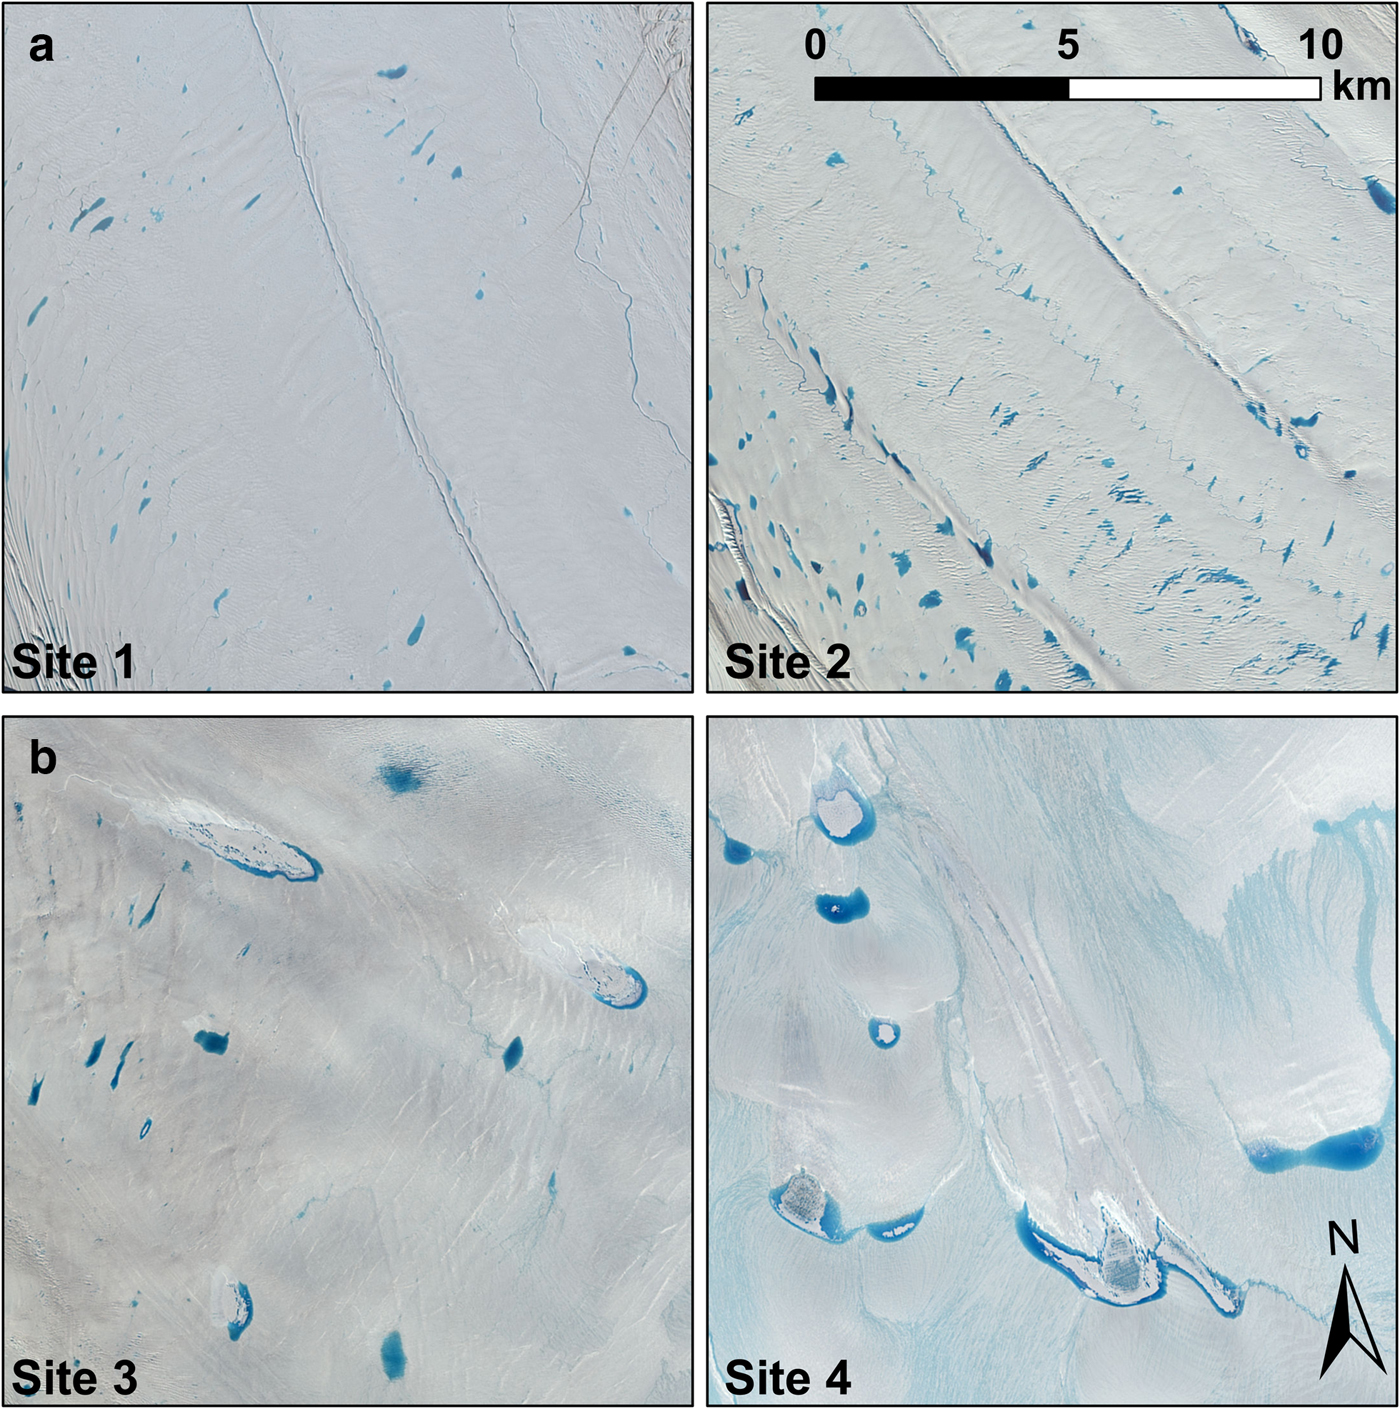
Fig. 8. A comparison of SGLs on the (a) floating tongue (Sites 1 and 2) and (b) grounded region (Sites 3 and 4) of Petermann Glacier in pan-sharpened OLI images. Sites 1–4 are located at increasingly up-glacier positions, as indicated in Figure 1, and the images were captured on 27 June 2014 for Site 1, and 30 June 2014 for Sites 2–4.
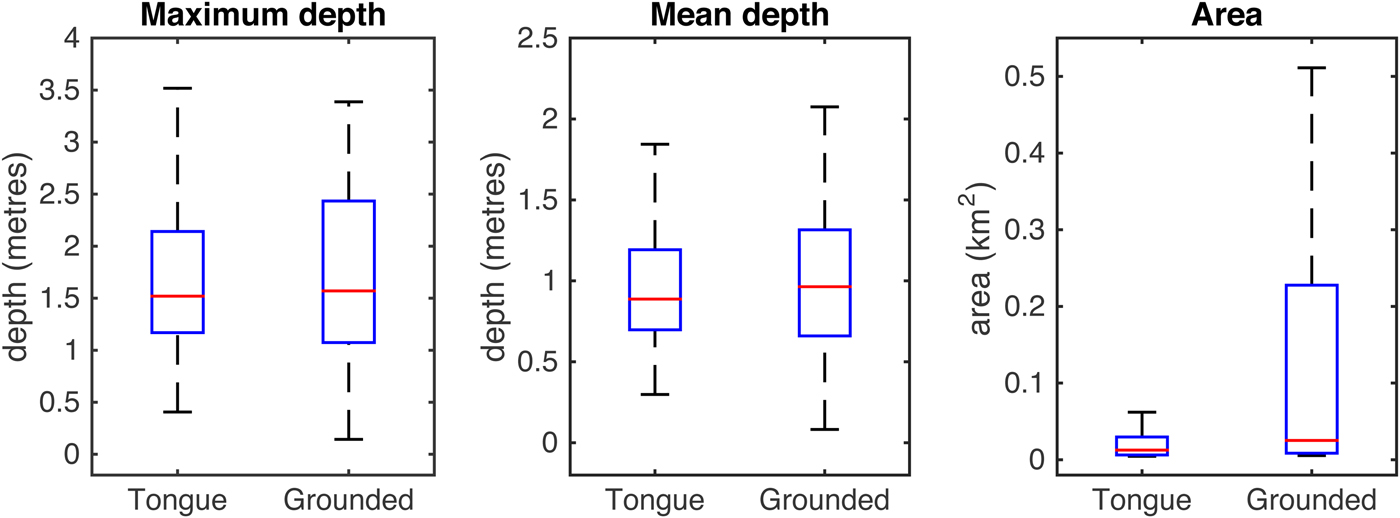
Fig. 9. Box plots of maximum depth, mean depth and area of SGLs at two sites on Petermann's floating tongue (1 and 2, Fig. 1) and two sites on the grounded ice (3 and 4, Fig. 1). On each box, the red mark is the median and the edges of the box are the 25th and 75th percentiles (q1 and q3, respectively). The length of the whiskers (dashed lines) are equal to q3 + 1.5(q3–q1). The measurements were made using OLI images from 27 June 2014 (Site 1) and 30 June 2014 (Sites 2–4) that are shown in Figure 8.
SGLs on the grounded ice do not exhibit a large difference in depth characteristics compared with those on the floating tongue (Fig. 9). SGLs on the grounded ice are generally only slightly deeper, with a mean depth of 0.99 m, compared with 0.98 m on the floating ice. SGLs on the grounded ice also have a higher spread of depth values, with Std dev. of 0.86 m and 0.49 m for maximum and mean depth, compared with 0.72 m and 0.40 m, respectively, on the floating ice.
DISCUSSION
Intra- and interseasonal evolution of meltwater features on the floating tongue (2014–16)
We observe interseasonal variations in all the lake-related statistics that we calculate; TLN, TLA, TLV and MLD (Fig. 3 and Fig. S1), but, as with previous studies of SGLs on grounded ice (Liang and others, Reference Liang2012; Leeson and others, Reference Leeson2013), we observe no clear interseasonal relationship between our calculated SGL statistics and air temperature. Strong interseasonal variations linked to air temperature are especially unlikely at low-elevation sites such as this, close to the terminus, where the melt and surface conditions necessary for ponding are likely met in both warm and cold years (Liang and others, Reference Liang2012), including all years in our study period. Further, it is likely that the lake basins fill to their maximum capacity in both warmer and cooler melt seasons, meaning that much of the extra meltwater produced in warmer years simply drains from the tongue, rather than increasing the volumes of SGLs.
The rapid development of SGLs once mean temperatures reach 0 °C in each melt season portrays a high sensitivity to small changes in surface air temperature beyond a critical temperature threshold (Bartholomew and others, Reference Bartholomew2010). The rapid growth in TLV (Fig. 3) and TLA (Fig. S1) is further facilitated by the positive feedback between surface melting and lake growth associated with the low albedo of lake water compared with the surrounding ice/snow; a process which has been observed to enhance ablation <135% on the GrIS (Tedesco and others, Reference Tedesco2012). Finally, as could be expected, SGLs begin to develop later in the melt season than has been previously observed on warmer, lower latitude glaciers of the GrIS. For example, SGLs began to develop as early as May in the Paakitsoq region (~69°N) in 2001 (McMillan and others, Reference McMillan, Nienow, Shepherd, Benham and Sole2007) and at Russell Glacier (~67°N) in 2007–09 (Johansson and others, Reference Johansson, Jansson and Brown2013).
From mid-late June until late June/early July, there is a decrease in TLN despite a continued increase in TLV (Fig. 3). The accompanying increase in MLD suggests that this occurs partly because multiple SGLs coalesce into fewer deeper, larger SGLs and partly because some lakes completely drain while others increase in volume.
There are a few possible explanations for the overall decline of TLN, TLV and TLA from mid-late July, which shows no clear relationship with temperature. First, the concurrent relatively stable nature of MLD suggests that many SGLs drain rapidly and completely, likely by hydrofracture (i.e. as slow/partial drainage would be associated with a decline in MLD). Though, notably, the stability of MLD alongside a decrease in TLN suggests that there is not a relationship between the depth of a lake on the tongue and its tendency to rapidly drain. Second, the meltwater plume (Fig. 5) suggests the central river likely efficiently evacuates meltwater over the ice tongue front, thereby reducing TLV in the latter part of the melt season. For example, Bell and others (Reference Bell2017) showed that a similar river had an important role in exporting meltwater from the Nansen Ice Shelf, Antarctica.
The increased spatial coverage of SGLs closer to the grounding line in late June and early July (Fig. S2), while overall TLN, TLA and TLV decline, can partly also be explained by the shift in peak volume of meltwater runoff from closer to the terminus towards the grounding line over a similar period (Fig. 2). Additionally, it can be partly explained by the inflow of surface meltwater from the up-glacier grounded ice, as surface melting in higher-elevation areas likely only commences in the mid-late melt season once air temperatures are sufficiently high. Similar observations of meltwater from up-glacier areas flooding floating portions have been made on the Nivlisen (Kingslake and others, Reference Kingslake, Ng and Sole2015) and Roi Baudouin ice shelves (Lenaerts and others, Reference Lenaerts2016). We, therefore, suggest that surface melting on Petermann's grounded ice forms an important contribution to the surface hydrology of its floating tongue.
Individual lake development and drainage
Our observations of rapid (i.e. <48 h) lake drainage on Petermann's floating tongue (Figs 6a and b, and 7) suggest that SGLs likely drain vertically by hydrofracture, as previously discussed. The rapid drainage of Lakes A and B in 2014, but not 2015 and 2016 (Fig. 7) may be explained by the substantially higher peak lake volumes in 2014 (~3× that of 2015, and ~2× that of 2016 for Lake A, and ~4× that of 2015 and ~×2 that of 2016 for Lake B) (Weertman, Reference Weertman1973; van der Veen, Reference van der Veen1998, Reference van der Veen2007; Alley and others, Reference Alley, Dupont, Parizek and Anandakrishnan2005).
Slow drainage events (e.g. Lakes A and B in 2015 and 2016), and/or the freeze over/burial of some lakes at the end of the season (e.g. Fig. 6c), on Petermann's tongue suggest that the preconditions for hydrofracture (e.g. the presence of a fracture (Das and others, Reference Das2008) or sufficient lake volume (Alley and others, Reference Alley, Dupont, Parizek and Anandakrishnan2005; van der Veen, Reference van der Veen2007; Arnold and others, Reference Arnold, Banwell and Willis2014)) may not exist for some SGLs. Slow lake drainage events by surface overflow have been observed elsewhere on both grounded ice of the GrIS (e.g. Tedesco and others, Reference Tedesco2013; Poinar and others, Reference Poinar2015) and floating ice of the AIS (e.g. Langley and others, Reference Langley, Leeson, Stokes and Jamieson2016). And likewise, the freeze-over and/or burial-by-snow of many SGLs is also common elsewhere in areas such as East Antarctica (e.g. Langley and others, Reference Langley, Leeson, Stokes and Jamieson2016) and higher-elevation regions of the GrIS (e.g. Koenig and others, Reference Koenig2015; Poinar and others, Reference Poinar2015). It is unclear whether these lakes on Petermann freeze-through or remain as englacial features, but in any case, the existence of such storage features limits further meltwater contribution to surface streams and lakes. Latent heat release from any freezing may affect the energy balance of the upper layers of snow/firn/ice (e.g. Humphrey and others, Reference Humphrey, Harper and Pfeffer2012).
Comparison of lakes on floating ice with those on grounded ice
The lower mean and maximum areas of SGLs on the floating tongue, compared with those on the grounded ice (Fig. 9), can primarily be explained by the various processes that govern each set of lakes’ formation. Meltwater on the tongue appears to pond in densely-spaced flow stripes, crevasses and surface undulations that form in response to ice flow, flexure and the ice crossing the grounding line, as previously observed on Antarctic ice shelves (e.g. McGrath and others, Reference McGrath2012; Banwell and others, Reference Banwell2014). This pattern of lake formation is particularly apparent on the floating ice close to the grounding line (Fig. 8a). Also, lake volumes on the tongue are relatively small because of the small catchment areas of each lake, due to the low gradient of the tongue. In contrast, meltwater on the grounded ice largely ponds in less-densely spaced, larger depressions (Fig. 8b) that likely reflect bedrock topography (Echelmeyer and others, Reference Echelmeyer, Clarke and Harrison1991; Sergienko, Reference Sergienko2013). Here, catchment areas are also larger, like those observed in other grounded regions of the GrIS (e.g. Banwell and others, Reference Banwell2014; Poinar and others, Reference Poinar2015).
CONCLUSION
Focusing on three melt seasons, 2014, 2015 and 2016, we present the first quantitative study of SGL characteristics on a floating ice tongue in Greenland. We take advantage of the narrower bands and higher acquisition rate of Landsat 8 OLI compared with its predecessor, Landsat 7 ETM+, which allows us to constrain spatial and temporal variations in surface hydrology on Petermann Glacier to a daily temporal-resolution on occasions.
We show that SGLs form across Petermann's floating ice tongue during each melt season. In each year, SGLs develop in early-mid June as air temperatures begin to rise, and the total number of SGLs and their total volumes peak in late June/early July. Despite sustained high temperatures through July and August in each year, the total meltwater storage in SGLs falls during this time. We suggest that this may be due to both meltwater transportation across the tongue and into the ocean by a river, and due to lake drainage events on the tongue. However, we note that as the MLD stays relatively constant during this time, a large proportion of the lakes that drain must be doing so rapidly and completely, likely by hydrofracture. (NB. in this study we only actually observe two rapid lake drainage events.) Many other SGLs drain more slowly (either completely or partially) and the remainder do not drain at all, but instead become covered by snow/ice. Lakes on the tongue have a mean area ~20% of those on the grounded ice and exhibit lower variability in maximum and mean depth, differences which are due to the contrasting formation processes of lakes in each environment.
Based on previous studies of SGLs on Antarctic ice shelves, the presence of SGLs on Petermann's floating tongue may be indicative of its vulnerability to instability and potential collapse (e.g. Scambos and others, Reference Scambos, Hulbe, Fahnestock and Bohlander2000, Reference Scambos, Hulbe, Fahnestock, Domack, Burnett, Leventer, Conley, Kirby and Bindschadler2003; Banwell and others, Reference Banwell, MacAyeal and Sergienko2013). We find lakes to cover <2.8% of the total surface area of Petermann's tongue, compared with the 5.3% of Larsen B's area that was covered prior to its collapse in 2002 (Banwell and others, Reference Banwell2014). Predicted future rises in air temperature (Kirtman and others, Reference Kirtman and Strocker2013) could enable a higher density of lakes, with larger volumes, to develop from earlier in the season, possibly leading to increased ice tongue instability. However, the decline of SGLs through July and August in each year studied, despite sustained high temperatures during those months, suggests that evacuation of meltwater from the tongue (e.g. by a river cf. Bell and others, Reference Bell2017) may limit the total volumes of meltwater storage on Petermann's floating tongue, thereby mitigating the risk of instability and break-up.
SUPPLEMENTARY MATERIAL
The supplementary material for this article can be found at https://doi.org/10.1017/aog.2018.9
ACKNOWLEDGEMENTS
GJM acknowledges support from a NASA Earth and Space Science Fellowship (NNX15AN44H), and AFB acknowledges support from a Leverhulme/Newton Trust Early Career Fellowship. This work was also supported by U.S. National Science Foundation grant PLR-1443126. Peter Langen is thanked for supplying DMI temperature and runoff data. Neil Arnold and Andrew Williamson are thanked for their early support with implementing the lake area and depth algorithms. We are also very grateful to the Editor, Dirk van As and two reviewers (Amber Leeson and anonymous) whose helpful comments enabled us to considerably improve the paper.


 Open access