


1. Introduction
The Antarctic ice sheet is by far the largest land ice mass on the present-day Earth, and its volume amounts to ~56.6ms.l.e. (metres sea-level equivalent) (Reference Lemke and SolomonLemke and others, 2007). The current mass balance of the ice sheet is most likely negative with an accelerating trend, even though the uncertainty is still significant (Reference Lemke and SolomonLemke and others, 2007; Reference Rignot, Velicogna, Van den Broeke, Monaghan and LenaertsRignot and others, 2011; Reference Van den Broeke, Bamber, Lenaerts and RignotVan den Broeke and others, 2011; Reference Zwally and GiovinettoZwally and Giovinetto, 2011). Owing to the very low surface temperatures, the ice sheet is not very susceptible to surface melting, even under moderate global warming scenarios. However, recent observations (e.g. Reference Shepherd, Wingham, Mansley and CorrShepherd and others, 2001; Reference Joughin, Rignot, Rosanova, Lucchitta and BohlanderJoughin and others, 2003; Reference Rignot, Casassa, Gogineni, Krabill, Rivera and ThomasRignot and others, 2004) have led to strong concerns that ice-dynamical processes (loss of buttressing from ice shelves, speed-up of ice streams and outlet glaciers) may boost the mass loss and thus lead to an additional contribution to sea-level rise. The limited understanding of such processes was explicitly highlighted in the Fourth Assessment Report (AR4) of the United Nations Intergovernmental Panel on Climate Change (IPCC): ‘Dynamical processes related to ice flow not included in current models but suggested by recent observations could increase the vulnerability of the ice sheets to warming, increasing future sea level rise. Understanding of these processes is limited and there is no consensus on their magnitude’ (Reference SolomonSolomon and others, 2007).
The scientific community has reacted to the need for improved modelling of ice-sheet dynamics, including their ice shelves, ice streams and outlet glaciers. Coordinated research projects have been launched, such as the Europeanled ice2sea programme, funded by the European Union Framework-7 scheme (http://www.ice2sea.eu/), and the US-led SeaRISE effort (Sea-level Response to Ice Sheet Evolution; http://tinyurl.com/srise-lanl, http://tinyurl.com/srise-umt). The latter is an already well-advanced, community-organized effort to estimate the likely range of ice-sheet contributions to sea-level rise over the next few hundred years.
The Japanese ice-sheet modelling community contributes to both ice2sea and SeaRISE as part of several funded research projects. In this study, we present results obtained with the model SICOPOLIS (SImulation COde for POLythermal Ice Sheets) for the Antarctic ice sheet within the framework of the SeaRISE effort. To this end, SICOPOLIS was complemented by an ice-shelf module. We present a palaeoclimatic spin-up that provides reasonable initial conditions for future-climate runs. Based on that, we conduct a series of future-climate scenarios specified by SeaRISE in which the climatic conditions at the ice surface are kept at their present-day conditions, but increased sub-ice-shelf melting, as a consequence of increased ocean temperatures, is assumed. The impact of these forcings on the mass balance of the ice sheet over the next 500 years is discussed.
2. Ice-Sheet Model Sicopolis
SICOPOLIS simulates the large-scale dynamics and thermodynamics (ice extent, thickness, velocity, temperature, water content and age) of ice sheets three-dimensionally and as a function of time (Reference GreveGreve, 1997; for the latest version, 3.0, used here see http://sicopolis.greveweb.net/). It is based on the shallow-ice approximation (SIA) for grounded ice (Reference HutterHutter, 1983; Reference MorlandMorland, 1984), the shallow-shelf approximation (SSA) for floating ice (Reference Morland, Van der Veen and OerlemansMorland, 1987; Reference MacAyealMacAyeal, 1989; Reference Weis, Greve and HutterWeis and others, 1999) and the rheology of an incompressible, heat-conducting, power-law fluid.
In this study, we use the regularized Glen flow law for the ice fluidity (inverse viscosity), 1/η, in the form (Reference Greve and BlatterGreve and Blatter, 2009)

where T′ is the temperature relative to pressure melting (more precisely, following Reference Greve and BlatterGreve and Blatter (2009), T′ = T − T
m + T
0, where T is the ice temperature (either K or °C), T
m = T
0
− βp the pressure (p)-dependent melting point, β the Clausius–Clapeyron gradient and T
0 the melting temperature at standard atmospheric pressure). A(T′) is the rate factor, 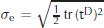 the effective stress (square root of the second invariant of the deviatoric stress tensor, tD), f (σ
e) the creep function and E the flow enhancement factor. The rate factor and creep function are expressed in the form of an Arrhenius law,
the effective stress (square root of the second invariant of the deviatoric stress tensor, tD), f (σ
e) the creep function and E the flow enhancement factor. The rate factor and creep function are expressed in the form of an Arrhenius law,

(with A 0 a pre-exponential constant, Q the activation energy, R the universal gas constant and T′ in K) and a power law with additional constant term,

with n the stress exponent and σ 0 the residual stress. The values for the several parameters largely follow the recent recommendations by Reference Cuffey and PatersonCuffey and Paterson (2010) and are listed, among others, in Table 1.
Table 1. Physical parameters used for the simulations of this study

A particular feature of the model thermodynamics is that it distinguishes between cold ice with a temperature below the pressure-melting point and temperate ice with a temperature at the pressure-melting point, the latter being considered as a binary mixture of ice and small amounts of water. In temperate ice, following Reference Lliboutry and DuvalLliboutry and Duval (1985), the temperature-dependent rate factor, A(T′), is replaced by a rate factor depending on the water content, W,

The interface that separates cold and temperate ice is tracked through the use of Stefan-type energy flux and mass flux matching conditions (this procedure is referred to as the ‘polythermal mode’).
Basal sliding under grounded ice, v b, is described by a Weertman-type sliding law with sub-melt sliding of the form applied to Austfonna ice cap, Svalbard, by Reference Dunse, Greve, Schuler and HagenDunse and others (2011) (based on earlier work by, e.g., Reference WeertmanWeertman, 1964; Reference LliboutryLliboutry, 1968; Reference BindschadlerBindschadler, 1983; Reference Hindmarsh and Le MeurHindmarsh and Le Meur, 2001),

where τ b is the basal drag (shear stress), N b the effective pressure and T′b the basal temperature relative to pressure melting (in °C, always ≤0°C). In the SIA, the effective pressure, N b, is equal to the hydrostatic pressure, P b = ρgH (where ρ is the density of ice, g the gravitational acceleration and H the ice thickness), minus the water pressure, P w. The latter is assumed to be equal to the pressure of a sea-water column of density ρ sw and thickness H w = z sl − b, where z sl is the mean sea level and b the ice base topography. This yields

In order to avoid the N b → 0 singularity, when grounded ice becomes nearly floating close to the grounding line, N b is constrained to be ≥(0.2×P b). The basal drag, τ b, is equal to the basal pressure times the surface slope,

where h is the surface elevation and grad the gradient operator in the horizontal plane (Reference Greve and BlatterGreve and Blatter, 2009). The minus sign in Eqn (5) indicates that the direction of basal sliding is anti-parallel to the basal drag. The parameters have the values C b = 11.2ma–1 Pa–1 (sliding coefficient), p = 3, q = 2 (sliding exponents) and γ = 1°C (sub-melt-sliding parameter).
Isostatic depression and rebound of the lithosphere due to changing ice load is modelled by the elastic-lithosphere– relaxed-asthenosphere (ELRA) approach (Reference Le Meur and HuybrechtsLe Meur and Huybrechts, 1996; Reference Greve, Straughan, Greve, Ehrentraut and WangGreve, 2001).
The shallow-shelf module is a new feature of version 3.0 of SICOPOLIS. Its core is the solver for the nonlinear elliptical differential equations for the horizontal velocities, vx and vy (Reference Greve and BlatterGreve and Blatter, 2009, eqn (6.55); note that in the SSA vx and vy are constant over depth). This is done by discretizing the equations by central differences on the regular grid of SICOPOLIS, solving the resulting system of linear equations by the biconjugate gradient method with the Library of Iterative Solvers for Linear Systems (Lis, http://www.ssisc.org/lis/), and nonlinear iterations between the horizontal velocities and the depth-integrated viscosity with a relaxation scheme. The position of the grounding line is determined by checking the floating condition,

(where z l is the topography of the lithosphere surface), and the inflow into regions of floating ice results from the SIA solution for the horizontal velocity field of adjacent grounded ice. A more sophisticated treatment of the sheet/shelf transition zone (e.g. Reference Pollard, DeConto, Hambrey, Christoffersen, Glasser and HubbardPollard and DeConto, 2007, Reference Pollard and DeConto2009) will be implemented in future work. The calving front is exposed to the hydrostatic pressure of the adjacent sea water, and its position is determined by the simple, implicit calving criterion that floating ice calves if its thickness is smaller than a threshold value of 50 m. This is considerably thinner than the thickness of the major present-day Antarctic ice shelves; however, with a higher threshold of 200–250m many of the smaller ice shelves (e.g. Riiser-Larsen, Shackleton) tend to erode during a simulation, and new ice shelves are largely prevented from forming. Sub-ice-shelf melting, M, is parameterized by a method adopted from the GRISLI model (GRenoble model for Ice Shelves and Land Ice; Reference Ritz, Rommelaere and DumasRitz and others, 2001):

For the three parameters, we use the standard values M gl = 2 mi.eq. a–1, M cs = 0.2mi.eq. a–1 and M ao = 10mi.eq. a–1 (m i.eq. indicates metres ice equivalent). For M gl and M cs, this is two-thirds of the values suggested in GRISLI (personal communication from A. Quiquet, 2010). The high value of M ao prevents ice shelves from extending over the abyssal ocean, where they are unstable, due to the absence of embayments or islands/shoals that can serve as pinning points.
The model domain covers the entire area of Antarctica and the surrounding oceans, projected on a polar stereographic grid with standard parallel 71° S and central meridian 0° E. Distortions due to this projection are accounted for as metric coefficients in all model equations, except for the above-mentioned SSA equations for the horizontal velocities. The present geometry (surface and basal topographies, ice thickness, equilibrated bedrock elevation, grounded vs floating ice) is derived from the ‘Antarctica Developmental Data Set’ (Antarctica 5km dev1.0.nc) provided on the SeaRISE website, resampled to a horizontal resolution of 20 km. In the vertical direction, sigma coordinates are used; the cold ice column, the temperate ice layer (if present) and the thermal boundary layer of the lithosphere are mapped separately to [0, 1] intervals. The cold ice column is discretized by 81 gridpoints (concentrated towards the base), and the temperate ice and lithosphere layers are discretized each by 11 equidistant gridpoints. Time-steps are 0.05–0.5 years for the topography and velocity, and 0.25–2 years for the thermodynamics.
The ‘vicinity of the grounding line’ in Eqn (9) refers to floating-ice gridpoints that have a grounded-ice neighbour. In addition, grounded-ice gridpoints with a floating-ice or ocean neighbour are assigned a basal melting rate, M, averaged over the gridpoint itself and the four neighbours,

where r gr is the ratio of grounded-ice points among the five points (r gr =(number of grounded-ice points)/5) and M gr is the computed basal melting rate of the central grounded-ice point. Consequently, the ‘vicinity of the grounding line’ (influence of the prescribed parameter, M gl) extends over twice the horizontal resolution, i.e. 40 km. Due to this rather large, resolution-dependent zone of influence, we refrain from choosing a value of the order of tens of metres per year for M gl, even though such melting rates were measured near deep grounding lines (Reference Rignot and JacobsRignot and Jacobs, 2002).
3. SeaRise Experiments
3.1. Palaeoclimatic spin-up
In order to obtain a suitable present-day configuration of the Antarctic ice sheet, it is desirable to carry out a palaeoclimatic spin-up over at least a full glacial cycle. However, initial testing revealed that it is very difficult to reproduce the observed geometry (in particular the distribution of grounded vs floating ice) by an unconstrained, freely evolving simulation. For this reason, we carry out the spin-up simulation in four steps:
-
1. An initial relaxation run with freely evolving grounded-ice topography over 100 years, starting from the present-day geometry and isothermal conditions at −10°C everywhere, in order to avoid spurious noise in the computed velocity field (Reference CalovCalov, 1994). The grounding lines and floating ice topographies are kept fixed. The surface temperature and the sea level are those of today (see below); the surface mass balance is set to zero.
-
2. A steady-state run from 250 ka bp (here the notation ka bp means thousand calendar years before present) until 125 ka Bp, with the entire topography kept fixed over time. The surface temperature is that of 125 ka Bp; the surface mass balance is unspecified (due to the fixed topography).
-
3. A transient run from 125 ka bp until today with the entire topography kept fixed over time, in order to enforce a good fit between the simulated and observed present-day topographies. The surface temperature varies over time (see below); the surface mass balance is unspecified.
-
4. A transient run over 20 years with unconstrained evolution of the ice topography, in order to avoid transition shocks at the beginning of the subsequent future-climate experiments. The climatic forcing (surface temperature, surface mass balance) and the sea level are kept steady at today’s conditions.
Apart from the ‘frozen’ geometry of the ice sheet in runs 2 and 3, the runs are conducted with the forcings suggested by SeaRISE. The mean annual and mean summer surface temperatures, T ma and T ms, respectively, are decomposed into present-day spatial distributions plus a purely time-dependent anomaly, ΔT (t ),

where t is time and φ geographical latitude. The present-day parameterizations are taken from Reference Fortuin and OerlemansFortuin and Oerlemans (1990),


where temperatures are in °C, surface elevations in ma.s.l. and latitudes in ° S (counted positive). The time-dependent anomaly, ΔT (t ), results from the Vostok δD record converted to temperature with the relation of Reference PetitPetit and others (1999).
Precipitation, surface melting and sea-level forcings are not required for runs 2 and 3, due to the ‘frozen’ geometry approach. In fact, in these runs the net surface mass balance (precipitation minus surface melting) is determined by the dynamical ice flow via the continuity equation, as a consequence of requiring the geometry to be unchanged. For run 4, precipitation is equated to the surface accumulation data of Reference Arthern, Winebrenner and VaughanArthern and others (2006), and surface melting is parameterized by Reference ReehReeh’s (1991) positive degree-day (PDD) method, supplemented by the semi-analytical solution for the PDD integral by Reference Calov and GreveCalov and Greve (2005). The PDD factors are (in ice equivalents) = 8mmd–1 °C–1 for β ice ice melt and β snow = 3 mmd–1 °C–1 for snowmelt (Reference Ritz, Rommelaere and DumasRitz and others, 2001). Furthermore, the standard deviation of short-term, statistical air temperature fluctuations is 5°C, and the saturation factor for the formation of superimposed ice is chosen as P max = 0.6 (Reference ReehReeh, 1991).
As for the geothermal heat flux, the SeaRISE ‘Antarctica Developmental Data Set’ provides two different distributions, by Reference Shapiro and RitzwollerShapiro and Ritzwoller (2004) and by Reference Fox Maule, Purucker, Olsen and MosegaardFox Maule and others (2005). We conduct the spin-up run with the Reference Shapiro and RitzwollerShapiro and Ritzwoller (2004) distribution, and, following a recommendation from the SeaRISE website, heat flux values are capped at 70 mWm–2.
The simulated present-day configuration of the ice sheet (result of run 4) is used as the initial condition for the future-climate experiments described in the following.
3.2. Future-climate experiments
For the future-climate experiments, we use the following set of SeaRISE experiments:
Experiment CTL: Constant climate control run; beginning at present (more precisely, the epoch 2004-1-1 0:00, corresponding to t = 0) and running for 500 years holding the climate steady to the present climate. We carry out this run twice, with the surface accumulation data by (1) Reference Arthern, Winebrenner and VaughanArthern and others (2006) and (2) Reference Van de Berg, Van den Broeke, Reijmer and Van MeijgaardVan de Berg and others (2006) (both provided in the ‘Antarctica Developmental Data Set’ by SeaRISE).
Experiment E1a: Constant climate forcing running for 500 years, surface accumulation by Reference Arthern, Winebrenner and VaughanArthern and others (2006), uniform sub-ice-shelf melting rate of M gl = M cs = M ao=2mi.eq. a–1 (instead of the parameters given after Eqn (9)).
Experiment E1b: Constant climate forcing running for 500 years, surface accumulation by Reference Arthern, Winebrenner and VaughanArthern and others (2006), uniform sub-ice-shelf melting rate of M gl = M cs = M ao = 20mi.eq. a–1 (instead of the parameters given after Eqn (9)).
Experiment E1c: Constant climate forcing running for 500 years, surface accumulation by Reference Arthern, Winebrenner and VaughanArthern and others (2006), uniform sub-ice-shelf melting rate of M gl = M cs = M ao = 200mi.eq. a–1 (instead of the parameters given after Eqn (9)).
Experiment E1z: Constant climate forcing running for 500 years, surface accumulation by Reference Arthern, Winebrenner and VaughanArthern and others (2006), zero sub-ice-shelf melting rate M gl = M cs = M ao = 0 mi.eq. a – 1 (instead of the parameters given after Eqn (9)).
For all experiments, surface melting is parameterized by the PDD method (Section 3.1), basal melting at grounded-ice gridpoints with a floating-ice or ocean neighbour is computed by the averaging scheme of Eqn (10), and the geothermal heat flux is that of Reference Shapiro and RitzwollerShapiro and Ritzwoller (2004), capped at 70 mWm–2 (same as used for the palaeoclimatic spin-up; see above).
The more recently defined ‘2011 Sensitivity Experiments’ of the SeaRISE group, including investigations on changes of the climate at the upper surface and changes of sliding at the subglacial interface, will be considered in future work.
4. Results and Discussion
The results of the palaeoclimatic spin-up run (Section 3.1) for the present are shown in Figure 1. Due to the fixed-topography approach, the surface topography (Fig. 1a) is of course very similar to the observed one (not shown). Small differences of the order of tens of metres arise as a consequence of the initial 100 year relaxation and the final 20 year run with freely evolving topography. The surface velocity (Fig. 1b) shows the expected distribution with small velocities (<10ma–1) in the interior, a general speed-up towards the coast and the largest velocities of 1000ma–1 and more for the ice shelves, while the limitations of our approach (20 km resolution, fixed-topography spin-up with short transient run at the end) do not allow us to capture all the fine structure adequately.

Fig. 1. Present-day configuration of the Antarctic ice sheet computed by the palaeoclimatic spin-up. (a) Surface topography (kma.s.l.; contour spacing 250 m), (b) surface velocity (ma–1) and (c) basal temperature (°C, relative to the pressure-melting point).
Basal temperatures (Fig. 1c) are at the pressure-melting point in large areas in West Antarctica, while limited temperate base areas are found in East Antarctica in George V Land, Wilkes Land and several other places near the coast. At the deep ice-core sites Vostok, Dome C, Dome F, Kohnen and Byrd, the spin-up run produces basal temperatures of −11.5, −11.6, −18.5, −11.4 and −2.0°C (pressure-melting point), respectively. Except for Byrd, these temperatures are significantly below the pressure -melting point, while the observed temperatures all reach the pressure-melting point (Reference PetitPetit and others, 1999; Reference MotoyamaMotoyama, 2007; Reference ParreninParrenin and others, 2007; Reference Wilhelms, Sheldon, Hamann, Kipfstuhl and KuhsWilhelms and others, 2007).
This discrepancy is probably due to shortcomings of the applied geothermal heat flux distribution by Reference Shapiro and RitzwollerShapiro and Ritzwoller (2004), which gives values in the range 45– 50 mWm–2 at Dome C, Dome F and Vostok. This is probably not sufficient to form a temperate base (Reference Llubes, Lanseau and RémyLlubes and others, 2006, fig. 3a). Reference Seddik, Greve, Zwinger and PlacidiSeddik and others (2011) used a higher geothermal heat flux of 60 mWm–2 to produce a realistic borehole temperature in the vicinity of Dome F. Therefore, larger geothermal heat fluxes would be needed to reproduce these observed melting conditions in East Antarctica. By contrast, the base of the West Antarctic Byrd ice core, which receives a geothermal heat flux of 70 mWm–2 in our simulation, reaches the melting point. A second possible reason for the under-prediction of basal temperatures is the fixed-topography approach of the spin-up run. Compared to the real, evolving Antarctic ice sheet, our simplified approach certainly influences the englacial heat transport (by both advection and conduction), to some extent, which affects basal temperatures.
Figure 2 shows the evolution of the grounded-ice volume for the future-climate control run with the two different accumulation datasets (Section 3.2). In both cases, the ice volume increases by >1ms.l.e. over 500 years, and the accumulation data of Reference Van de Berg, Van den Broeke, Reijmer and Van MeijgaardVan de Berg and others (2006) produce ~0.32ms.l.e. more ice than those of Reference Arthern, Winebrenner and VaughanArthern and others (2006). The reason is that the former accumulation rates are relatively larger than the latter, particularly around the ice-sheet margin. By contrast, different geothermal flux settings (Reference Shapiro and RitzwollerShapiro and Ritzwoller, 2004 vs Reference Fox Maule, Purucker, Olsen and MosegaardFox Maule and others, 2005) cause only slight changes (not shown). In order to minimize the imbalance of the ice sheet in the future-climate control run, we discard the accumulation data of Reference Van de Berg, Van den Broeke, Reijmer and Van MeijgaardVan de Berg and others (2006) and use only those of Reference Arthern, Winebrenner and VaughanArthern and others (2006) for the future-climate simulations with different sub-ice-shelf melting rates (Section 3.2). The imbalance for the initial time (t = 0 in Fig. 2, corresponding to the year 2004) is ~2.5mms.l.e. a–1, which indicates that the drainage of the ice sheet is under-predicted (probably related to the under-predicted basal temperatures; see above).

Fig. 2. Simulated grounded ice volume, V, for experiment CTL (constant climate control run), carried out with the surface accumulation data of Reference Arthern, Winebrenner and VaughanArthern and others (2006) (solid curve) and Reference Van de Berg, Van den Broeke, Reijmer and Van MeijgaardVan de Berg and others (2006) (dashed curve). Note that t = 0 corresponds to the year 2004.
The results of the future-climate simulations with varied sub-ice-shelf melting rates are shown in Figures 3 and 4. As expected, the grounded-ice volume (Fig. 3, shown relative to the control run because of the imbalance discussed above) becomes smaller when the basal melting rates are higher. However, the effect is strongly nonlinear and diminishes with increasing melting rates. This agrees with the findings of Reference Huybrechts and De WoldeHuybrechts and De Wolde (1999) for a similar series of simulations with smaller basal melting rates of 0, 1,3, 5 and 10ma–1. The spread of ice volumes across all experiments (from the zero to the maximum melting case) is ~0.65ms.l.e. after 100 years and ~2.25ms.l.e. after 500 years. Excluding the most extreme experiment, E1c, with 200ma–1 basal melting and thus considering only the range 0–20ma–1 yields a spread of ~2.0ms.l.e. after 500 years. This agrees well with the spread of ~0.6×10⁶ km3 (~1.5ms.l.e.) reported by Reference Huybrechts and De WoldeHuybrechts and De Wolde (1999) (fig. 14) for the range 0–10ma–1. So we see a significant, but not catastrophic, impact of increased basal melting on ice-sheet decay.

Fig. 3. Simulated changes in grounded-ice volume, ΔV, relative to the control run, CTL, for experiments E1a (constant climate, sub-ice-shelf melting 2mi.eq. a–1), E1b (constant climate, sub-ice-shelf melting 20mi.eq. a–1), E1c (constant climate, sub-ice-shelf melting 200mi.eq. a–1) and E1z (constant climate, zero sub-ice-shelf melting). Surface accumulation by Reference Arthern, Winebrenner and VaughanArthern and others (2006). Note that t = 0 corresponds to the year 2004.

Fig. 4. Simulated ice area, A, relative to the control run, CTL, for experiments E1a (constant climate, sub-ice-shelf melting 2 mi.eq. a–1), E1b (constant climate, sub-ice-shelf melting 20mi.eq. a–1), E1c (constant climate, sub-ice-shelf melting 200mi.eq. a–1) and E1z (constant climate, zero sub-ice-shelf melting). (a) Grounded-ice area; (b) floating-ice area. Note that t = 0 corresponds to the year 2004.
Changes of the area of grounded and floating ice are shown in Figure 4. In the control run (basal melting according to Eqn (9)), the grounded-ice area decreases by ~0.25 × 10⁶ km2 (~2%) during the first 200 years, partly compensated by an increase in floating ice, and remains almost constant after that. In run E1a (2ma–1 basal melting everywhere), grounded ice evolves very similarly, due to the identical melting rates in the vicinity of the grounding line, whereas two-thirds of the floating ice disappear over 500 years, as a consequence of the ten times larger melting rate over the continental shelf. In the more extreme runs E1b and E1c (20 and 200ma–1 basal melting), today’s floating ice disappears even more strongly: for E1b most of it melts within 100 years, the remaining area stabilizing at ~0.15 × 10⁶ km2 (~10% of today’s value) due to a balance between inflow from the ice sheet and basal melting, and for E1c almost all floating ice disappears within a few years. This has a significant impact on the grounded-ice area, which, for both E1b and E1c, shrinks continuously over the entire period of 500 years, by which time the loss amounts to ~0.5 × 10⁶ km2 (~4%) relative to the control run.
In general, under the influence of high basal melting, the Ross and Antarctic Peninsula Ice Shelves decay faster than the Filchner–Ronne and Amery Ice Shelves. In the E1a experiment (2ma–1 basal melting), the Ross Ice Shelf loses >50% of its area by t = 250 years and has almost disappeared by t = 500 years, while the Amery Ice Shelf does not lose much of its area. The vulnerability of the Ross Ice Shelf results from the fact that it is surrounded by the Transantarctic Mountains, so that the incoming flux from the ice sheet is smaller than for other ice shelves. By contrast, the Amery Ice Shelf is largely stabilized against increased basal melting by the large inflow from Lambert Glacier, which is the world’s largest glacier.
The grounded-ice area is largest in run E1z (no basal melting), while the floating-ice area is largest in the control run (basal melting according to Eqn (9)). This is related to grounding-line migration. Since there is no basal melting in run E1z, the grounding lines can advance freely all around the ice sheet, so the grounded ice grows at the expense of the floating ice. By contrast, basal melting favours grounding-line retreat, so that in the control run floating ice grows at the expense of grounded ice. Even the floating ice area of run E1a (2ma–1 basal melting) is larger than that of run E1z (no basal melting) during the first ~80 years. However, later the retreat of the calving fronts due to basal-melt-induced thinning outweighs this effect, so the floating-ice area of run E1a becomes smaller than that of run E1z. For runs E1b and E1c (20 and 200ma–1 basal melting) basal melting is so large that the loss due to thinning-induced calving rapidly overcompensates the gain due to grounding-line retreat, and thus no initial increase of the floating-ice area is observed in the results.
5. Conclusion
A module for floating ice was added to the dynamic/ thermodynamic ice-sheet model SICOPOLIS. We have applied the new version of the model to the Antarctic ice sheet and carried out a palaeoclimatic spin-up, as well as a set of future-climate runs specified by the SeaRISE group. In the latter, the surface climate forcing was kept steady at present-day conditions, while the sub-ice-shelf melting rate was varied over a wide range. The simulations have revealed a significant but not catastrophic sensitivity of the ice sheet, the grounded-ice volume showing a spread from the zero to the maximum melting case of ~0.65ms.l.e. after 100 years and ~2.25ms.l.e. after 500 years.
Some shortcomings of this study must be noted. Due to computing time limitations, we did the simulations of this study at a horizontal resolution of 20 km. This resolution is unable to capture all of the fine structure in the vicinity of ice streams, that is important for the dynamics of the ice sheet as a whole. It is thus desirable to improve the resolution to at least 10 km. This will be the basis for our contribution to the SeaRISE community effort (in preparation). A second aspect is the current treatment of grounding-line dynamics. As explained in Section 2, the inflow into regions of floating ice results from the SIA solution for the horizontal flow field of adjacent grounded ice. A smoother way of dealing with this change of flow regimes would be to consider a transitional zone with shelfy-stream dynamics (SSA with additional basal drag; Reference MacAyealMacAyeal, 1989). Following findings by Reference SchoofSchoof (2007) and Reference Pollard and DeContoPollard and DeConto (2009), for the rather coarse resolutions typically applied in large-scale ice-sheet models the inflow should be corrected by imposing a mass flux constraint across the grounding line, which parameterizes ice velocities there as a function of local ice thickness and stresses. Further, the simplified parameterization of basal melting (Eqn (9)) that does not distinguish between different regions and types of ice shelves, as well as the calving criterion in the form of a simple threshold value for the ice thickness, leave room for improvements. These points will be considered in future work.
Acknowledgements
We thank R.A. Bindschadler, S. Nowicki and others for their efforts in the management of the SeaRISE project, J.V. Johnson and others for compiling and maintaining the SeaRISE datasets, A. Quiquet for information about the parameterization of sub-ice-shelf melting in the GRISLI model and D. Pollard for discussions about the grounding-line treatment. The comments of two anonymous reviewers and the scientific editor, D.M. Holland, helped considerably to improve the manuscript. This study was supported by a Grant-in-Aid for Scientific Research A (No. 22244058) from the Japan Society for the Promotion of Science (JSPS).



