

1. Introduction
Ice in ice sheets develops strong anisotropy during deformation due to intra-crystalline slip (Wenk and Christie, 1991; Reference AlleyAlley, 1992; Reference GowGow and others, 1997; Reference ThompsonThorsteinsson and others, 1997). Fabric evolution is particularly important when considering locations for ice-core drilling. In particular, we are concerned with lags between the fabric evolution and the stress evolution; such lags can result in unusual deformation patterns. For example, to model the age distribution in ice sheets to an increasing level of detail, the flow law used must account for the anisotropy. The ice-divide locations are likely to have changed in the past (Reference Anandakrishnan, Alley and WaddingtonAnandakrishnan and others, 1994; Reference Nereson, N. A., Raymond, Waddington and JacobelNereson and others, 1998; Reference Marshall and CuffeyMarshall and Cuffey, 2000). The resulting modification of the spatial distribution of stress may produce a fabric pattern different from the fabric expected to develop near a stationary divide. This change in fabric might alter the depth–age relationship by anomalous Thorsteinssonthinning of layers, and could potentially nucleate folds if adjoining layers with contrasting fabrics experience stress at unusual orientations ( and Waddington, 2002). Saddles can also be used as ice-core sites at high elevations (e.g. Reference Oeschger, U., B., W. and H.Oeschger and others, 1978; Holds-worth and Peake, 1985; Reference RaymondThompson and others, 1995), and ice flowing through a saddle may experience rapidly changing stress. Ice crossing an ice-stream margin experiences probably the most rapid stress changes experienced by ice anywhere in a natural setting, and, as a result, even the bulk deformation pattern can be noticeably different from the pattern expected with the concurrent stress.
Several models may be used to calculate the fabric evolution of a crystal aggregate (e.g. Reference A., Canova and AhziMolinari and others, 1987; Reference Lebensohn, R.A. and C. N. TomeLebensohn and Tome, 1993, Reference Lebensohn and Tome1994; Reference AzumaAzuma, 1995; Reference ThompsonThorsteinsson, 2002). Since most models are based on calculations of individual lattice rotations for a representative array of single crystals, application to the smoothly varying, or sometimes abruptly varying, fabric for an ice sheet is computationally impractical.
In this paper, we follow small clusters of interacting ice crystals as they move through regions of rapidly changing stress, in which fabric evolution (or its non-evolution) might produce“unexpected”deformation patterns. The evolution of crystal aggregates is calculated using the nearest-neighbor interaction (NNI) model which assigns specific neighbors to each crystal. The NNI model is equivalent to the homogeneous stress model when there is no NNI. Introduction of NNI (mild NNI through full NNI) redistributes the stress acting on individual crystals and effectively reduces the strain variationbetween individualcrystals.The details of the NNI model are described in Reference ThompsonThorsteinsson (2002).
Based on results of the crystal-aggregate calculations (NNI model), we develop a simplified model for the fabric evolution on a larger scale in which computation of single-crystal behavior in a representative aggregate is replaced by simple rules governing evolution of a fabric described by just a few key parameters. The main results that we build into the simplified model are: (a) the fabric maintains a unique symmetry axis throughout the deformation, and (b) this symmetry axis rotates towards the principal compression axis, or away from the principal extension axis, at a rate parameterized from results of the NNI model. Both the fabric symmetry axis and the principal-stress axis can be non-vertical and can vary with time. We use girdle fabric to demonstrate this approach for the fabric evolution during deformation. In ice with a girdle fabric, all crystal c axes are uniformly distributed in the solid angle between an outer angle α and an inner angle αi, which are centered on the fabric symmetry axis. When αi = 0, a cone fabric is obtained.
2. Fabric Evolution
2.1. Parameterization
Figure 1 illustrates the arrangement assumed in the analytical formulation. The angle between the principal compressive-stress axis p and vertical z is 0, the angle between the symmetry axis n of the fabric and the compressive-stress axis p is 9, and the tilt of the symmetry axis n from vertical is ξ = ϕ + θ; we have assumed for simplicity that z, n and p are in the same plane.

Fig. 1. The coordinate system and variables used in the calculations. The tilt of the symmetry axis n from vertical z is ξ, the angle between n and the principal-stress direction p is 9, and the angle between p and vertical z is ϕ. Also shown is a schematic of a cone fabric, with a cone angle α centered on the symmetry axis n, and extending in the y direction.

Fig. 2. Rate of stress–fabric misalignment angle change, 9, as a function of misalignment angle, 9. The theoretical curve (dashed), which has no nearest-neighbor interaction (Reference ThompsonThorsteinsson, 2001), has a much narrower zone of high velocity than the quadratic curve (solid) adopted from modeling with NNI (Reference ThorsteinssonThorsteinsson, 2002).

Fig. 3. Contours of the base-10 logarithm of the time-scale Ƭfabric (in years) as a function of stress and temperature.
In the absence of recrystallization, fabric evolves by internal rotation of individual crystals to accommodate neighbors, as they each deform by dislocation creep on their basal planes. We use a model of fabric evolution of crystal aggregates that includes NNIs (NNI model) (Reference ThorsteinssonThorsteinsson, 2002).
Based on the rotation rates obtained using the mild NNI in uniaxial compression as shown in Reference ThorsteinssonThorsteinsson (2002, fig. 4), we represent the rotation rate of crystals toward the axis of principal compressive stress by a quadratic function of the angle 9 between the crystal axis and the compressive-stress axis as shown in Figure 1,

Fig. 4. The evolution of the stress–fabric misalignment angle, 0, as a function of non-dimensional time Γ =t/Tfabri c , using the quadratic approximation for the relative axis-rotation rate, d.
where ![]() is a characteristic strain rate in response to the principal compressive stress ap. For temperatures lower than about –10°C,
is a characteristic strain rate in response to the principal compressive stress ap. For temperatures lower than about –10°C,
where T is temperature in K, A is expressed in units of Pa–3 a–1, Q = 60 kJ mol–1 and R = 8.31 J K–1 mol–1 (Reference PatersonPaterson, 1994, p. 97).
For comparison, the homogeneous-stress hypothesis (no NNI) gives the relative axis-rotation rate
for a single crystal in uniaxial compression, with n = 3 (Reference ThompsonThorsteinsson, 2001).
Figure 2 shows the theoretical rotation rates with no NNI (Equation (3)), and our quadratic representation for rotation rates with mild NNI (Equation (1)). The quadratic approximation allows crystals near 9 = 0° and 90° to move more rapidly towards 9 = 0° compared to motion with the no-NNI velocity distribution. We know from ice-core thin sections that uniaxial compression generates a tight cone at sufficient strains. Reference Thorsteinsson20 found that the degree of interaction represented in Equation (1) gave the best match to observed ice fabrics.
Because the symmetry axis of the fabric always rotates towards the maximum-compressive-stress direction in our model, we can follow the evolution of the symmetry axis in a particularly simple manner. By assuming that a crystal that starts on the symmetry axis will tend to stay on or near the evolving symmetry axis, we can follow the orientation of that crystal as a proxy for the evolving symmetry axis. It is possible to assign further “characteristic” crystals to track the evolution of more complicated fabric. The deformation of ice with evolving fabric strength, measured as a cone fabric for example, can be modeled by tracking the symmetry axis and one additional parameter that represents the cone angle α. Our approach, while approximate, is much simpler than tracking thousands of crystals.
2.2. Evolution of the symmetry axis
Assuming that a crystal whose c axis is on the symmetry axis at the start of an experiment will still be on or near the symmetry axis at later times, then the symmetry axis behaves as a “single crystal” in terms of rotation rate. It rotates toward the maximum-compression axis, and we can calculate the evolution of the angle 0 between the symmetry axis n and the principal-stress direction p by following that single crystal. We generalize Equation (1) to include 0, the rate of change of the direction of the principal stress, and OJ, the bulk rotation. Then the rate of change in the orientation of n relative to p is
The strain rate ἑp changes with time if the level of stress varies. If stress is constant, and there is no bulk rotation,
where 00 is the angle at t = 0.
Fabric evolution results from changes 0 to all the individual c axes, for example, as expressed by Equation (1) or (3). Therefore the characteristic time fabric for fabric adjustment is the same as the characteristic time for rotation of a crystal, which is given by the inverse of the principal strain rate ἑp at the start of a model calculation,
Figure 3 shows Ƭfabric as a function of stress and temperature. We use Ƭfabric when we non-dimensionalize time in our calculations,
Figure 4 shows the evolution of the stress–fabric misalignment angle 0 (Equation (5)), the angle between p and n, as a function of non-dimensional time Γ, starting at a range of values between5° and85°.
If we set 0 = 0 in Equation (4), we find the angles,
at which the fabric-symmetry axis does not move relative to the principal-stress axis. If the stress-axis direction p is not changing (ϕ =0) and there is no bulk rotation (ω =0), then the stress–fabric misalignment angle is 0 = 0° or 90°. This can be seen in fabrics that are adjusted to their local stress state under ice divides; the fabric symmetry axes tend to be vertical under domes (in vertical uniaxial compression). Alternatively, on a saddle, the fabric symmetry axis might be expected to be horizontal, because ice can experience a stress state close to uniaxial extension in the direction descending out of the saddle. If there is bulk rotation (OJ + 0), then there can be a steady, but non-zero, stress–fabric misalignment angle 0. For instance, this explains why, in simple-shear deformation, the fabric-symmetry axis is not aligned with the principal-stress axis (which is aligned at 45° from vertical). There can also be situations of interest to us here, in which the symmetry axis may be unable to approach the principal-stress axis because the stress axis is also moving (ϕ≠0).
2.3. Evolution of the cone angle
The evolution of fabric strength, which we measure in terms of a cone angle, α, is formulated as an approximation to results from the NNI model using mild NNI (Reference ThorsteinssonThorsteinsson, 2002). Because crystals in the NNI model do not maintain a perfectly uniform distribution within a cone, effective cone angles for these ice aggregates were inferred from the eigenvalues of the orientation tensor (Reference Benn and RingroseBenn and Ringrose, 2001).
In the absence of NNI, under uniaxial compression along the symmetry axis n, the strain rate ἑc along the symmetry axis as a function of cone angle α (Reference ThorsteinssonThorsteinsson, 2001) is

where the resolved compressional stress along the symmetry axis n is σc = σklnk nl , where ni is a component of the symmetry axis vector n, and summation is implied for repeated subscripts. The cumulative strain along the symmetry axis is
The evolution of the cone angle, using a straight-line fit to the results from the NNI model calculations is
The evolution paths from the NNI model (solid lines) and the straight-line approximation Equation (10) (dashed lines) are plotted in Figure 5. The time dimension is expressed through bulk equivalent strain

Fig. 5. The evolution of fabric strength, measured as cone angle, in uniaxial compression as a function of bulk equivalent strain using mild NNI (Thorsteinsson, 2002). The solid lines show model results for ice aggregates of interacting grains (see text), and the dashed lines are obtained using the approximation given by Equation (10).
Similar equations have been developed for the evolution of an inner girdle angle, α i, within which there are no crystals, using Equation (10) with α replaced by αi.
2.4. Solution procedure
Starting from an initial stress–fabric misalignment angle 00, and an initial fabric strength α0, we use a time-stepping procedure to follow the evolution of the stress–fabric misalignment 9, and the fabric strength α, as ice moves through a specified non-uniform stress field. With the stress state expressed in the form

the principal-stress magnitude is ![]() compression along n is
compression along n is
and the principal-stress axis p is at an angle 0 from vertical, where
At each time-step, we integrate Equation (4) to update 0, assuming that 6 is constant during the time-step Δt, . We update ξ = ϕ + θ, where 0 is the orientation of the principal-compression axis of the specified stress field, and integrate Equation (9) over the time-step Δt, to update the total strain єc along the symmetry axis. Finally, we update α using Equation (10).
We can calculate the velocity-gradient tensor Liy by rotating the stress to the reference frame in which n is vertical. Then we use the equations derived in Thorsteinsson (2001) for the velocity gradient in combined pure shear (or uniaxial compression) and simple shear, as a function of the rotated stress state, and cone angle α, to calculate Li, y, which are then rotated back to the x, z coordinate system, at each step during the calculation.
Figure 6 shows an example in which there is a constant vertical compressive stress, but the horizontal shear stress varies with time. As a result, the direction (0) and magnitude (σp) of the principal stress both change with time, and the fabric must respond to this change; the fabric strength α and direction 0 of the symmetry axis also evolve. Starting with a vertical-cone fabric defined by α = 40°, we use Equations (9), (10) and (13) to calculate the evolution. The symmetry axis n is initially θ 0 = 0° away from the principal-stress direction p. Initially the strength of the fabric changes rapidly, since the compressive stress along the symmetry axis n is large initially. The rate slows down as the cone gets tighter, since there is less deformation along the symmetry axis for tight fabric.

Fig. 6. The evolution of the fabric strength and symmetry-axis orientation in the changing stress field shown in (a). The solid line is the vertical compressive stress a, and the dashed line is the horizontal shear stress r. The symmetry-axis orientation ξ closely follows the principal-stress orientation ϕfor this slowly changing stress field (b). The fabric strength α initially increases rapidly with time, but the rate diminishes as the fabric gets stronger (less deformation along the cone symmetry axis).
3. Changing Stress State
There are several situations within an ice sheet where ice moving along a particle path can encounter rapidly changing stress. One of the most abrupt examples must be the flow of ice into an ice stream, through a shear margin.
3.1. Ice-stream shear margin
A fast-moving ice stream is separated from the slow-moving ice sheet by a relatively narrow transition zone, called a shear margin. Figure 7 shows an illustration of the geometry. In the slow-moving ice sheet, the fabric symmetry axis and the principal-compression axis tend to be parallel and vertical. Then, as the ice enters the shear margin over the course of perhaps Ƭflow = 1year, its stress state rapidly changes; the direction of maximum compression becomes horizontal and directed upstream at approximately 45° to the margin.

Fig. 7. Ice flowing from an ice sheet, where the stress is close to vertical compression, into an ice stream. At the shear margin, the ice experiences high shear strain rates. A particle (circle) will head rapidly downstream as it enters the shear margin.
A typical West Antarctic ice stream moves at 500 ma–1, with shear margins 5 km wide (Reference RaymondRaymond, 2000), and an inflow speed of 10ma–1 for ice entering the margin. The time for ice to cross the 5 km margin is approximately 500 years, so the strain rate in the margin is approximately 0.1 a–1. For a strain rate of 0.1 a–1, the characteristic time for fabric adjustment is Ƭfabric ≃10 years (Equation (6)). In that time the ice would have travelled 10 m a–1 x 10 years ≃ 100 m into the margin.
Clearly with Ƭfabric/Ƭflow ≈ 10, the fabric can be out of alignment for a few decades, as ice enters the shear margin; however, the ice does not have to travel far into the margin to acquire a new fabric symmetry. Close to the bed, migration recrystallization can reduce the adjustment time further.
Figures 8 and 9 show the evolution of fabric (a), fabric symmetry axis and cone angle (b) and velocity-gradient tensors (c), calculated using the NNI model, as ice with a vertical 30° cone and 90° cone (isotropic ice), respectively, enters an ice stream. For isotropic ice (Fig. 9), only the Lxy term is initially non-zero, and it remains dominant. The anisotropic ice (Fig. 8) experiences an expansion Lzz in the vertical direction, and contraction Lxx along the flow direction. The evolving fabric is viewed from above in (a). The symmetry axis is initially vertical (b), but as the fabric evolves it develops a strong horizontal maximum. The azimuth angle of the symmetry axis is close to 150°. The orientation of the symmetry axis is determined from the eigenvectors of the orientation tensor Oij = ni n j. From the largest eigenvalue of Oij, assuming a cone fabric, we can calculate an equivalent cone angle. For the isotropic case we see that the cone angle changes from 90° to about 60°, but for the strongly anisotropic ice the cone angle actually increases initially, as the crystals leave the tight vertical formation, and then decreases to about 60°. The jump in zenith angle arises because there are two eigenvectors that are similar in magnitude, and since we follow the largest one, the orientation changes rapidly.

Fig. 8. Anisotropic ice with a vertical 30° cone fabric from a slow-moving ice sheet enters an ice stream and is subjected to a shear stress σxy. (a) Evolution of fabric at non-dimensional times Γ = t/Tfabric = (0, 1/3, 2/3, 1), presented as a horizontal thin section (x axis to the right, and y axis up). (b) Evolution of the fabric symmetry axis n in terms of zenith (starts at 0°) and azimuth (starts at –180°) angles. The thin line shows the evolution of the equivalent cone angle α. (c) Non-zero components of the non-dimensional velocity-gradient tensor ∧ij = LijƬfabric. The shear in the margin is Lxy = 2"s7_xy (dashed line), where x is oriented downstream and z is vertical. The strongly positive curve shows vertical extension in Lzz, and the strongly negative curve shows horizontal compression in Lxx. Lyy is small throughout the evolution.

Fig. 9. Isotropic ice from a slow-moving ice sheet enters an ice stream and is subjected to a shear stress σxy. (a) Evolution of fabric at non-dimensional times Γ = t/Ƭfabric = (0, 1/3, 2/3, 1), presented as horizontal thin sections (x axis to the right, and y axis up). (b) The evolution of the fabric symmetry axis n in terms of zenith (starts at –20°) and azimuth (starts at –60°) angles. The thin line shows the evolution of the equivalent cone angle α. (c) Non-zero components of the non-dimensional velocity-gradient tensor ∧ij = LijƬfabric. Shear in the margin is Lxy = 2ἑxy (dashed line), whereis oriented downstream and> z is vertical. The positive curve shows horizontal across-margin extension in (Lyy); the negative curve shows horizontal along-margin compression (Lxx). Lzz is small throughout the evolution.
It is interesting to note that the ice wants to expand vertically as it traverses the margin. How far might the surface rise? Recrystallization, crevasse formation and other factors related to the complex shear-margin dynamics may suppress or mask this effect. Reduced snow accumulation due to wind scour on slightly raised margins could also mask uplift.
3.2. Migrating ice divide
Normal stresses vary slowly near an ice divide, while horizontal shear stress vanishes directly under a divide, and reaches a magnitude comparable to the normal stress at approximately one ice thickness away. During ice-divide migration, the orientation of the principal compressive stress changes, as the shear-stress component increases or diminishes (Reference RaymondRaymond, 1983). If these variations are rapid, the fabric symmetry axis might lag the principal-stress direction, and the resulting deformation might be different from the deformation that would be expected, had the fabric evolved in a slowly changing stress field under a steady divide.
At Siple Dome, West Antarctica, the ice thickness is H ~ 1000 m, and the accumulation rate is ḃ≃ 0.1 m a–1.
The ice divide has migrated at an average rate of m ≃ 5ḃ (Reference Nereson, N. A., Raymond, Waddington and JacobelNereson and others, 1998). Using this as a typical migration rate, and considering a “divide zone” of width 2H within which the shear stress is small, the characteristic time Ƭ flow during which the principal-stress direction is changing rapidly is Ƭflow ≃ 0.4H/ḃ.
The strain rates near an ice divide can be low, and the stresses there are small. The characteristic time (Equation (6)) for fabric adjustment can be relatively long. Recognizing that the characteristic strainrate ![]() is probably comparable to the average vertical strain rate H/b under the divide, we see that Ƭ flow < Ƭ fabric, i.e. the fabric adjustment is slow relative to the stress change.
is probably comparable to the average vertical strain rate H/b under the divide, we see that Ƭ flow < Ƭ fabric, i.e. the fabric adjustment is slow relative to the stress change.
However, this is one situation in which an examination of the characteristic times alone will not correctly predict the likelihood of serious flow inhomogeneities due to misalignment between the fabric axis and the principal-stress direction. Before we conclude that the flow pattern and, possibly, layer integrity are likely to be disturbed by a migrating ice divide, with serious implications for ice-core records, it is important to ask what are the expected fabrics at a divide and on a flank. The fabrics that tend to evolve in both environments are actually similar. For example, both the Greenland Icecore Project (GRIP) and Greenland Ice Sheet Project 2 (GISP2) ice cores have predominantly vertical-cone fabrics. When a divide migrates, the amount offabric adjustment that must be accomplished is minimal. In spite of its long adjustment time, the fabric is never actually far from its preferred condition under steady stress. As a result, heterogeneous deformation due to misaligned fabric is unlikely to be enhanced.
3.3. Flow near a saddle
In high, cold mountain areas, saddles are potential ice-core sites (e.g. Mount Logan, Canada (Reference Holdsworth and PeakeHoldsworth and Peake, 1985), Colle Gnifetti, Swiss Alps (Reference Oeschger, U., B., W. and H.Oeschger and others, 1978; Reference Haeberli and FunkHaeberli and Funk, 1991), and Huascaran, Peru (Reference RaymondThompson and others, 1995)). As ice flows toward a saddle between two domes in an accumulation area (see Fig. 10), it might initially develop a vertically oriented fabric, due to vertical uniaxial compression associated with the flow on and near a dome. As ice approaches the saddle, it experiences horizontal compression along the axis joining the domes, and shear in the vertical flow plane, and vertical compression may weaken or even change sign. However, ice still experiences horizontal extension in the directions descending from the saddle. This stress pattern, if it persisted, might tend to develop a girdle fabric with a horizontal axis directed downslope out of the saddle, as the c axes move away from the single axis of extension. After ice descends past the saddle, it may continue to experience compressive stress transverse to its flow direction if the mountain confines the flow, or transverse extension if the flow again spreads laterally. In the former case, the fabric might maintain a horizontal axis, while in the latter case, it might tend to redevelop a vertical symmetry axis. Unlike the minimal fabric differences near a moving divide, these fabric differences could be large.

Fig. 10. A schematic particle path (solid line) and stress pattern for flow through a saddle.
To characterize saddles, we define
where H is ice thickness, S''D is the curvature of the surface between the domes, and S'H is the average slope between the divide and 1H downstream. For N » 1, there will be a strong saddle-flow pattern; for N ~ 1, there will be a combined saddle and plane-strain flow; and for N ≪ 0 the flow will approach plane strain. A flow model would be needed to characterize the type of flow (N) for any particular saddle. Although we have not used such a flow model, we can examine the behavior of anisotropic ice that undergoes deformation that might be encountered in a strong saddle, i.e. N ≫ 1.
We now consider the characteristic times for fabric changes and ice flow. Flow near a saddle can be more difficult to represent with a few characteristic numbers than flow near a divide, due to variable distance from the domes, or the closest approach to the saddle point. However, both time flow for flow through the saddle, and the fabric evolution time Ƭfabric probably depend on the same characteristic time H/b, although their actual values may span a broad range. Figures 11–13 show the stress pattern, velocity gradient and fabric evolution, as ice with an initially vertical 60° cone fabric moves past a saddle and continues down the slope below, on which transverse extension is again established. It is important to note that this is but one of many possible situations near a saddle, where the curvature of the surface between the domes, and the slope out of the saddle will affect the sign and magnitude of the longitudinal, transverse and vertical stresses.
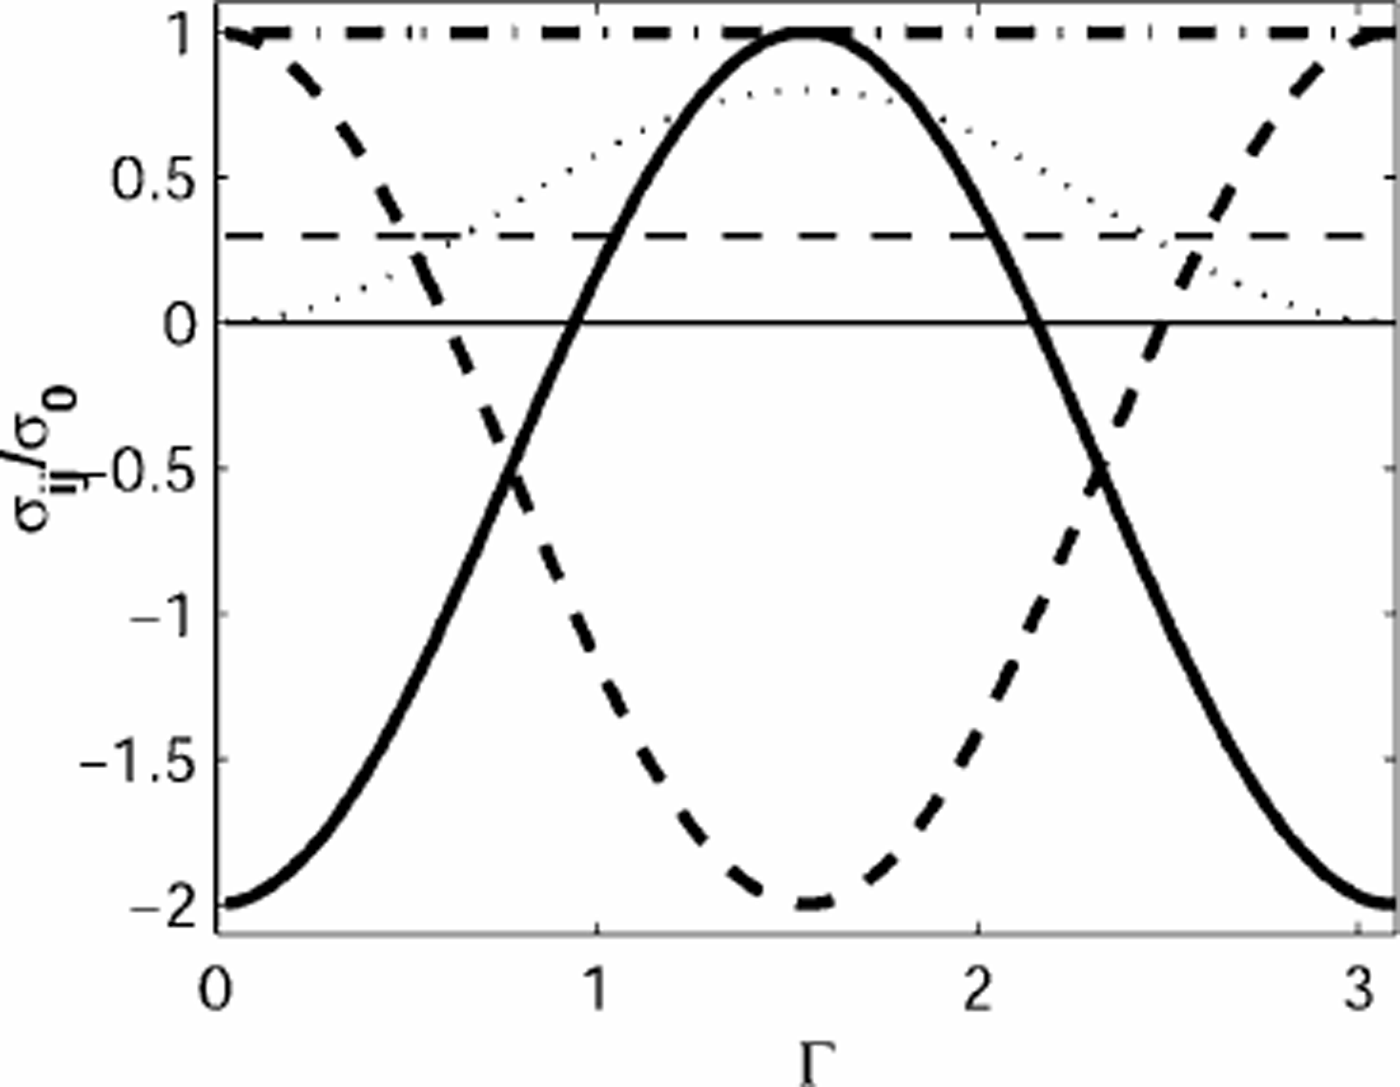
Fig. 11. The stress history of anisotropic ice, with initialfabric α = 60°, moving through a saddle. Vertical compression (thick solid line) is negative, or zero, the transverse extension (dash-dotted line) is always positive, and longitudinal stress (thick dashed line) in the flow direction changes from extensile to compressive and back to extensile. There is bed-parallel shear (thin dashed line) and marginal shear (dotted line).

Fig. 12. The non-zero components of the non-dimensional velocity-gradient tensor ∧ij = LijTfabric as a function of non-dimensional time Γ. The thick dashed line shows longitudinal velocity gradient ∧nn, the thick dash-dotted line is the transverse velocity gradient ∧tt, and the thick solid line is the vertical velocity gradient ∧zz. The bed-parallel shear is the thin dashed line, and the margin shear is the dotted line.

Fig. 13. The initial fabric for the ice moving through the saddle was α = 60°. (a) Evolution of anisotropic fabric at non-dimensional times Γ = t/Ƭfabric = (0, 1, 2, 3) where the x axis is to the right and y axis is up. (b) Evolution of the fabric symmetry axis ξ, the principal-stress direction ϕ and the fabric strength α.
The deviatoric stress used to simulate this flow pattern is shown in Figure 11. The velocity gradient in Figure 12 shows the effects of this stress state, and of the fabric evolution (notice particularly the decreasing transverse deformation). The fabric that evolves (Fig. 13) has a nearly vertical symmetry axis orientation ξ throughout the deformation. The maximum inclination is around 20°, and around Γ = 2.5 it is evident that the symmetry axis tries to follow the principal-stress direction. The principal-stress direction ϕ changes from nearly vertical, to horizontal and then back to nearly vertical.
The transverse deformation quickly (Γ < 1) becomes very small, despite a significant, and constant, applied transverse stress. The vertical and longitudinal deformations show the characteristics of the applied stress; corresponding stress and strain-rate components generally have the same sign. However, their amplitudes do not track the variations in the applied stress. The bed-parallel shear varies considerably in spite of constant, and fairly small, bed-parallel stress. The shear in the vertical plane is small throughout, despite the applied stress being about twice the bed-parallel stress near Γ = 1.5.
The deformation as ice flows through a saddle, with large N, is therefore complicated, due to rapid stress changes and anisotropy A saddle with a large N could be a site of layer disturbances as a result.
3.4. Laboratory experiments
In laboratory experiments, ice experiences a sudden change in stress, i.e. the characteristic time Ƭflow for a change of stress pattern is very short. In some cases, experiments are done on samples that are cut at a high angle to the in situ principal-stress direction, such as 45° to vertical for ice that was in vertical compression. A goal might be, for example, to learn about the behavior of the ice in response to horizontal simple shear, using apparatus that can perform only pure shear or uniaxial-compression experiments. However, it is important to recognize that the characteristic time Ƭfabric for the fabric to evolve to fit the new stress state is now very much longer than Ƭflow, so unusual deformation patterns maybe seen.
Figure 14 shows the evolution of fabric and velocity gradient as a function of non-dimensional time Γ = t/Ƭfabric in vertical uniaxial compression calculated using the NNI model. The deformation pattern obtained in pure shear is nearly identical to the deformation pattern in uniaxial compression. We chose uniaxial compression here because, in contrast to the isotropic case, there is only horizontal deformation in one direction. The initial fabric, a cone with α = 30°, was tilted initially by 45° away from vertical. Immediately, as the sample starts to deform, there is a small but significant simple-shear deformation. If the ice were isotropic, there would be no simple-shear deformation. As soon as the fabric starts to evolve, we are no longer simulating simple shear, since the fabric adjusts to the vertical uniaxial-compression stress state which is different than the fabric that would evolve in simple shear. If the test apparatus does not allow, or restricts, shear deformation, there will be additional complicated and possibly unknown stresses imposed on the sample by the apparatus walls in order to suppress that shear deformation. Interpretation of the measured deformation is then very complicated.

Fig. 14. Ice with a 30° cone fabric in a laboratory creep test is subjected to vertical uniaxial compression at 45° to the fabric axis. (a) Fabric evolution at non-dimensional times Γ = t/Tfabric = (0, 1/3, 2/3, 1). (b) The evolution of the stress– fabric misalignment angle 9 (thick line) and the cone angle α (thin line). (c) Non-dimensional velocity gradient ∧ij = LijƬfabric. Solid lines show diagonal components, with ∧zz negative, ∧yy close to zero and ∧xx positive. The dashed line shows the shear rate ∧xz. Isotropic ice or ice with vertically symmetric fabric would produce no shear deformation (∧xz =0) and would be described by ∧xx = ∧yy = -∧zz/2.
4. Discussion
When the fabric cannot adjust rapidly enough to changes in the flow field (Ƭfabric ≫Ƭflow), the deformation pattern can be quite different from the pattern that would be expected for fabric that has adjusted to a slowly changing flow field (Ƭflow ≫ Ƭfabric). Recognizing the signatures of these effects can be difficult; identifying anomalous thickness variations in radar internal layers may be the most promising route. The presence of non-steady layer thickness variations increases the likelihood of stratigraphic disturbances such as recumbent folds (Waddington and others, 2001; Thorsteinsson and Waddington, 2002).
We have not carried out a comprehensive exploration of regions in which stress might change rapidly. Changes in basal conditions, such as transient changes in lubrication, might also create areas where the fabric might not adjust to changes in the flow.
Where migration recrystallization, i.e. the nucleation of new, strain-free, grains and rapid migration of grain boundaries (Reference Duval and CastelnauDuval and Castelnau, 1995), is active, the fabric shows a characteristic symmetry; in uniaxial compression, for instance, a small girdle forms and seems to be self-sustained. This will modify the characteristic time for crystal-orientation changes since the fabric is now heavily influenced by the orientation of newly formed crystals. The time-scale will be shorter, since in most cases a strain of a few per cent is enough to modify the fabric.
Modeling the fabric evolution by assuming that the crystals rotate towards the compression axis according to a quadratic stress–fabric misalignment angle velocity curve represents a simplified approach to the problem of fabric evolution. The key benefit is that a few values (symmetry axis, cone angle, other characteristic axes), instead of two values for each of many thousands or millions of crystals, can characterize the fabric evolution.
In our analytical formulation, we have assumed that the fabric maintains its initial azimuth pattern around the symmetry axis throughout the deformation, i.e. no azimuth velocity. From modeling work and experiments, it is known that the fabric that evolves during pure shear, for instance, is not a symmetric cone (see, e.g., Thorsteinsson 2002, figs 2 and 3). The variations in azimuth velocity, which are not considered, cause the slightly elliptical distribution of c axes in pure shear, for instance. For fabric evolution where the flow field changes slowly, however, the cone approximation will work well, since the stress and velocity gradient tensors usually have the same non-zero components, and the fabric strength can be approximated with a cone, although the rate of fabric adjustment (strength and stress–fabric misalignment) may have to be adjusted.
5. Conclusions
Throughout most of the volume of the ice sheets, the timescale associated with fabric adjustment T is of the same order as, or shorter than, the time-scale associated with flow changes Ƭflow. But, in certain situations, the reverse can be true, and there the deformation patterns can be very different from what would be expected if the fabric were adjusted to the flow field. When ice enters an ice stream, the fabric axis can lag well behind the principal-stress axis, because Ƭfabric/Ƭflow ≫ 1. The flow pattern is expected to be complicated by the evolving anisotropy in addition to the effects of recrystallization which changes the evolving fabric and crevasse formation. Relatively rapid stress changes can be found near migrating divides, Ƭfabric/Ƭflow ≈ 1, but stress and fabric are probably seldom dramatically misaligned. Near saddles, the orientation of the principal compressive stress can change rapidly by 90°, from vertical to horizontal. This leads to a large stress–fabric misalignment angle, and the flow pattern is complicated by the anisotropy. Interpretation of laboratory experiments may be difficult when the fabric is not adjusted to the applied stress. There may be no ideal substitute for test apparatus that can apply compound stresses.
Acknowledgements
Discussions with C. F. Raymond and a review by D. DahlJensen improved this work. The work of the scientific editor, L.W. Morland, is greatly appreciated. This work was supported by grants OPP-9123660, OPP-9526707, OPP-9815136 and OPP-9815160 from the U.S. National Science Foundation.


