Introduction
In the Antarctic coastal area, the total sulphate concentration in the snow collected at low-altitude stations is mainly correlated with primary aerosol (sea-spray) inputs (Piccardi and others, 1994,1996a, b). As altitude increases, the contribution of secondary atmospheric aerosol becomes dominant. in unpolluted marine-dominated areas such as Antarctica, because of the low impact of other aerosol sources, the sulphur-cycle secondary aerosol is closely related to biogenic activity. The main source of sulphur compounds is the dimethyl sulphide (DMS) emitted by phytoplanktonic activity and which is oxidised in the atmosphere mainly to methane sulphonic acid (MSA) and H2SO4 (Reference Andreae and RaemdonckAndreae and Raemdonck, 1983; Reference Saltzman and DelmasSaltzman, 1995). These substances may be important in the climate control of remote marine regions as principal factors in cloud-condensation nuclei formation (Reference Charlson, Lovelock, Andreae and WarrenCharlson and others, 1987; Reference Ayers and GrasAyers and Gras, 1991).
In Antarctica, the main contribution to nssSO4 2-, at least during summer, comes from the oxidation of biogenic DMS (Reference Legrand, Feniet-Saigne, Saltzman, Germain, N. I. and PetrovLegrand and others, 1991; Reference DelmasDelmas, 1994; Saltzman, 1995; Reference Wagenbach, Wolff and BalesWagenbach, 1996) rather than from other postulated sources such as volcanic input, crustal origin and long-range transport effect (Reference Legrand and DelmasLegrand and Delmas, 1987; Reference ShawShaw, 1988). At high latitudes, the annual cycle of solar irradiation imparts a sharp seasonal character to the DMS production, with concentration maxima during and immediately after the phytoplanktonic bloom (Saltzman, 1995; Wagenbach, 1996). For the studied area, this period isjanuary-February (full-late austral summer). The seasonality of the biogenic nssSO4 2- input has been shown by snow measurements (Reference Ivey, Davies, Morgan and AyersIvey and others, 1986; Reference Mulvaney, Pasteur, Peel, Saltzman and whungMulvaney and others 1992; Piccardi and others, 1994; Udisti 1996; dc Mora and others, 1997) and aerosol measurements (Ayers and others, 1991; Reference Prospero, Savoie, Saltzman and LarsenProspero and others 1991; Saltzman, 1995; Wagenbach, 1996; dc Mora and others, 1997).
MSA derives only from oxidative processes of phytoplanktonic DMS. Because of its univocal origin, this compound can be employed as a reliable indicator of biological marine activity (Reference Savoie and ProsperoSavoie and Prospero, 1989; Ayers and others, 1991; Legrand and others 1991; Udisti, 1996; Reference de Mora, Wylie and Dickde Mora and others, 1997). The seasonal trend of this compound is normally in phase with nssSO4 2- (assuming similar atmospheric transport mechanisms), with concentration maxima during late summer. Some authors, however, report evidence of dephasing between these two compounds, probably due to post-depositional phenomena (Mulvaney and others, 1992; Reference Minikin, Wagenbach, Graf and KipfstuhlMinikin and others, 1994). in our previous measurements on firn-core and snow-pit samples collected in northern Victoria Land such dephasing was never found. MSA summer maxima were shown by snow measurements (Mulvaney and others, 1993; Udisti and others, 1993) and aerosol measurements (Ayers and others 1991; Saltzman, 1995; Wagenbach, 1996; de Mora and others, 1997). Because of its sharp seasonality, MSA has been used to date successive snow layers (Piccardi and others, 1994; Udisti, 1996).
Evaluation of the different contributions to the sulphur balance and study of the distribution of the species originating from DMS in Antarctic snow can give useful information about past and present climatic conditions, phyto-planktonic activity and global-change phenomena. in fact, MSA and nssSO4 2- can be considered near-stable in the Glaciol ice cap (Legrand and others, 1991; Saltzman, 1995).
Moreover, the study of the spatial and vertical variation of the MSA/nssSO4 2- ratio, with particular attention to altitude effects (related to dimensional atmospheric aerosol classes) and to seasonality, can explain short and global-scale transport mechanisms and fractionating phenomena.
Sampling and Analytical Methods
Sampling stations
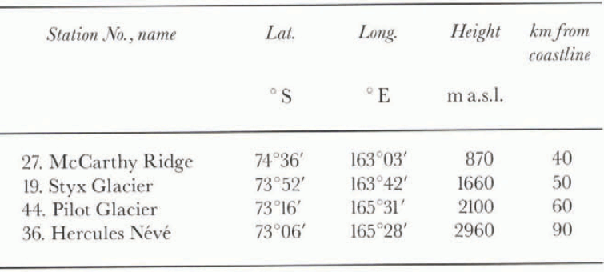
During the 1993-94 Italian Antarctic campaign, snow samples were obtained from four snow pits (about 3.0 m depth) excavated at different altitudes and distances from the sea. Figure 1 and Table I show the locations and altitudes of the sampling stations. Northern Victoria Land is a region with different orographic and glaciological characteristics, in which the proximity to the sea of the Transantarctic Chain and the presence of the valleys of the outlet glaciers are responsible for the confluence of katabatic winds (Bromwich and Kurtz, 1984). The sampling area was accurately prospected by remote-sensing analysis (based on satellite photos) to identify aeolian morphologies linked to ablation (blue-ice area, sastrugi, wind scoop) or different accumulation processes (snowdrift, drift plume). in this way it was possible to find (personal communication from B. Stcnni and others, 1997) areas not influenced by such morphologies where snow accumulation seems not to be influenced by katabatic wind effects (erosion, transport, redistribution). The minimum station altitude (870ma.s.l.) was accurately chosen to avoid any possibility of summer snow-layer melting. No ice crusts were detected in the sampled snow pits.

Fig. 1. Map of northern Victoria Land showing locations of sampling stations.
Table 1. Locations and altitudes of sampling stations
Sampling procedures and analytical methods
All the samples were collected by using a sampling protocol (Udisti and others, 1991,1994; Piccardi and others, 1994) to minimise contamination. The snow pits were hand-excavated by personnel wearing clean-room clothing, and the snow walls were cleaned by removing a 5-10 cm layer with a stainless-steel scraper just before the sampling. Pre-cleaned polypropylene vials were inserted in the vertical snow walls with a snow-layer resolution of 35 mm. After removal, each sampling vial was sealed in a double polyethylene bag.
The determinations of MSA and of those compounds necessary 10 calculate nssSO4 2- (total sulphate and sodium) were performed by ion chromatography (IC).
A system of three Dionex ion chromatographs (4000i, 4500i and DX 500) with conductivity detector was used for all measurements. The separation columns were Dionex AS12A (inorganic anions), AS11A (organic anions plus fluoride) and Dionex CS12A (cations) followed by electrochemical micro-membrane conductivity suppressors. All the components were analyzed as soon as possible after melting (generally 30 min). A 1 ml sample loop was sufll-cient to determine the lowest concentrations of the compo-

Fig. 2. Mean concentration values of CI− and Na+ (a), totSO4 2- and Mg2+ (b), nssSO4 2- and MSA (c) as function of altitude at the four sampling stations.
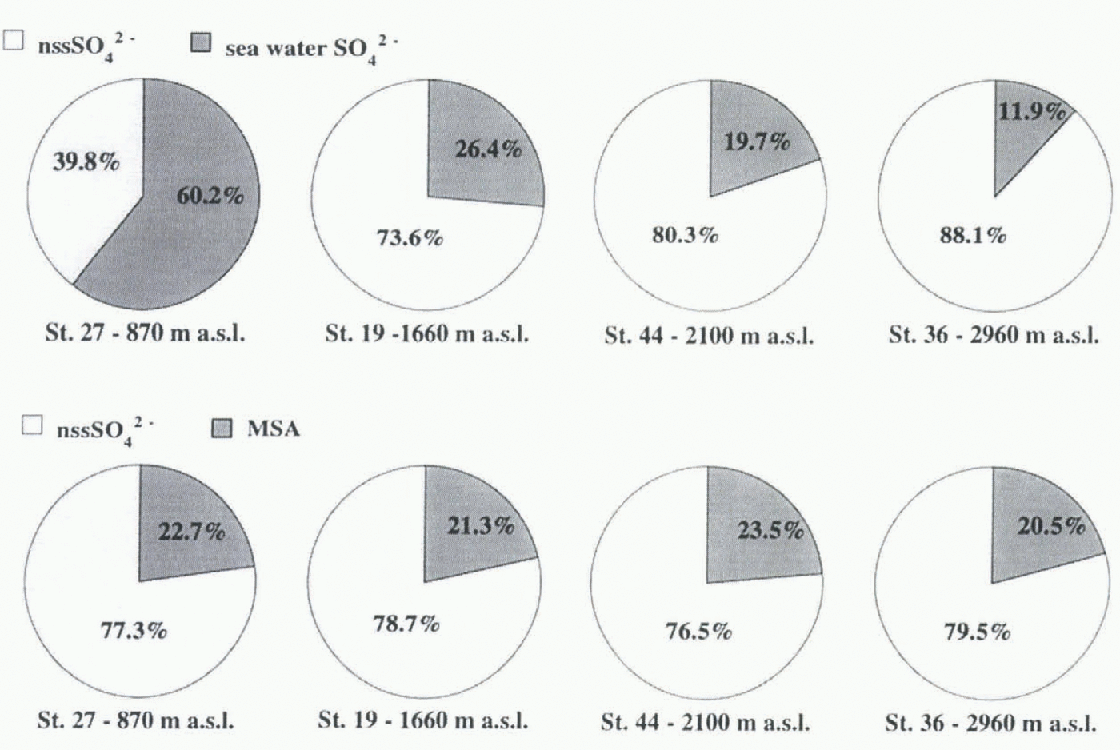
Fig. 3. Relative contributions of nssSO4 2- to total sulphate budget (upper pies) and of MSA and nssSO4 2- to total amount of non-sea-salt oxidised sulphur compounds (MSA + nssSO4 2-) (lower pies) for all sampling stations.
nents without pre-concentration, to avoid contamination risk. For the same reason, sample manipulation was minimised. The sealed samples were melted under a class 100 laminar hood, and the sample was filtered on a 0.45 μm Teflon membrane just before analysis. The blank control procedures, sample treatment and IC methods have been described in previous papers (Udisti and others, 1991, 1994; Piccardi and others, 1994; Udisti, 1996)
Results and Discussion
nssSO4 2- calculation
The term nssSO4 2- refers to the contribution of sulphates not coming from sea spray. For each sample, the nssSO4 2-, concentration was calculated using the formula (Reference Maupetit and DelmasMaupetit and Delmas, 1992):

Previous nssSO4 2-, measurements on samples collected in the same region indicated that either CI− or Na+ could be used as a sea-spray indicator (Udisti, 1996). Nevertheless, the use of CI gives relatively high errors when the primary marine contribution is very low (Piccardi and others, 1996a). For this reason, Na4 concentration has been used as the sea-spray marker. Since nssSO4 2- measurement is obtained from the difference between two experimental data, the analytical error is greater with respect to MSA determination (Reference Keene, Pszenny, Galloway and HawleyKeene and others, 1986; Reference Hawley, Galloway and KeeneHawley and others, 1988; Udisti, 1996). Moreover, the uncertainty (not quantifi-able) of the calculation hypotheses must be evaluated assuming (i) the ([SO4 2-]/[X])see water is considered known and constant, (ii) the concentration of Na+ or Cl− in the sample is attributed to sea spray only and (iii) there is an absence of selective fractionating processes or post-deposi-tional effects.
The main evidence of incorrect evaluations of The above factors is provided by negative nssSO4 2- values, usually found in snow precipitation characterised by high sea-spray and/or low nssSO4 2- content. These situations occur princi-pally at coastal and low-altitude stations in the winter period (Maupetit and Delmas, 1992; Piccardi and others, 1996a, b; Wagenbach, 1996). For the samples analyzed here, negative nssSO4 2- values were found only for McCarthy-Ridge. in order to obtain a reliable data comparison among the four snow pits, only positive values were considered.
Spatial and vertical distribution
From the preliminary data, the altitude was the dominant factor in the snow chemical composition in northern Victoria Land (Piccardi atld others, 1996a). To confirm this, font-snow pits were sampled at stations located at different altitudes (870 2960 m a.s.1.). Such altitude variation makes it possible to identify main and secondary aerosol sources and to point out the fractionating aerosol phenomena related to different aerosol dimensional classes. Moreover, the snow-composition data can be reliably compared because the snow pits were sampled at the same time and the samples came from similar annual snow layers.
Figure 2 shows the decrease of mean concentration values as altitude increases. Each mean value refers to about 60-90 samples. There is a similar behaviour for all substances: a very large concentration decrease occurs in the range 870-1660 m a.s.1.. A slower decreasing trend is still visible for the range 1660-2100 m a.s.1., but for higher altitudes the concentration values remain fairly constant. Al Hercules Névé station (2960 m a.s.1.) μg−1 or sub-μg −1 concentration levels were found for almost all the compo-
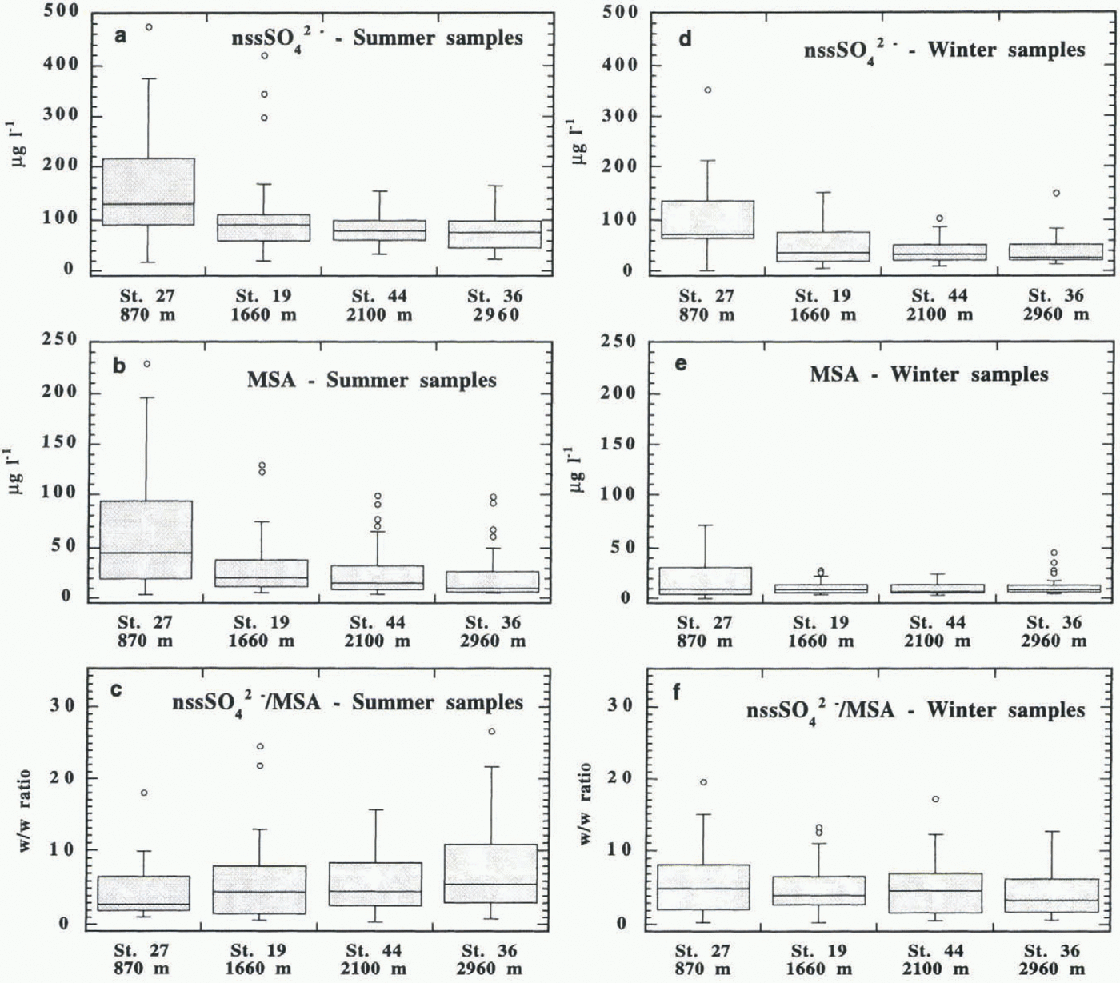
Fig. 4. Distribution plots of nssSO4 2-, MSA and w/w nssSO4 2- /MSA ratiofor thefour sampling stations. The plots are separated as summer (a,b,c) and winter (d, e, f) samples. Each box contains 50% of the data, with the median value displayed as a line. The top and bottom of the box mark the limits of ± 25% of the variable population (25th and 75th percentiles). The lines extend-ingfrom the top and bottom of each box mark the minimum and maximum values that fall within an acceptable range (1.5 times the box width). Any value outside this range (outlier) is shown as an individual point.
nents. The most dramatic decrease is shown by the sea-spray components (Na+, Cl−1 , Mg2+ and totSO4 2-; fig. 2a and b). Cl− shows the highest concentration decrease, with mean concentration values at stations 27,19,44 and 36, respectively, of 1991, 215,126 and 73 μg l−1 (St. 36/St. 27 = 3.7%). The tot-SO4 2- (fig. 2b) and the nssSO4 2- (fig. 2c) show a lower decrease from station 27 to station 36: tolSO4 2- from 386 to 68μgl−1 (St. 36/St. 27 = 18%); nssSO4 2- from 176 to 79μg−1 (St. 36/St. 27 =45%). Comparing Cl−, totSO4 2- and nssSO4 2- altitude trends, it is evident that the SO4 2- contribution from sea spray is partially counterbalanced by the presence of biogenic sources, which becomes more important as the altitude of the sampling station increases. The smaller decrease of the biogenic contribution with altitude, with respect to decrease of sea-spray sources, is confirmed by the MSA trend (fig. 2c). The mean concentration values of MSA are 44,21,19 and 16μg r−1 at stations 27,19,44 and 36, respectively, with a percentage ratio of 48% at the first step
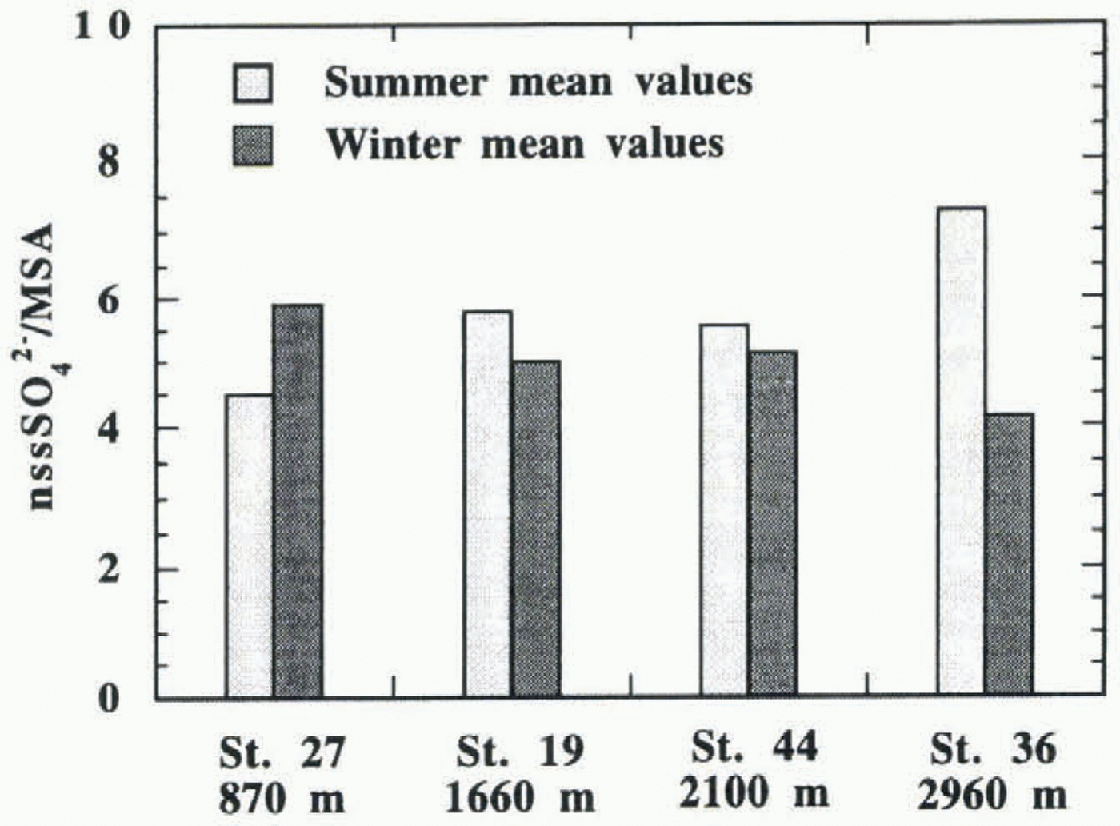
Fig. 5. nssSO4 2-/MSA ratio mean values in summer and winter periods plotted for all sampled stations.

Fig. 6. Distributionfrequencies/or MSA, nssSO4 2- and their (w/w) ratio of summer (a, c, e, g) and winter samples (b, d, f, h) for all sampling stations. The frequency steps for McCarthy Ridge and Pilot Glacier stations are wider than those of Styx Glacier and Hercules Névé for the lower sample number.
(St. 19/St. 27) and 84% at the last (St. 36/St. 44). Such variations are similar to those of nssSO4 2-.
The relative contributions of sea-salt and non-sea-salt sulphate to the total sulphate balance are shown in Figure 3. A very large depletion of sea-salt sulphate occurs when the altitude increases. At the Hercules Névé station, the nssSO4
2- contribution represents about 88% of the total sulphate. By contrast, the relative contributions of nssSO4
2- and MSA to the non-sea-salt sulphur budget are near-constant and independent of altitude:
mean ![]() . This value is consistent with Reference BerresheimBerresheim'S (1987) and Reference Pszenny, Castelle, Galloway and DucePszenny and others' (1989) aerosol measurements over circum-Antarctic oceans where MSA fractions were as high as 0,5 with a mean value of 0.3.
. This value is consistent with Reference BerresheimBerresheim'S (1987) and Reference Pszenny, Castelle, Galloway and DucePszenny and others' (1989) aerosol measurements over circum-Antarctic oceans where MSA fractions were as high as 0,5 with a mean value of 0.3.
Seasonal nssSO4 2- and MSA pattern
The seasonal pattern of the phytoplanktonie DMS emissions requires a seasonal characterisation of the snow-pit samples in order to determine the MSA and nssSO4 2- distri-butions and relationships at the different stations. The snow-pit dating was performed using a multiparametric method based on a normalisation of the concentration/depth profiles of H2O2 nssSO4 2- and MSA (Udisti, 199¾. The dating results are reported elsewhere (Piccardi and others, 1995). in this way, 5, 6, 4 and 8 annual layers were found, respectively, for snowpits 27 (depth 286 cm), 19 (depth 277 cm), 44 (depth 223 cm) and 36 (depth 321 cm).
Based on this dating, a seasonal characterisation of the samples is performed here. The seasonal concentration and distribution data are given inTable 2. Graphical representations of the MSA and nssSO4 2- distribution are given in the box plots shown in Figure 4. Each box contains 50% of the data, with the median value displayed as a line. From the mean data of Table 2 and distribution plots of figure 4a, b, d and e, some generalisations can be made about the distributions of MSA and nssSO4 2- in summer and winter samples with respect to altitude.
The mean and median concentrations of the two components at all the stations are higher in summer than in winter. Therefore, the biogenic contribution from DMS is dominant for all altitudes. The seasonal concentration trends of mean and median values confirm the trend evidenced by general mean values: a sharp decrease is evident in the first altitude step (870-1660 m a.s.1.). A lower but progressive decrease is shown when the altitude increases.
In both seasons, the data dispersion is higher for the stations at lower altitude. This is graphically shown by the box height and numerically indicated by the concentration range between the 25th and 75th percentiles. in particular, McCarthy Ridge station shows very high data dispersion, especially in summer, for MSA and nssSO4 2-. This agrees with the fact that the sea is the principal source of their precursor DMS, even though Its oxidation takes place in the atmosphere.
The median values are not symmetrical with respect to the data distributions. This is shown by the position of the median line in the box plots and by the difference between the mean and median values. Generally the median line is shifted to the bottom of the box and, consequently, the mean values are higher than the median ones. This result indicates that there are a few snow precipitation events with high MSA and nssSO4 2- concentrations rather than a larger number of events with lower contributions. This is especially evident in winter at McCarthy Ridge, where the proximity of the sea and the low altitude make this station more subject to isolated and intense atmospheric disturbances (such as salt storms).
nssSO4 2- negative values occur at the lowest station only, and almost all occur in winter (27% of winter data). Only one negative value is found in summer. All these values coincide with intense sea-spray contributions. The underestimation of sea-spray contribution to sulphate budget (due to an incorrect so4 2-/Na+ sea-spray ratio or to transport fractionation) seems, therefore, to be a fundamental factor for nssSO4 2- calculai ion. This error becomes more evident when the other nssSO4 2- contributions (DMS) are lower. At higher stations, the sulphate sea-spray contribution is lower (Fig. 2) and this misinterpretation is “hidden” by the dominant contribution of nssSO4 2 to the total sulphate budget.
nssSO4 2-/MSA ratio
A different behaviour is shown by the nssSO4 2- /MSA ratio (fig. 4c and 1). The data dispersions and median values increase with altitude in summer samples, while these values remain fairly constant in winter samples.
In summer, the 50% data range changes from 2.0-6.6μg 1 −1 at McCarthy Ridge to 3.1-10.9μg r−1 at Hercules Néve, with relative median values of 4.5 and 7.3 μgl−1. in winter, 50% of the samples have nssSO4 2- /MSA ratios ranging from 2.1-1μgl−1 (bottom value at Pilot Glacier) to 8.1 μg−1 (top value at McCarthy Ridge), with the median value in the narrow range from 3.5μg−1 (Hercules Névé) to 5.0 μgl−1 (McCarthy Ridge). For each station, the nssSO4 2- /MSA ratios show a smaller nssSO4 2-/MSA variation of median value between summer and winter with respect to single substances. The variation in values and trends of the nssSO4 2- /MSA ratios with seasonality shows the low significance of their general (all-station) or annual mean values, usually reported in the literature. The same general mean MSA fractions reported here (Fig. 3) render us unable to distinguish stations that have different nssSO4 2- /MSA seasonal patterns. in fact, the mean ratios show an opposite seasonal trend at the lowest station to that at the higher ones (Fig. 5). At McCarthy Ridge (790 m a.s.1.) the nssSO4 2- /MSA ratio increases in winter; at all the other stations, this ratio reaches the highest values in summer (particularly at Hercules Névé). This behaviour can be explained by the distribution frequencies shown in Figure 6 where a quasi-bi-modal distribution of the ratio values during summer and winter can be observed. Relatively high sample frequencies are bunched in two value ranges: around the nssSO4 2- / MSA value of 2 and around 5 or higher. At the lowest station, the ratio distribution varies according to the season; more samples have higher values during winter. At the intermediate stations, the distributions are very similar (Pilot Glacier) or compensating (Styx Glacier), so that the mean ratio assumes similar values in the two seasons. At Hercules Nevé, the mode located at values around 10 in summer is missing in the winter period. For this reason, the mean nssSO4 2- /MSA ratio is lower in winter here.
Seasonal variation of transport processes and/or fractionation such as marine aerosol inputs from lower latitudes (with a different nssSO4 2- /MSA ratio) due to atmospheric circulation changes may explain this seasonal and altitude-induced trend in the nssSO4 2- /MSA ratio.
The nssSO4 2- /MSA ratio as a function of MSA concentration, used as a univocal biogenic indicator, is shown in Figure 7. The ratio tends to values around 2 for the highest MSA concentrations, lb better evaluate the summer behaviour of nssSO4 2- /MSA ratio, superficial summer snow
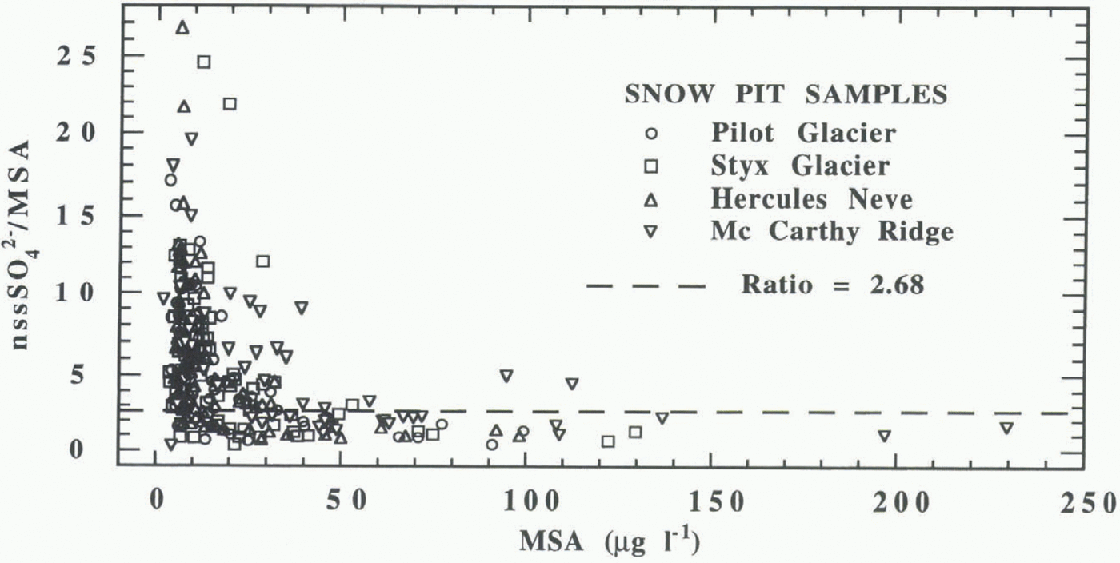
Fig. 7. All samples nssSO4 2-/MSA ratios plotted vs MSA concentration in the jour snow pits. The dashed line shows the value 2.68foundfor summer “fresh” snow samples.
was sampled at about 20 stations within a 200 km radius of the snow-pit stations. The time between the snowfall and the sampling was as short as possible so that the samples could be considered as “fresh” snow samples, affected as little as possible by post-depositional processes. These samples, collected in November-January, are representative of typical summer snowfalls. A good correlation (R= 0.81, N = 88) between nssSO4 2- and MSA was obtained, with a slope in-dicating the summer mean nssSO4 2- /MSA ratio) of 2,68. This result agrees with the nssSO4 2- /MSA ratio found for snow-pit samples with high MSA concentration. When the MSA concentration decreases, the nssSO4 2-/MSA ratio quickly increases to values higher than 20 (Fig. 7). This occurs mainly for winter samples and for the higher stations.
Such behaviour ran be explained by the presence of other possible nssSO4 2- sources, by sea-spray or biogenic sulphur compounds fractionation or by long-range transport of marine aerosol characterised by different nssSO4 2- /MSA ratios. in fact, the nssSO4 2- /MSA ratio is strongly latitude-affected (Reference Bates, Calhoun and QuinnBates and others, 1992). At the highest latitudes, as in Antarctica, the nssSO4 2- /MSA aerosol ratio can reach a value close to 1 (Berresheim, 1987; Pszenny and others, 1989), but this ratio increases very quickly with decreasing latitude. At mid- to low latitudes, the nssSO4 2- /MSA ratio reaches values ten times higher than in polar regions (Saltzman, 1995). in winter, when sea ice constitutes a very large belt around Antarct ica and the sealine is 500 1500 km away from the coastline, two concomitant effects could contribute to an increase in the nssSO4 2- /MSA ratio: more intense fractionation of sea spray, and long-range transport of oceanic air from lower latitudes. Similar transport processes can also be assumed in summertime for high-altitude stations (above 1500 in a.s.l.) where usually only the lower-dimensional aerosol classes can arrive. in fact, the aerosol transport from southern mid-latitudes appears more effective at the upper tropospheric level (Wagenbach, 1996).
A background nssSO4 2- contribution (volcanic or crus-tal) that becomes more evident when the biogenic source decreases (low MSA concentrations in winter and at the highest stations) is another possible explanation of the nssSO4 2- MSA 1 rend.
Conclusions
The two major contributions to sulphates in northern Victoria Land, sea spray and DMS, are important, file latter contribution predominates for seasonal inputs (high phytoplanktonic activity in summer) or when the former decreases (altitude increase, absence of events such as salt storms). Further work is needed to obtain a correct evaluation of nssSO4 2- (original aerosol SO4 2- /Na+ ratio and fractionation during air-mass transport).
Altitude is a fundamental parameter for the distribution of components coming from sea spray as well as from marine biogenic activity. Fractionating aerosol phenomena, related to aerosol dimensional classes, have an important effect.
MSA and nssSO4 2- concentrations in the snow show a dear seasonal pattern due to the production of their principal source (DMS of phytoplanktonic origin).
The MSA/nssSO4 −2 trend with altitude and seasonality and its relationship with MSA, used as a univocal biogenic indicator, reveal the importance of long-range transport effects or the presence of other nssSO4 2- sources which are more evident in winter precipitation and in the snow collected at higher altitudes.
The low significance of the MSA/nssSO4 2- mean ratio calculated on all-station samples as well as on annual periods should be noted. Only a seasonal study can give reliable information about the trend of this ratio.
Acknowledgements
The present work was supported by Ente Nazionale Energia e Ambiente with in the framework of the Italian Antarctica Project PN RA).


