


Introduction
Recent literature shows the importance of glaciological and climatological research on Antarctica in studies of global change (e.g. Reference Ohmura, Wild and BengtssonOhmura and others, 1996a; Reference Budd, Coutts and WarnerBudd and others, 1998) that depend to a large extent on reliable information on mean annual net surface accumulation or surface balance to complement findings involving glaciological (e.g. Reference Bentley, Giovinetto, Weller, Wilson and SeverinBentley and Giovinetto, 1991; Reference Jacobs, Hellmer, Doake, Jenkins and FrolichJacobs and others, 1992; Reference Budd and WarnerBudd and Warner, 1996), atmospheric (e.g. Reference Genthon and BraunGenthon and Braun, 1995; Reference Ohmura, Wild and BengtssonOhmura and others, 1996b; Reference Bromwich, Cullather and Van WoertBromwich and others, 1998) and other geophysical phenomena (e.g. Reference Conrad and HagerConrad and Hager, 1995; Reference James and IvinsJames and Ivins, 1997; Reference Bentley and WahrBentley and Wahr, 1998). In this study we present a new distribution of accumulation, excluding the area of Graham Land, Larsen Ice Shelf and eastern Palmer Land represented by drainage systems (25–27) (Fig. 1).
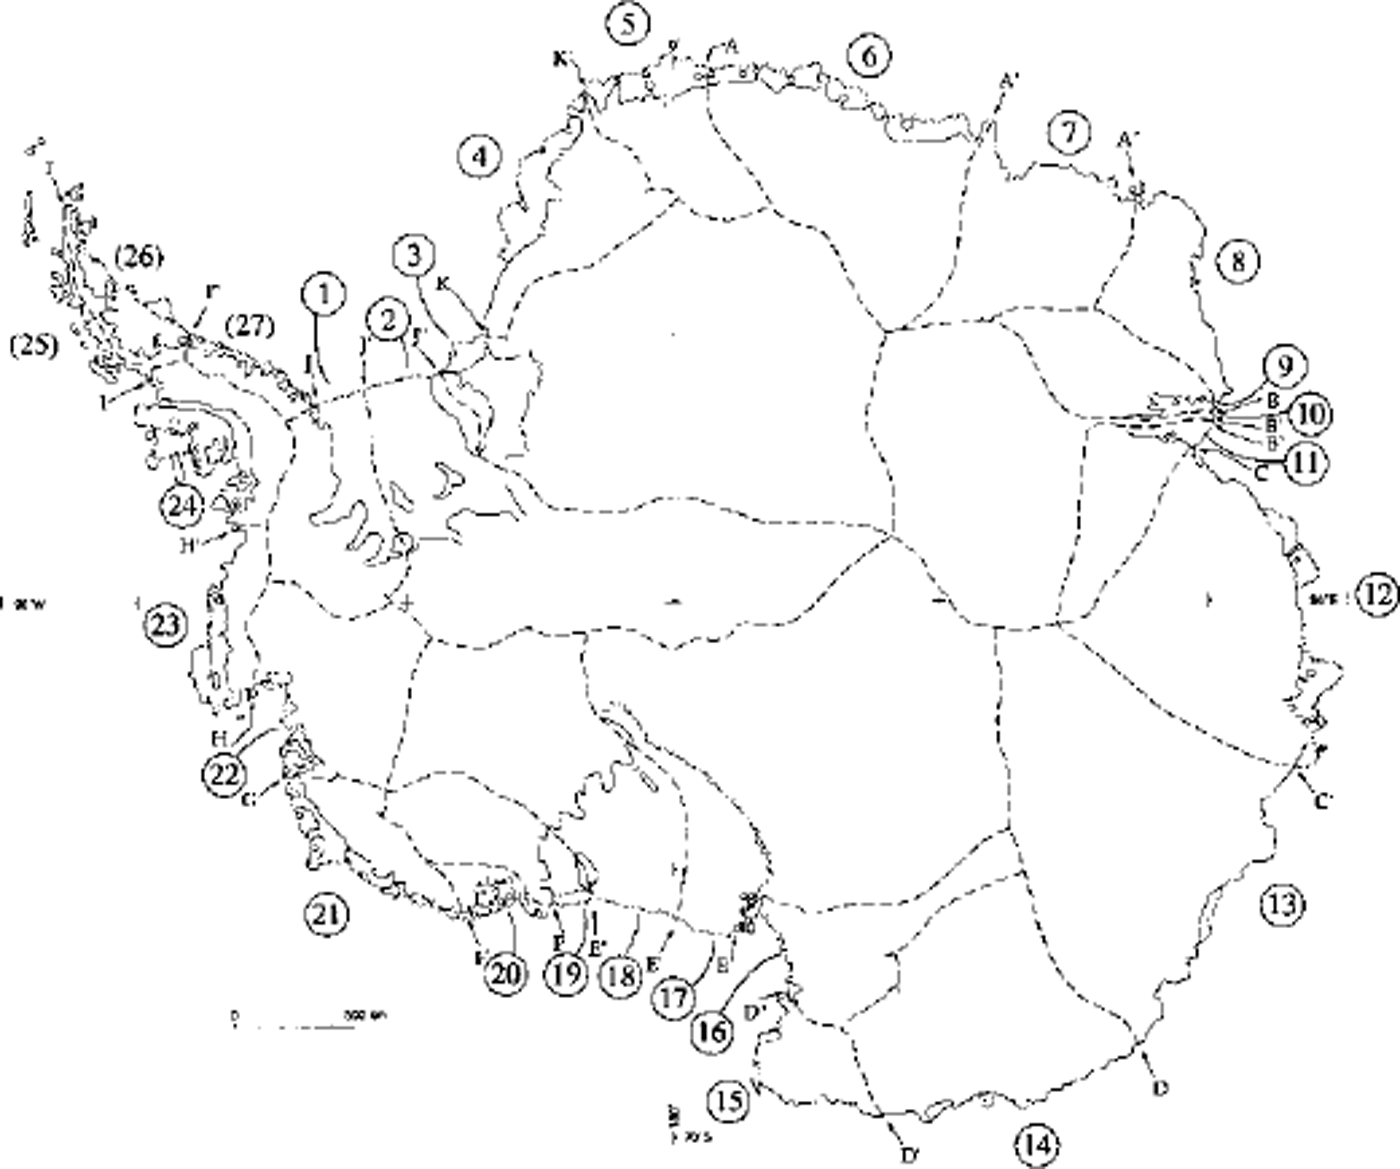
Fig. 1. Antarctica, showing a delineation of drainage divides (Reference Giovinetto and BentleyGiovinetto and Bentley, 1985) and drainage-system designation. The area of systems (25–27) is not included in this study, and systems 9–11 are treated as one. SectorJ-Kand E-F correspond to the Filchner-Ronne and Ross Ice Shelves, respectively
We estimate the mean rate of accumulation based on the new distribution, and compare it with the results obtained from the latest distribution prepared by Reference Vaughan, Bamber, Giovinetto, Russell and CooperVaughan and others (1999) using practically the same field data but different interpolation criteria. A first, direct comparison between our distribution and that of Reference Vaughan, Bamber, Giovinetto, Russell and CooperVaughan and others (1999) is made using a field of residuals described in a 50 km grid format. A second, indirect comparison between our distribution and that of Reference Vaughan, Bamber, Giovinetto, Russell and CooperVaughan and others (1999) is made by comparing estimates of accumulation for 24 drainage systems (systems 9–11 treated as one) relative to a third compilation (Reference Giovinetto and BentleyGiovinetto and Bentley, 1985). Reference Vaughan, Bamber, Giovinetto, Russell and CooperVaughan and others (1999) compared their estimates of mean accumulation for the grounded-ice area of each system as estimated by Reference Giovinetto and BentleyGiovinetto and Bentley (1985), and we make a similar analysis for our distribution. The direct and indirect comparisons show the extent to which our distribution and that of Reference Vaughan, Bamber, Giovinetto, Russell and CooperVaughan and others (1999) are largely coherent at the continental scale, but differ at the regional scale. Regional accumulation estimates are important in studies such as mass budget of particular systems (e.g. Reference Bentley, Giovinetto, Weller, Wilson and SeverinBentley and Giovinetto, 1991; Reference PattynPattyn, 1996; Reference RignotRignot, 1998) and validation of model output derived from atmospheric numerical analyses (e.g. Reference Genthon and BraunGenthon and Braun, 1995; Reference Ohmura, Wild and BengtssonOhmura and others, 1996b; Reference Bromwich, Cullather and Van WoertBromwich and others, 1998).
Accumulation at the Surface
Field-data compilation update
We expand a previous compilation of field data from approximately 1500 sites (Reference Giovinetto and BentleyGiovinetto and Bentley, 1985; Reference Giovinetto and BullGiovinetto and Bull, 1987) by adding data from approximately 500 sites (Reference Whillans and BindschadlerWhillans and Bindschadler, 1988; Reference GoodwinGoodwin, 1990; Reference Jenkins and DoakeJenkins and Doake, 1991; Reference Morgan, Goodwin, Etheridge and WookeyMorgan and others, 1991; Reference Goodwin, Higham, Allison and JiawenGoodwin and others, 1994; Reference GrafGraf and others, 1994; Reference Isaksson and KarlenIsaksson and Karlen, 1994; Reference Mosley-ThompsonMosley-Thompson and others, 1995; Reference Higham, Craven, Ruddell and AllisonHigham and others, 1997; Reference Richardson, Aarholt, Hamran, Holmlund and IsakssonRichardson and others, 1997; Reference Takahashi and WatanabeTakahashi and Watanabe, 1997; Reference Casassa, Brecher, Cardenas and RiveraCasassa and others, 1998; Reference Melvold, Hagen, Pinglot and GundestrupMelvold and others, 1998; Reference Venteris and WhillansVenteris and Whillans, 1998; Reference Van den BroekeVan den Broeke and others, 1999; personal communication from A. R. Ruddell, 1999). The latest comprehensive distribution of field-data sites is shown in Reference Vaughan, Bamber, Giovinetto, Russell and CooperVaughan and others (1999) based on a compilation of 1860 sites for the area of all 27 drainage systems. Overall, the field data are representative of mean accumulation values determined for periods of lyear to several decades from observations on strata accumulated approximately between 1940 and 1995. Therefore, spatial and temporal variations at local and regional scales should be noted (e.g. Reference Morgan, Goodwin, Etheridge and WookeyMorgan and others, 1991; Reference Mosley-ThompsonMosley-Thompson and others, 1995). We produce an isopleth pattern based on visual interpolation of field data (Fig. 2). Our criteria for drawing isopleths based on visual interpolation are described elsewhere (Reference Giovinetto and BentleyGiovinetto and Bentley, 1985; Reference Giovinetto, Waters and BentleyGiovinetto and others, 1990). In two areas we copied the visually interpolated isopleth pattern shown in the source publications rather than contour the data ourselves; we blended the pattern drawn by Reference Takahashi and WatanabeTakahashi and Watanabe (1997) for the sector 20–50° E, north of 75° S, and by Reference Higham, Craven, Ruddell and AllisonHigham and others (1997) and A. R. Ruddell (personal communication, 1999) for the Amery Ice Shelf drainage system (systems 9–11).
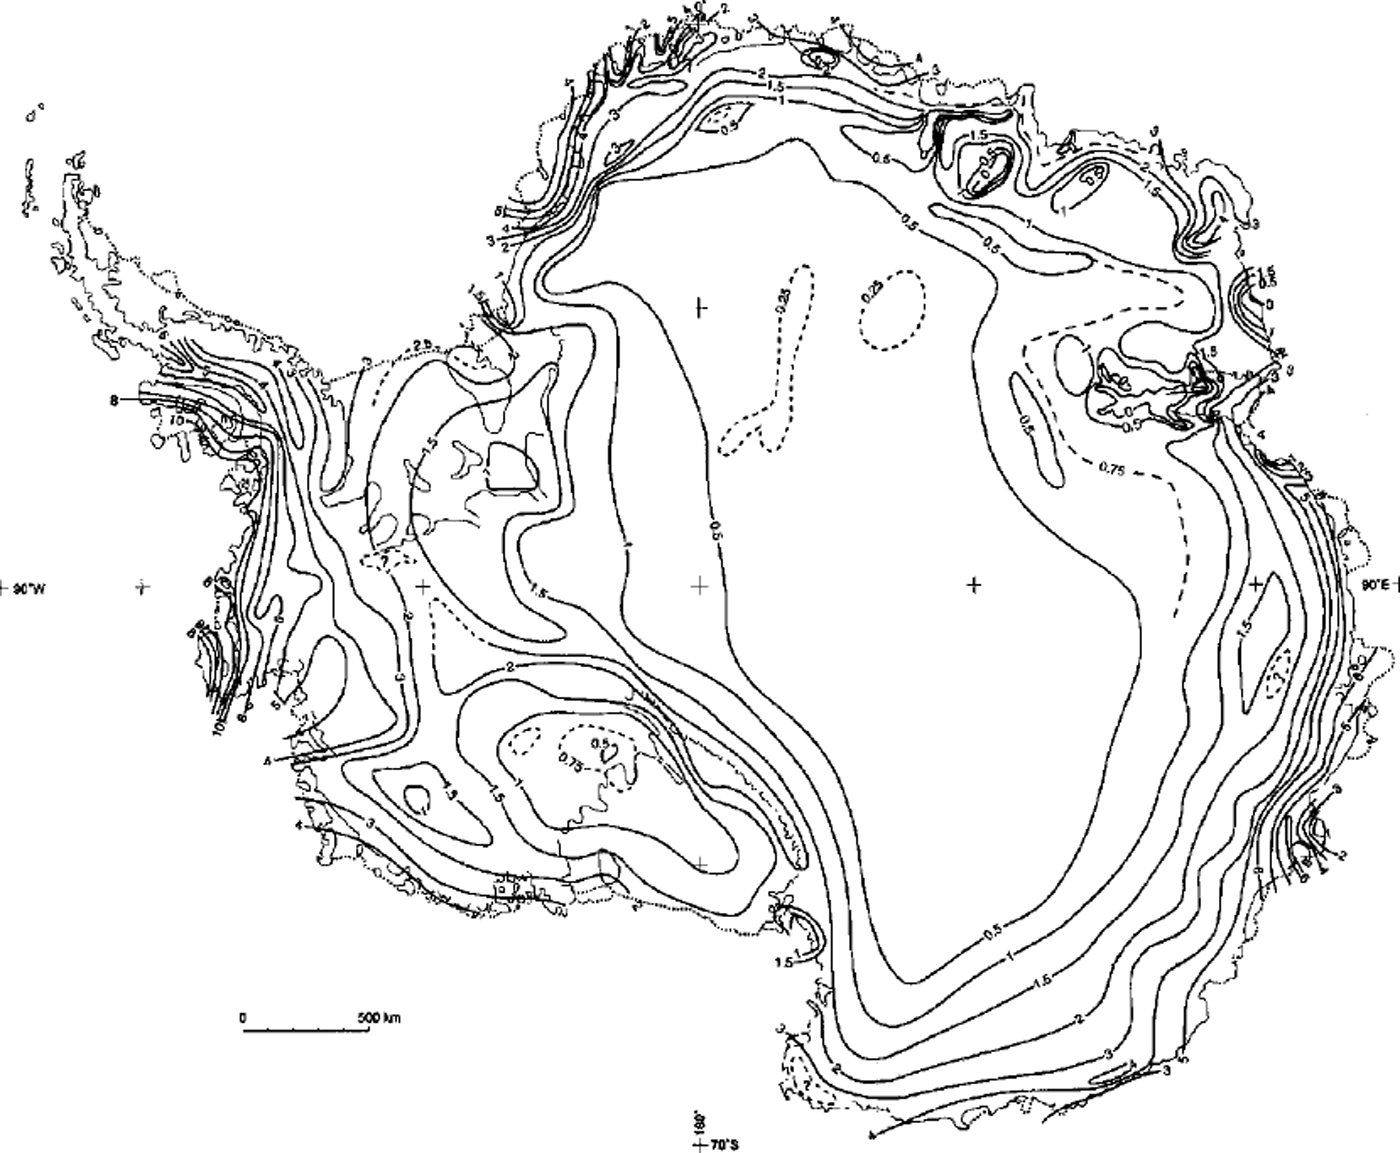
Fig. 2. Antarctica, showing the distribution of net accumulation at the surface (isopleths labeled in l00 kg m–2a–1 ). The isopleth pattern is visually interpolated on the basis of approximately 2000field-data sites.
Methodology and interpretative aspects
As an aid to the interpretation of the distribution shown in Figure 2, we comment on three aspects that are relevant to the results discussed later in this paper. The first aspect is the contrast between visual interpolation of field data to produce an isopleth pattern and thus describe a distribution, and interpolation of field data using computer-based approaches. Despite quantification of bivariate and multivariate relationships where accumulation is the dependent variable (e.g. Reference Chorlton and ListerChorlton and Lister, 1970; Reference Giovinetto, Waters and BentleyGiovinetto and others, 1990), visual interpolation is largely subjective (e.g. Reference Giovinetto and BentleyGiovinetto and Bentley, 1985; Reference Higham, Craven, Ruddell and AllisonHigham and others, 1997; Reference Takahashi and WatanabeTakahashi and Watanabe, 1997). Interpolation using computer-based approaches is reliable, particularly in the sense that subjectivity is reduced (e.g. Reference Vaughan, Bamber, Giovinetto, Russell and CooperVaughan and others, 1999), but so is sensitivity to regional differences (e.g. differences in tropospheric circulation and surface air flow which affect water-vapor advection and blowing-snow transport, respectively). Nevertheless, interpolation by any known method is unreliable for areas characterized by sparse data or physiographic complexity, such as relatively narrow zones adjacent to segments of coast, grounded or floating ice terminus, and grounding lines, as well as mountain regions.
The second aspect is the treatment of field data for approximately 60 sites (Reference Giovinetto, Bentley and BullGiovinetto and others, 1989) that, relative to the cumulative total of approximately 2000 sites, represent 3% of the whole dataset and ω10% of data obtained using the so-called stratigraphic method. The data for the approximately 60 sites are not considered in the drawing of isopleths, because they are incompatible with other datasets produced using different methods for the same areas. This exclusion of data from the interpolation process involves datasets in which multi-year mean accumulation values were determined using the stratigraphic method exclusively as opposed to determinations based on other methods such as stable isotopes, gross beta activity and stake measurements, or combinations of any of these including the stratigraphic method. In the areas where the accumulation values determined using the stratigraphic method alone were subsequently shown to be different from values determined by other methods, the stratigraphic method generally produced values that were larger by a factor of 2 (i.e. the difference is much larger than any expected temporal variability of multi-year mean values). Examples of areas for which newer reliable accumulation data have become available are the central and western sectors of the Filchner-Ronne Ice Shelf (Reference Jenkins and DoakeJenkins and Doake, 1991; Reference GrafGraf and others, 1994), and the area centered along approximately 135° W between 81° and 84° S (Reference Whillans and BindschadlerWhillans and Bind-schadler, 1988; Reference Venteris and WhillansVenteris and Whillans, 1998). In other areas the uncertainties presented by incompatible datasets remain an issue (e.g. the areas centered approximately at 78° S, 103° Wand 78° S, 140° E; these are discussed in a following section).
The third aspect is the implementation of ˚deflation" and ˚ablation" adjustments estimated for the coastal zones that are applied to bulk net accumulation estimates (in Gta–1) for the whole area of the ice sheet or parts thereof, such as drainage systems (Reference Giovinetto and MellorGiovinetto, 1964b). The deflation adjustment includes the mass loss due to snow removal by wind and sublimation. The ablation adjustment includes the mass loss due to runoff and evaporation. By definition, net accumulation includes these loss terms, but the accumulation isopleth drawn for the coastal zone in small-scale maps cannot show the relatively small (of the order of 10 km2 or less) but widespread deflation and ablation patches. A summary of the observed sporadic area and time distributions of the patches is found elsewhere (e.g. Reference GiovinettoGiovinetto, 1964a, Reference Giovinetto and Mellorb). The affected sectors of the coastal zone are characterized by surface slope gradient >1 % and elevation ≤1000m, extending inland from grounded ice termini to 50–100 km in the case of deflation patches, and to 10–20 km in the case of ablation patches. Areas with those characteristics also extend inland from grounding lines in some sectors. As the adjustments are estimated independently of the area integration of the accumulation rate, the adjustments do not modify the distribution as shown on a map. Therefore the adjustments should not be implemented in a comparison of distributions. However, the implementation must be included in a comparison of estimates of bulk and mean accumulation values.
In the estimate of accumulation that follows, we implement the adjustments as listed in apreceding study (Reference Giovinetto and BentleyGiovinetto and Bentley, 1985). The deflation adjustment (117 Gt a–1) is based on half the area of each sector times the rate of accumulation indicated by the isopleth pattern shown for the sector. It should be considered an upper-limit estimate of the mass reductionbecause the literature on which the estimate criteria are based (Reference GiovinettoGiovinetto, 1964a, b) would also support assumptions based on half the area and half the indicated accumulation rate, thus reducing the estimate to approximately 59 Gt a"1.The ablation adjustment (14 Gt a–1) is based on half the area of each sector times the rate of accumulation indicated by the isoplethpattern shown for the sector. All sectors to which the ablation adjustment applies are already included in sectors to which the deflation adj ustment applies. Therefore, the combined adjustments bring the accumulation rate to zero (i.e. no netmassloss). In this context,theablation adjustment shouldbe considered a lower-limit estimate, and larger estimates could be made (e.g. 28 Gt a ). However, because of the sparsity of deflation- and ablation-rate measurements, more definitive estimates do not seem to bejustified. As implemented by us, the combined adjustments (131 Gt a–1) are equivalent to a reduction of the mean accumulation over the ice sheet of approximately l0 kg m–26 a–1. Implementation of the deflation and ablation adjustments produces some of the lowest estimates of accumulation available in the literature (the latest survey of accumulation estimates is summarized in Reference Vaughan, Bamber, Giovinetto, Russell and CooperVaughan and others (1999)). Differences in criteria used in the contouring of field data, or exclusion of parts of them, are less significant. The adjustments are listed for each drainage system (Reference Giovinetto and BentleyGiovinetto and Bentley, 1985) and therefore can be alternately modified or ignored by simple tabulation. Detailed information on surface topography, mass- and energy-exchange processes, katabatic flow and surface temperature and melting could be combined to improve the criteria and redefine the sectors (e.g. Reference KobayashiKobayashi, 1978; Reference Parish and BromwichParish and Bromwich, 1991; Reference ComisoComiso, 1994, Reference Comiso2000; Zwally and Fegles, 1994; Reference Van den Broeke and BintanjaVan den Broeke and Bintanja, 1995; Reference Williams, Ferrigno, Swithinbank, Lucchitta and SeekinsWilliams and others, 1995; Reference Van den Broeke, van de Wal and WildVan den Broeke and others, 1997).
Estimates of bulk and mean accumulation
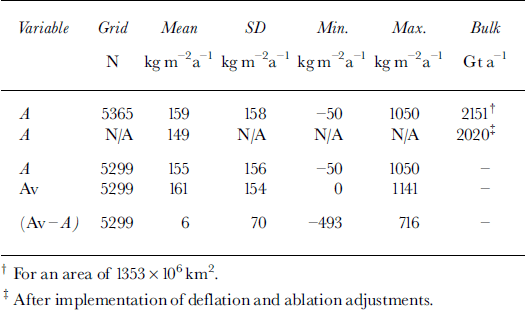
The isopleth pattern shown in Figure 2 is sampled in a 50 km grid (Fig. 3a) to estimate accumulation based on the new distribution. The gridpoint locations correspond to intersections between gridlines parallel to meridians 90° W to 90° E and gridcolumns parallel to meridians 0–180° on a polar stereographic projection map with standard line at 71° S. The accumulation value for each gridpoint location (A, in kg m–2 a–1 ) is obtained by visual interpolation from the isopleth pattern. The grid dataset (N = 5365, where N is the number of gridpoints) includes ice-shelf areas known to have calved; this is to maintain coherence in data representation because important field data would otherwise appear to correspond to open-ocean areas (e.g. in the northeast regions of the Filchner-Ronne and Ross Ice Shelves (e.g. Reference FerrignoFerrigno and others, 1996)). The grid dataset is assembled without information as to whether a peripheral gridpoint should be allocated all of the nominal area of a grid square (i.e. the area of a square centered on each gridpoint location is 2500 km2), or more or part of one, depending on the point location relative to the coastline. This omission does not introduce a significant difference in the measurement of area as well as in the integration of accumulation, because the actual under- and overestimates involving peripheral gridpoints are assumed to balance out. However, the database includes the area scale factor derived for each gridpoint square corresponding to the polar stereographic projection with standard line at a latitude of 71° (derived from Reference PintherPinther, 1975). The use of the area scale factor allows an approximation to the result that would be obtained using an equal area projection. The dimension of the factor applicable to the 50 km grid ranges from 0.951 to 1.041, with a mean value of 1.009; the total area is 13.53 × 10⁶ km2 (Fig. 3a; Table 1). The estimate of net accumulation for this area is 2151 Gt a"1 for a mean of 159 kg m–2 a–11; following the implementation of deflation and ablation adjustments described above, these values are reduced to 2020 Gt a"1 and 149 kgm–2a–1 6 1 . These unadjusted and adjusted estimates are considered to be preliminary because coarse-grid sampling is not as sensitive as detailed area integration of the rate. The composite error in estimates based on detailed integration has been assessed between ± 5% (Reference Vaughan, Bamber, Giovinetto, Russell and CooperVaughan and others, 1999) and ±10% (Reference Giovinetto and BentleyGiovinetto and Bentley, 1985); coarse-grid sampling increases the error by a few percentile (an example is described in a following section).

Fig. 3. Antarctica, showing distributions based on 50 km grid datasets. (a) Net surface accumulation, A, in kgm–2a–1 (N =5365) visually interpolated from the isopleth pattern shown in Figure 2 (b) Net surface accumulation, Av, in kgm–2a–1 (N =5299) obtained from Reference Vaughan, Bamber, Giovinetto, Russell and CooperVaughan and others (1999) (personal communication from D. G. Vaughan, 1999). (c) Residual (Av-A), in kgm–2a–1 (N = 5299).
Table 1. Summary of accumulation data and estimates
Comparison of Results
We compare the distribution of net accumulation shown in Figure 2 with that presented in a previous compilation based on practically the same field data but different criteria of interpolation (Reference Vaughan, Bamber, Giovinetto, Russell and CooperVaughan and others, 1999). For this purpose we were provided with data for the same set of gridpoint locations (Av, in kg m–2a–1 ) (personal communication from D. G. Vaughan, 1999) (Fig. 3b). The number of gridpoint locations for which Av data (N = 5299) could be paired to A data is smaller because the compilations are produced using different base maps (i.e. different projections and coastline compilations). There is strong correlation between Av and A (coefficient of correlation, R = 0.897; root-mean-square residual, rms = 68), confirming the visually evident coherence between the two distributions at the continental scale. However, it is important to identify differences at the regional scale. Our first approach examines a field of accumulation residuals between the distributions, and our second approach examines differences in estimates of accumulation for drainage systems.
Based on accumulation residuals
The difference between the mean values of Av and A (161 and 155 kg m–2 a–1 6 1 , respectively) is 6 kg m–2a–1, and the standard deviation SD = 70 kgnTV1 (Fig. 3c). Residual values are ω1 SD for 3486 gridpoint locations or approximately 66% of the sample. The locations with values in this range are widespread throughout the interior of the grounded ice sheet in both East and West Antarctica as well as on large areas of the Ross and Filchner-Ronne Ice Shelves. This part of the residual field substantiates the overall general agreement between the distributions referred to above. Residual values are >2 SD for 306 gridpoint locations or approximately 6% of the sample; most of these locations are in mountainous areas or along relatively narrow zones along either the coast or the grounding line, i.e. where the Av and A values are least reliable.
In the remaining area sampled by 1507 gridpoint locations or approximately 28% of the sample, there are three regions where concentrations of residual values in the range 75–125kgm–2–a–1 1 are observed. The concentrations of positive residuals centered at 78° S, 140° E and 78° S, 103° W are readily explained by our exclusion of data considered to be incompatible with other data for the same region (as mentioned above). The concentration of positive residuals centered at 76.5° S, 13° E might be explained by our lack of full information for the region; Reference Vaughan, Bamber, Giovinetto, Russell and CooperVaughan and others (1999) show some data sites in the sector 30° W to 7°E, north of 80° S, that due to oversight are not included in our field-data compilation. Furthermore, the positive residuals in the three regions could be the result, at least in part, of Reference Vaughan, Bamber, Giovinetto, Russell and CooperVaughan and others (1999) using an independent background field to control the interpolation of field data in areas where these are sparse. The field is partially defined by a hyperbolic function of microwave emissivity (Reference Zwally and GiovinettoZwally and Giovinetto, 1995) using a single set of coefficients throughout its application. We believe that the function should be defined using a minimum of two alternate sets of coefficients if it is to reliably aid in the interpolation process over the full range of accumulation observed in Antarctica (Reference Zwally and GiovinettoZwally and Giovinetto, 1995).
Based on accumulation estimates for drainage systems
A comprehensive comparison between the distributions of accumulation presented in Reference Vaughan, Bamber, Giovinetto, Russell and CooperVaughan and others (1999) and in this study at drainage-system scale is beyond the scope of this study, as it would require detailed discussion of the composite error in the two estimates for each drainage system. Nevertheless, an indirect comparison is possible using estimates of accumulation for drainage systems relative to a third compilation (Reference Giovinetto and BentleyGiovinetto and Bentley, 1985; hereinafter referred to as the 1985 compilation). The first assessment of deviations relative to the 1985 compilation is based on detailed area integration of the rate for the conterminous grounded-ice area of each system reported by Reference Vaughan, Bamber, Giovinetto, Russell and CooperVaughan and others (1999). The second assessment of deviations relative to the 1985 compilation is based on coarse-grid sampling completed by us in the process of collating a multivariate 100 km grid database for the whole area of each system (grounded ice and ice shelf).
In the comparison with the 1985 compilation, Reference Vaughan, Bamber, Giovinetto, Russell and CooperVaughan and others (1999) listed results for 22 systems (systems 9–11 treated as one) (Table 2; Fig. 4). The estimates listed for the 1985 compilation correspond to values reduced by the implementation of deflation and ablation adjustments (described above). As the comparison included changes of area, we summarize the accumulation changes using bulk estimates (mean rate times the area), which were reported to be between (-)21% and 58% (Reference Vaughan, Bamber, Giovinetto, Russell and CooperVaughan and others, 1999). The composite error estimate for each of the two compilations (i.e. ± 5% (Reference Vaughan, Bamber, Giovinetto, Russell and CooperVaughan and others, 1999) and ±10% (Reference Giovinetto and BentleyGiovinetto and Bentley, 1985)) suggest that differences ≥ ±11% identify systems for which the indicated changes are larger than the sum of the errors (treated as standard errors). This is a cursory assessment of ˚uncertainty" to serve as a guideline in identifying outstanding differences, and not a substitute for an assessment of errors to determine statistical significance. Its use identifies 16 of the 22 systems.

Fig. 4. Deviations in estimates of mean net accumulation at the surface for drainage systems 1–24 (systems 9–11 treated as one; Fig 1) relative to a preceding distribution (Reference Giovinetto and BentleyGiovinetto and Bentley, 1985). Deviations listed in Reference Vaughan, Bamber, Giovinetto, Russell and CooperVaughan and others (1999)forthegrounded-iceareaofeachsystem(redtriangles) modified in this study to assess the differences in distribution ( Table2) are shown by green squares. Deviations indicated m this study for the grounded-ice and ice-shelf areas of each system (Table 3) are shown by black triangles.
Table 2. Comparison of accumulation estimates (grounded-ice area)
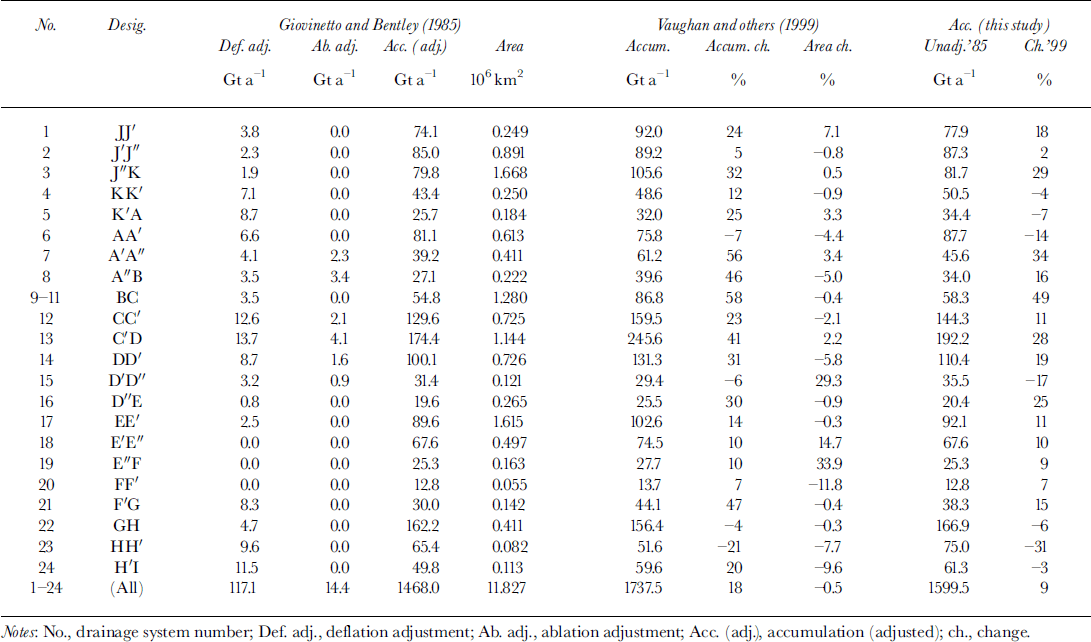
Table 3. Comparison of accumulation estimates (whole area)
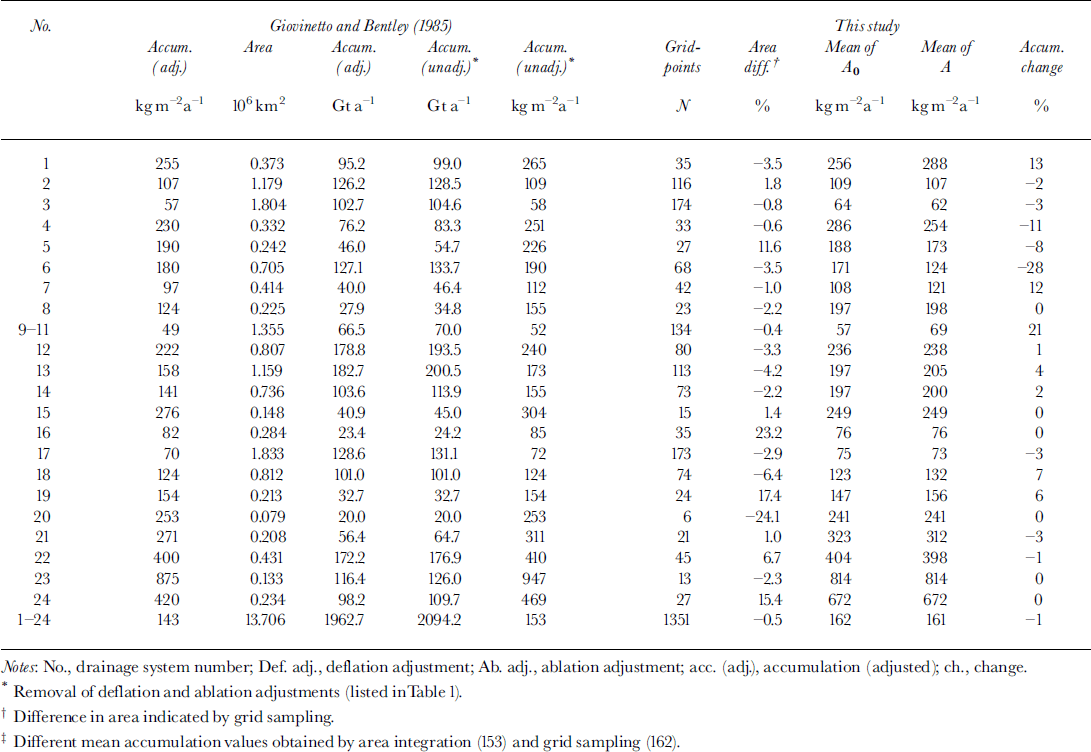
However, we are interested in assessing differences between the distributions as shown on maps rather than differences involving adjustments applied after area integration. For this purpose we modify the comparison reported by Reference Vaughan, Bamber, Giovinetto, Russell and CooperVaughan and others (1999) by removing the deflation and ablation adjustments listed in the 1985 compilation, all of which apply only to the coastal area of the conterminous grounded ice. Thus modified, the overall change in accumulation for the conterminous grounded ice sheet is reduced to 9% from the 18% reported in Reference Vaughan, Bamber, Giovinetto, Russell and CooperVaughan and others (1999). On this basis, the comparison indicates deviations of accumulation between (-)31 % and 49% (a range of 80 percentile), with deviations ≥ ±11% listed for 14 systems. The deviations are due, in part, to new estimates of area for each system. The change in the estimate of total grounded-ice area relative to the 1985 compilation is small (–0.5%), but the changes indicated for particular systems are between ()12% and 34%, with changes between (-)10% and 7% listed for 18 systems. These changes include probable errors in the estimate of area for each system as listed in the 1985 compilation and, more importantly, changes in the delineation of drainage divides using proprietary software applied in the analysis of updated surface topography based on European remote-sensing satellite (ERS-1) radar altimeter data (Reference Vaughan, Bamber, Giovinetto, Russell and CooperVaughan and others, 1999).
We summarize the results of a comparison between the distributions shown in Figure 2 and in the 1985 compilation, in this case for the whole area of each system, and treating systems 9–11 as one to make it easier to contrast the results (Table 3). We did not revise the delineation of drainage divides as shown in the 1985 compilation, and produced accumulation datasets based on 100 km grid sampling of the two distributions. The gridpoint locations (N = 1351) match corresponding gridpoint locations in the 50 km grid described above. The 100 km grid sampling of the whole area of each of the 24 systems in the 1985 compilation indicates a mean accumulation of 162kgm–2a––1 (Table 3) that is 6% larger than the mean obtained by detailed area integration of the rate (153 kg m–2–a–1) , and which is closer to the mean obtained by 50 km grid sampling (159 kg m–2σ–1 ; Table 1). The combined uncertainty applicable to our comparison is assessed at ±16% on the basis of the composite error of ±10% (Reference Giovinetto and BentleyGiovinetto and Bentley 1985) allocated to each of the compilations, and an error of ± 6% also allocated to each compilation because the estimates are produced by coarse-grid sampling. Our comparison indicated deviations in accumulation estimates between (-)27% and 21% (a range of 48 percentile), with changes ≥ ±16% listed for only two systems; for perspective, it may be noted that even using the error assessed for the preceding comparison (±11%) would have identified five systems, i.e. also a relatively small number.
Coarse-grid sampling produces a first-approximation estimate of area for each system (the nominal area allocated to each gridpoint is 10 000 km2 adjusted for projection deformation using the area scale factor). Changes in area relative to those listed in the 1985 compilation for systems 20 (–24%) and 16 (23%) are larger than the difference that would be expected from coarse-grid sampling, although the area of those systems is relatively small, and a few gridpoints just outside or inside the divide would introduce a large difference. Nevertheless, the differences might indicate measurement errors that can be traced back to an earlier compilation (Reference Giovinetto and MellorGiovinetto, 1964b). The differences indicated for the other 20 systems are between (-)6% and 17%. We intend to revise the measurements of area for each system following a new delineation of drainage divides based on ERS-1 radar altimeter data, but at present we are not fully satisfied with results obtained by applying hydrological modeling tools.
Summary and Conclusions
The clear contrast between the findings of the two separate comparisons of the distributions produced by Reference Vaughan, Bamber, Giovinetto, Russell and CooperVaughan and others (1999), and in this study, with the 1985 compilation is defined by three aspects. The first, already noted, is the number of systems showing accumulation changes that are larger than the combined uncertainty in each comparison (14 systems in the comparison by Reference Vaughan, Bamber, Giovinetto, Russell and CooperVaughan and others (1999) as modified in this study, vs two systems in our comparison). The second aspect is the difference in the range of the changes indicated by each comparison (a range of 80 percentile between (-)31% and 49% in the comparison of Reference Vaughan, Bamber, Giovinetto, Russell and CooperVaughan and others (1999) as modified in this study, vs a range of 48 percentile between (-)27% and 21% in our comparison). Only a small part of the difference in the range could be explained by changes in area due to the new delineation of drainage divides as shown in Reference Vaughan, Bamber, Giovinetto, Russell and CooperVaughan and others (1999).
The third aspect is the disparity between the changes indicated by each comparison for particular systems, and which range from 1 percentile for system 5, to 28 percentile for systems 9–11. Part of the disparity noted for a particular system is explained by the fact that the indicated changes are, one for the grounded-ice area, and the other to the whole area, of each system. In this context, it should be noted that the disparity is relatively small for the four systems with the largest ice-shelf areas (1, 2,17 and 18; respectively, the western and central Filchner-Ronne Ice Shelf systems and the western and central Ross Ice Shelf systems). Nevertheless, this physiographic difference introduces a new component of uncertainty, which we assume is of the same magnitude as the other components (say ±10%). Thus, we assess the overall uncertainty applicable to the discussion of disparities as the sum of those pertaining to each comparison (i.e. ±11% and ±16%) plus ±10%, and suggest that any disparity of 22 percentile or larger identifies systems where the differences between the distributions are substantial. This is noted for six systems (3, 7, 9–11,13,16 and 23). Some of these disparities may be explained, in part, by aspects already discussed (e.g. systems 3,16 and 23 include all or relatively large parts of the regions showing concentration of residual values in a particular range (i.e. centered, respectively, at approximately 76.5° S, 13° E; 78° S, 140° E; and 78° S, 103° W)). Collectively, the six systems noted for large disparities comprise (relative to the estimated values listed in the 1985 compilation for the whole area including ice shelves) approximately 4/10 of the ice-sheet area and 3/10 of the accumulation. The implicit differences of accumulation indicated by the two distributions for all or part of the area of each of those systems are relevant to studies such as mass-budget estimates and the validation of model output derived from atmospheric numerical analyses.
Acknowledgements
The authors acknowledge the contributions of D. Vaughan and C. Conrad who provided sets and subsets for the databases, and M. Beckley and J. Saba for computation and graphics.



