


Introduction
High-latitude glaciers that accumulate solid precipitation year-round with minimal melting offer the possibility to reconstruct past atmospheric chemistry, air-pollution history and climate. Aerosols including sulphate are integrated into the snowpack as snowflake nuclei and by dry deposition. The sulphate ion is chemically inert under snowpack and glacier conditions, and its isotope ratios are preserved, enabling insight into atmospheric processes and changes over time.
There is major interest in the biogeochemical cycle of atmospheric sulphur in the context of global change. The cycle is complex, it has a significant role in radiative forcing, and aspects such as the role of biogenic emissions on the sulphur cycle are poorly understood. In the Arctic, sulphate derived from gases released to the atmosphere as a consequence of grazing and decay of ocean phytoplankton may be related to negative climatic feedbacks and to sea-ice extent. This was first proposed by Reference Charlson, Lovelock, Andreae and WarrenCharlson and others (1987) as the CLAW hypothesis (named after the initials of the authors who first proposed the hypothesis) which suggests a negative feedback to global warming via dimethylsulphide (DMS) sulphate. Marine phytoplankton and algae release a sulphur compound, dimethylsulfonioproprionate or DMSP, during cell lysis. Enzymatic cleavage of DMSP releases a volatile sulphur compound DMS into the water column where it may be oxidized, consumed, or released to the atmosphere (Reference AndreaeAndreae, 1990). Only a few percent of the total DMS in the water column escapes to the air, where it can be oxidized on the surface of particles to form low-volatility methanesulphonate (MSA) or undergo reactions in the gaseous phase to form sulphur dioxide and then sulphate. These fine aerosols scatter incident solar radiation back to space, in addition to affecting the prevalence and radiative properties of clouds (Reference von Glasow and Crutzenvon Glasow and Crutzen, 2004). Current negative radiative forcing by both natural and anthropogenic sulphate is estimated to approach or exceed the magnitude of the positive forcing of greenhouse gases (Reference HoughtonHoughton and others, 2001). Increased temperatures in the Arctic and open leads and coincident decreases in sea-ice extent are expected to result in increased Arctic Ocean productivity if the CLAW hypothesis applies (Reference Rigor and WallaceRigor and Wallace, 2004). Measurements to define DMS sulphate flux are valuable tools which can be used to help evaluate whether the CLAW hypothesis applies in the Arctic as it experiences rapid climate change.
The altitude at which aerosols form from DMS oxidation is an important consideration with respect to their impact on climate forcing. If the majority of non-sea-salt sulphate is formed and is present at lower altitudes, this has implications for atmospheric chemistry as well as cloud formation. Clouds formed at low altitudes could alter vertical temperature gradients and act as an effective barrier to outgoing infrared radiation, resulting in increased Arctic surface temperatures as compared to clouds formed higher in the troposphere. The purpose of this study is to further our understanding of snowpack sulphate changes with elevation and to quantify seasonal variation of sulphate isotopes on the Prince of Wales (POW) Icefield, Ellesmere Island, Canada. Since little work has been done to date with sulphate from high-Arctic snow, these data provide baseline information about sulphate sources in the Arctic. A significant proportion of aerosol sulphate in Arctic snow has a marine biogenic origin (Legrand, 1995, Reference Legrand1997), but this has been difficult to quantify. Sulphate stable isotopes have the potential to identify isotopically distinct source contributions to snowpack sulphate and to quantify more definitively the biogenic proportion of snowpack sulphate. Previous work using stable isotopes of sulphate to infer sources and oxidation processes includes Reference Patris, Jouzel and DelmasPatris and others (2000, Reference Patris2002), Reference Alexander, Savarino, Barkov, Delmas and ThiemensAlexander and others (2002, Reference Alexander, Thiemens, Farquhar, Kaufman, Savarino and Delmas2003, Reference Alexander, Savarino, Kreutz and Thiemens2004), Reference Savarino, Bekki, Cole-Dai and ThiemensSavarino and others (2003a, b) and Reference Jonsell, Hansson, Morth and TorssanderJonsell and others (2005). To our knowledge, this study is the first examination of sulphate sources using δ34S in an Arctic snowpack.
If sulphate isotopes can help determine source apportionment, they offer a new tool, complementary to ion chemistry, for identifying the geographic origins of moisture and the seasonality of precipitation at a site. Seasonal and spatial variability in air mass and vapour provenance need to be understood in ice-core-based climate reconstructions. For instance, paleotemperature inferences based on ice-core δ18O and δD values (e.g. Reference Koerner and FisherKoerner and Fisher, 1990; Reference Grootes, Stuiver, White, Johnsen and JouzelGrootes and others, 1993) are subject to uncertainties due to varying seasonality of precipitation and vapour source region (e.g. NorthGRIP members, 2004). Improved understanding of δ34S variations will therefore refine ongoing ice-core studies in the Canadian high Arctic, including two high-resolution ice cores spanning the last several millennia that were acquired from the POW Icefield in spring 2005. Because of the sensitivity of δ34S to marine biogenic sources, we hypothesize that δ34S may serve as a proxy of regional open-water (hence, sea-ice) conditions. For snow samples and ice cores on the POW Icefield, this will reflect sea-ice conditions in Baffin Bay, the dominant source of moisture for the region (Reference KoernerKoerner, 1979). If we are able to tie δ34S to open-water conditions, δ34S will offer a valuable new proxy for ice-core-based sea-ice reconstructions extending beyond the historical record. Results presented here offer preliminary insight into the controls and variability of δ34S, and its potential as a paleoenvironmental proxy in the Canadian high Arctic.
Sulphate isotopes
Isotope mass variation results in different reaction rates during physical, chemical and biological processes, producing isotope fractionation. Isotope ratios of compounds in nature deviate from average values often in predictable ways, providing information about the origin of compounds and their biogeochemical history. The ratio of the most abundant sulphur stable isotopes, 34S and 32S, is used for sulphur isotopic analysis. Variations in isotope abundance ratios are very small and difficult to measure. To ensure consistency over time within a laboratory and to enable comparison between laboratories, isotope abundance is measured relative to an international standard reference: Vienna Canon Diablo Troilite (V-CDT) is the standard used for sulphur.
in parts per thousand (%).
Sulphate sources to the high Arctic
The isotope ratio of sulphate in Arctic snow represents all natural and anthropogenic sources. Major sulphate sources to the Arctic atmosphere include anthropogenic pollutants from long-range transport (with low positive δ34S values), volcanic emissions which are expected to be characterized by low positive δ34S values (Reference Nielsen, Krouse and GrinenkoNielsen and others, 1991), and marine sources (sea-salt and marine biogenic) which have high positive δ34S values (Reference Calhoun, Bates and CharlsonCalhoun and others, 1991). Interpretation is strengthened by using ion chemistry along with meteorological and glaciological data. Lithic sources are generally not considered a major contributor to soluble sulphate. However, there is the potential for influence from marine evaporates (δ34S = +10 to +35%) which outcrop near the field site (Reference Nielsen, Krouse and GrinenkoNielsen and others, 1991). Long-range transport of anthropogenic pollutants in the Arctic follows seasonal cycles that are influenced by solar radiation and synoptic air-mass motion (Reference Sirois and BarrieSirois and Barrie, 1999). Arctic haze studies have shown pollution transport into the north is mainly from Eurasian sources and has a strong seasonal cycle (Reference Sharma, Lavoué, Cachier, Barrie and GongSharma and others, 2004). Atmospheric concentrations of sulphate are 10−20 times higher from January to April (peaking in February-March) than in summer (Reference Sirois and BarrieSirois and Barrie, 1999). At polar sunrise, substantive chemical changes occur in the Arctic atmospheric boundary layer as a result of photochemical reactions and heterogeneous reactions of gases with aerosols, snow in the atmosphere and snow on the ground. These include the oxidation of sulphur dioxide to sulphate (Reference Toom-Sauntry and BarrieToom-Sautry and Barrie, 2002). Little isotope selectivity is anticipated on oxidation under present atmospheric conditions, although this may not have been the case during glacial periods (Reference Saltzman, Brass and PriceSaltzman and others, 1983; Reference Alexander, Thiemens, Farquhar, Kaufman, Savarino and DelmasAlexander and others, 2003; Reference Norman, Belzer and BarrieNorman and others, 2004). The proportion of anthropogenic sulphate (with δ34S = +3 to +7%) (Reference Nriagu, Coker and BarrieNriagu and others, 1991; Reference McArdle, Liss and DennisMcArdle and others, 1998; Reference NormanNorman and others, 1999; Reference PatrisPatris and others, 2002) increases through the fall and winter to peak in spring snow.
Sea-salt (δ34SSS = +21 %) and marine biogenic sulphate, which contribute significantly to the sulphate content of Arctic snow, also follow seasonal cycles. A conservative estimate of the marine biogenic contribution using δ34SDMS = +19.5% is based on research of Reference Patris, Jouzel and DelmasPatris and others (2000) (δ34SDMS = +18.6%±0.9%). Biogenic compounds peak in the spring and summer, when northern oceans are highly productive (Reference Li, Barrie and SiroisLi and others, 1993). Sea-salt aerosols peak in the late autumn and winter (Reference Sirois and BarrieSirois and Barrie, 1999). The contribution to the Canadian Arctic by volcanic degassing is unknown (Reference Newman, Krouse, Grinenko, Krouse and GrinenkoNewman and others, 1991). Although the range in δ34S values for the anthropogenic and volcanic component could be quite large, long-term measurements of aerosol sulphate at Alert, Canada, during winter months can be used as a proxy. On average, δ34S values for aerosol sulphate in winter do not vary by more than ∼ 1%. (Reference Nriagu, Coker and BarrieNriagu and others, 1991; Reference Li, Barrie and SiroisLi and others, 1993; Reference NormanNorman and others, 1999). Since anthropogenic and volcanic sulphur have similar δ34S values and cannot be distinguished, the two are discussed together in this paper. A value of δ34SA = +4.3% (anthropogenic plus volcanic) was selected based on aerosol sulphate at Alert for the 2003 winter months (Norman and others, unpublished information).
Sampling
The field site on the POW Icefield is located at approximately 79˚ N, 76˚ W in the Canadian high Arctic (Fig. 1). POW is a large icefield (∼19000 km2) with a maximum elevation of 2300 m a.s.l. On the east side of the icefield, valley glaciers descend to sea level between mountainous ridges. Broad lobate glaciers form the west edge of the icefield and terminate terrestrially at 400−600ma.s.l. (Reference KoernerKoerner, 1979). The North Water polynya lies adjacent to POW in northern Baffin Bay, nestled between Greenland and Ellesmere Island (Reference Dunbar and DunbarDunbar and Dunbar, 1972; Reference SteffenSteffen, 1985). The extent of the North Water varies seasonally and interannually, with near-complete ice cover in early January and an area of open water increasing south of the Nares Strait ice bridge throughout the winter and spring (Reference Barber, Hanesiak, Chan and PiwowarBarber and others, 2001). In most years, the North Water is the only significant source of ‘local’ moisture for the POW Icefield from winter to mid-spring (January-May).
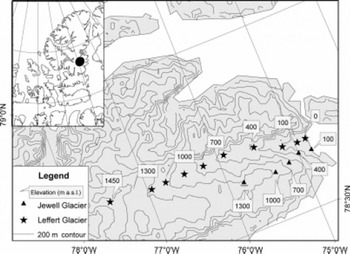
Fig. 1. Map showing sample site locations on Leffert and Jewell Glaciers, POW Icefield, Ellesmere Island.
High-resolution snow-pit samples were collected between 21 April and 10 June 2004 for isotopic and chemical analyses of fall 2003 to spring 2004 accumulation. Two transects in northeast POW (Fig. 1) were sampled in order to examine the relative influence of elevation vs distance inland on the transport and deposition of DMS oxidation products. Lower Leffert Glacier, with a low slope angle (∼2.3°), was sampled every 150 m in elevation between sea level and 1450 ma.s.l. The adjacent steeper-gradient Jewell Glacier was sampled every 300 m in elevation from 100 to 1300 ma.s.l. At each site, two sample suites were collected for each 10 cm depth interval. A 100 mL polyethylene bottle (dried, pre-cleaned five times with distilled deionized (18.2MQ) water) was filled with snow for ion-chemistry and water-isotope analysis. The second suite, collected in dried pre-cleaned 500 mL polyethylene bottles, and concentrated for sulphate isotope analysis, was also analyzed for ion concentration. Six litres water equivalent of each 10cm snow stratum were collected, melted and evaporated by boiling to <0.5 L. Stainless-steel pots, on propane-fueled stoves, sheltered in nylon tents, were used to melt and evaporate samples. Each sample took 4−5 hours to process. Distilled deionized water transported to POW from the University of Calgary stable-isotope laboratory was processed as a field blank. Sample bottles were sealed with Parafilm. Small-volume samples were kept frozen until analyzed. Large-volume samples were refrozen in the field, and then refrigerated until processed for analysis.
Analysis
Snow samples for sulphate isotope analysis were processed in class 100 clean-room conditions in the University of Calgary stable-isotope laboratory, and prepared for analysis as barium sulphate precipitated from concentrated snow-melt. Glassware used in the processing was soaked in 1% nitric acid for a minimum of 1 week and washed five times with distilled deionized water (18.2MΩ). Ion concentration values were based on the low-volume sample suite. δ34S values and discussion for the apportionment were based on the high-volume sample suite. The small-volume sample suite was kept frozen until the day before analysis, typically 3 months for ion chromatography (IC) and 13−16 months for inductively coupled plasma mass spectrometry (ICP-MS) analysis. The large-volume samples were refrigerated, 4−14 months at 4°C prior to preparation for sulphate isotopic analysis, 3−7 months for IC analysis and 16 months for ICP-MS analysis. Previous analyses have shown no change in the sulphate isotope composition for samples stored in this manner.
The δ34S of the barium sulphate was analyzed on a Prism isotope ratio mass spectrometer in continuous flow mode (CF-EA-IRMS). Standards with isotope compositions bracketing those of the samples were used as reference to calibrate to the international standard V-CDT An average standard deviation of ±0.19% was determined from multiple (three to seven) analyses. Long-term monitoring of the international standard NBS 127 run each day gives a value of +21.13%±0.22%.
Melted snow samples were filtered prior to ion-concentration quantification using Acrodisc 0.2 |im Supor (PES) membrane filters. Anion concentration was quantified using a Dionex ICS-2500 IC with a 4 mm AS18 column, and KOH eluent (0−4.5min: 22 mM; 4.5−13.1 min: 40 mM; 13.2−18 min: 22 mM). A six-point calibration using 10, 100, 500, 1000, 2000 and 10 000 dilution of standards gave a sulphate calibration range of 15−15 000 ppb. The detection limit for sulphate was 1 ppb. Deionized water, a duplicate sample and a standard were run after every ten samples. High-concentration samples were diluted to bring ion concentration into the standard range. Standard error for 28 duplicate samples was 1.5 ppb.
Cation concentration was quantified using internal standard methodology on a Perkin Elmer Elan 6000 ICP-MS using dual detector mode with a blank subtraction after internal standard correction. A four-point calibration curve (0, 0.025, 0.050, 0.100 ppm for Na) was used. To each 4.9 mL sample, 0.05 mL each of C-star HNO3 and an internal sample containing 100 ppb of Bi, Sc and In was added. High-ion-concentration samples were diluted as needed to bring ion concentrations into the calibrated region. An injection volume of approximately 2.5 mL was analyzed using a flow rate of 1 mL min−1. The runs used 35 sweeps per reading, one reading per replicate and three replicates. Sodium dwell time was 10 ms, and integration time was 350 ms. Final results are the average of three replicates. The detection limit for sodium was 1 ppb, with relative standard deviation from ten duplicates of 0.63% at 5 ppb and 3.49% at 100 ppb. The average standard error for six duplicate samples from 200 to 800ppb was 3.7, and for four duplicate samples in the 1400−6200 ppb range it was 36.
Results
Field blanks
Sulphate concentrations from four field blanks processed under different conditions were 5−59 ppb, with an average of 30 ppb. δ34S values for two field blanks from two field seasons were +21.7% and +26.5%, respectively. As field-blank-corrected δ34S values will be influenced by the values chosen, average values in results presented below have been plotted with bars indicating maximum and minimum values based on these field-blank isotope and concentration values.
Laboratory blanks
Ion concentrations of the distilled deionized (18.2 MΩ) water used in the laboratory were below the detection limit (1 ppb for sulphate) for all major ions with the exception of Cl−. During laboratory preparation for sulphate isotopic analysis, samples were exposed to the class 100 clean laboratory atmosphere for 36–72 hours. Laboratory blanks, 500 mL of distilled deionized water processed with sample sets and evaporated to 10mL, had sulphate concentrations from 0 to 19 ppb and an average of 6 ppb. No δ34S values are available for background atmospheric sulphate in the laboratory, so a correction for this has not been made.
Surface snow
Ion-chemistry and sulphur-isotope values for 11 surface snow samples from the Leffert Glacier transect and 5 from the Jewell Glacier transect are presented. The Jewell Glacier transect shows a general decrease in concentration of Cl−, SO4 2–, Ca2+, Na+, Mg2+ and K+ from low elevations to higher elevations and with increased distance inland (Fig. 2a; other ions not shown). Concentration trends on Leffert Glacier are more complex. There is a decrease in concentration of Cl−, SO4 2–, Ca2+, Na+, Mg2+ and K+ from sea level to 550ma.s.l., similar to what is seen on Jewell Glacier. Above this altitude, ion concentrations increase from 700 to 1000 m a.s.l., followed by a large decrease in concentration for the sites from 1150 to 1450 m a.s.l. Ion concentrations at 1000 m a.s.l. typically exceed concentrations at 100 ma.s.l. Surface spring snow at sea level had a sulphate concentration of 362 ppm. Similar snow on Jewell and Leffert Glaciers had sulfate concentrations ranging from 0.2 to 4.5 ppm (204–4580 ppb), peaking at 100 m a.s.l. on Jewell Glacier and 1000m a.s.l. on Leffert Glacier. MSA ranged from 0 to 8 ppb, increasing with elevation on Jewell Glacier, but this trend is absent on Leffert Glacier. Nitrate concentrations show a general decrease with elevation increase. δ34S values for surface snow range from +9.9% to +21.4% (Fig. 2b) and show a trend that is weaker than but similar to that of sulphate concentration.

Fig. 2. Sulphate concentrations (σ) and δ34S (b) of surface snow samples on Leffert and Jewell Glaciers as a function of elevation. Note that two scales are used in (a).
Depth profiles from five locations
Depth profiles for the five sites where complete datasets were available while this paper was in preparation are shown in Figure 3. Fall 2003 to spring 2004 snow accumulation was 30–90 cm. All sites were below the ablation zone, with glacial ice defining snow-pit base. Sulphate concentration ranged from 16 to 126 ppb at the base of the snowpack, and 204 to 742 ppb at the surface. In all profiles, minimum concentrations at depth increased to higher concentrations at the surface. This trend is more pronounced at lower elevations (Fig. 3a), where sulphate concentrations are also higher. δ34S values show an opposite trend, with more positive values generally observed at depth. Surface δ34S values are +9.5 to +15.2%, increasing with depth to +16.4 to +20.9% at the base of the snowpack. This pattern is clearest in the lower-elevation profiles (Fig. 3c) from Leffert Glacier. A similar trend is possibly seen at 1150ma.s.l. on Leffert Glacier, but is not apparent at 1000 m a.s.l. on Jewell Glacier (Fig. 3d). However, these higher-elevation sites show interesting similarities in pattern with depth.

Fig. 3. Sulphate concentration (a, b) and δ34S (c, d) as a function of snowpack depth at five sampling locations. Note: average δ34S values are plotted with minimum and maximum field-blank-corrected δ34S values indicated with bars.
Discussion
Surface snow transects
Surface snow samples from the Jewell Glacier transect can be interpreted as decreasing marine aerosol impact with greater vertical and horizontal distance from sea-water sources. Similar trends are well documented in the literature (e.g. Reference Mayewski, Spencer, Lyons and TwicklerMayewski and others, 1987; Reference Fischer, Wagenbach and KipfstuhlFischer and others, 1998; Reference Sharp, Skidmore and NienowSharp and others, 2002). Lower δ34S values at higher elevation and greater distance inland reinforce this interpretation. The general trend in surface snow of Jewell Glacier is also seen on Leffert Glacier, with additional complexities. The main transport route for marine aerosols is up Leffert Glacier from east to west and can explain the similarity in pattern on the two glaciers. In addition, on Leffert Glacier a marked increase in ion concentration from 700 to 1000 ma.s.l., peaking at 1000 ma.s.l., is mimicked by δ34S values. These higher values suggest that an additional aerosol source could be affecting the 850–1150 ma.s.l. sites of Leffert Glacier. There are two plausible scenarios: additional marine aerosols (possibly from Flagler Bay Polynya (Reference SchledermannSchledermann, 1996)) or a lithic source. Topographic features suggest dominant airflow to the glaciers from the southeast. However, a small unnamed fjord north of this region, opening to the northeast, may form a more direct transport route for marine aerosols than is typical for the remainder of Leffert Glacier. It is also possible that this fjord may also be a pathway for lithogenic aerosol transport from subaerial regions north and west of the POW Icefield.
Depth profiles at five locations
Trends in the POW depth profiles can be understood in the context of seasonal cycles of Arctic anthropogenic, sea-salt and biogenic sulphate aerosols. The deepest layers represent the previous year’s fall snow, when aerosol levels in the atmosphere are low (based on δ18O of snow; data not shown). The very positive δ34S values at depth likely reflect greater marine contributions in early fall before the seasonal sea ice forms in Baffin Bay and sea-ice leads are frozen over. As winter progresses, more anthropogenic sulphate accumulates in the atmosphere and is likely deposited in maximum concentration in April–May snowfall (Reference Sirois and BarrieSirois and Barrie, 1999; Reference Sharp, Skidmore and NienowSharp and others, 2002).
Non-sea-salt sulphate
Non-sea-salt sulphate was calculated assuming a 100% sea-salt sodium source, using a sea-water sulphate to sodium mass ratio of 0.252 (e.g. Reference Murray, Jacobson, Charlson, Rodhe and OriansMurray, 2000). δ34Snss (non-sea-salt sulphate) was calculated using a sea-salt sulphate value of δ34Sss = +21%. δ34STotal values vs the ratio of sea-salt sulphate to total sulphate are plotted in Figure 4. On this plot, samples with no sea-salt sulphate would be bounded by a lower limit of δ34SA = +4.3% and an upper limit of δ34SDMS = +19.5%. Samples with 100% sea-salt sulphate would have a δ34SSS = +21%. The mixing of sea water with a δ34SA source forms the lower line on the plot, and the mixing of sea water with a δ34SDMS source forms the upper line. Figure 4 shows that δ34S values used to apportion the three major sulphate sources to POW snowpack are reasonable for most data, with only two points falling outside the expected range.

Fig. 4. δ34S values vs the ratio of sea-salt sulphate to total sulphate. On this plot, samples with no sea-salt sulphate would be bounded by a lower limit of δ34SA = +4.3% and an upper limit of δ34SDMS = +19.5%. Samples with 100% sea-salt sulphate would have a δ34SSS = +21%. The mixing of sea water with a δ34SA source would form the lower line on the plot, and the mixing of sea water with a δ34SDMS source would form the upper line.
Apportionment of non-sea-salt sulphate
Assuming no fractionation occurs on oxidation of DMS, non-sea-salt sulphate of surface snow samples was apportioned into anthropogenic sulphate (which includes volcanic degassing) using a value of δ34SA = +4.3%, and ocean biogenic sulphate using δ34SDMS = +19.5%. Total sulphate (STotal), sea-salt sulphate (SSS), anthropogenic sulphate (SA) and ocean biogenic sulphate (SDMS) for spring surface samples from the Leffert transect are shown in Figure 5a, and from the Jewell transect in Figure 5b. Sulphate source was not apportioned for the 850–1150 ma.s.l. sites, as there may be an additional sulphate source affecting this section of Leffert Glacier (as discussed above). Otherwise, two distinct sulphate concentration patterns are apparent. On Jewell Glacier, total sulphate and marine biogenic sulphate decline with increased elevation and distance inland at a reasonable approximation of exponential decrease. Sea-salt sulphate also declines, while anthropogenic contributions remain relatively constant. This is interpreted as the biogenic sulphate originating from regional open water at the surface, whereas anthropogenic sulphate from long-range transport is ubiquitous at all levels.

Fig. 5. Apportionment estimates of major sulphate sources for surface samples on Leffert Glacier (a) and Jewell Glacier (b). DMS and anthropogenic components were not calculated for the 850–1150 m a.s.l. sites due to the possibility of an additional sulphate source in this region.
Conclusions
Preliminary ion chemistry and sulphur isotope values for surface snow samples from two transects, and five depth profiles on POW, show distinct seasonal trends and spatial patterns. We believe that this study is the first to quantify δ34S seasonal variations in polar snow. Ion concentrations and δ34S values in surface snow along two transects are interpreted as indicating decreasing marine aerosol impact with greater vertical and horizontal distance from sea-water sources. This trend is clearest on Jewell Glacier, where decreasing SO4 2– and Na+ concentrations (along with Cl−, Mg2+ and K+) in surface snow samples are mimicked by decreasing δ34S values. Surface snow of Leffert Glacier shows a more complex pattern of decreased ion concentrations and δ34S values with inland distance and elevation increase, combined with a marked increase in concentration and δ34S value in the 700–1000 m a.s.l. section. The increased values in this section are interpreted as reflecting an additional (lithic and/or marine) aerosol source.
Both total sulphate and non-sea-salt sulphate show increased concentrations from fall to spring accumulation in depth profile. δ34S values have an opposite trend, with heavier values generally observed in the basal fall snow-pack. The pattern is clearest for the low-elevation sites. These profiles are consistent with mainly marine contributions in early fall, giving low sulphate concentrations and high δ34S values, with increasing amounts of anthropogenic sulphate in late-winter and spring snow which increases ion concentration and decreases δ34S values.
Two distinct sulphate concentration patterns are apparent from the apportionment of non-sea-salt sulphate into anthropogenic and marine biogenic components. An exponential decrease is approximated in the total sulphate and marine biogenic sulphate of the steeper-sloped Jewell Glacier as elevation and inland distance increase. Sea-salt sulphate also declines, while anthropogenic contributions remain relatively constant. These patterns of proximal marine influence in the surface snow of Jewell Glacier are much less clear on the gently sloped Leffert Glacier. The increased total and sea-salt sulphate concentrations in the mid-section of the transect overwhelm the distance and elevation trend. The anthropogenic component of surface snow remains relatively constant over the two transects, signifying a vertically well-mixed source. DMS sulphate clearly is associated with low elevation, and the exponential decrease with altitude implies a dominant regional surface source of DMS sulphate on the ice fields. The North Water Polynya in Baffin Bay and, to a smaller extent, other polynyas and leads in the region are likely the major source of DMS on the icepack rather than DMS or DMS sulphate that has undergone long-range transport from the North Atlantic. These results suggest that DMS sulphate may well be able to provide a reasonable indication of open-water conditions in Baffin Bay and Nair Strait and warrants further study using isotope apportionment techniques with sulphate in ice cores.
Acknowledgements
We thank the following people for assistance on this project: M. Wieser, S. Taylor and N. Lozano from the Isotope Science Laboratory at the University of Calgary, and M. Sharp and G. Chen at the University of Alberta. Special thanks to A. Taylor for his competent and congenial field assistance/ guiding. We also thank the Natural Sciences and Engineering Research Council, Canada, the Canadian Foundation for Climate and Atmospheric Sciences, the Northern Scientific Training Program and the Polar Continental Shelf Project for financially supporting this project. In addition, we thank the anonymous reviewers whose critical feedback greatly strengthened this paper.


