

Introduction
For glaciological applications, simple shear is the most important stress configuration to study. It is the dominant stress configuration and deformation state in the deeper parts of the natural ice masses (e.g. Reference Budd and JackaBudd and Jacka, 1989; Reference Wang and WarnerWang and Warner, 1998; Reference Warner, Jacka, Li, Budd, Hutter, Wang and BeerWarner and others, 1999).
Theoretical considerations of the development in simple shear deformation of anisotropic crystal fabric, including rotation and recrystallization, indicate a single-maximum fabric with c-axis concentration normal to the shear plane (eg. Reference PatersonPaterson, 1994). Furthermore, laboratory ice-deformation tests have provided some evidence of a central tendency produced in shear. However a strong single-maximum fabric (equivalent to the stronger of those found in the field) has not yet been published from laboratory ice-deformation tests.
Our recently developed combined compression and shear apparatus has been used to examine simple shear and the development of fabric anisotropy. The apparatus allows free deformation of the sample in directions perpendicular to the applied shear. Results have shown that horizontal shear strain, imposed on a rectangular polycrystalline ice sample, has an effect on the vertical strain during the deformation. At the conclusion of the tests, a strong single-maximum fabric is produced.
Simple Shear
The conventional definition of simple shear due to a shear stress, τ is illustrated in Figure 1a. Under the coordinate system shown, the only non-zero strain component is the shear strain, εxz, in the xz plane. For glaciological (i.e. ice-sheet) applications, we usually define the strain rate,
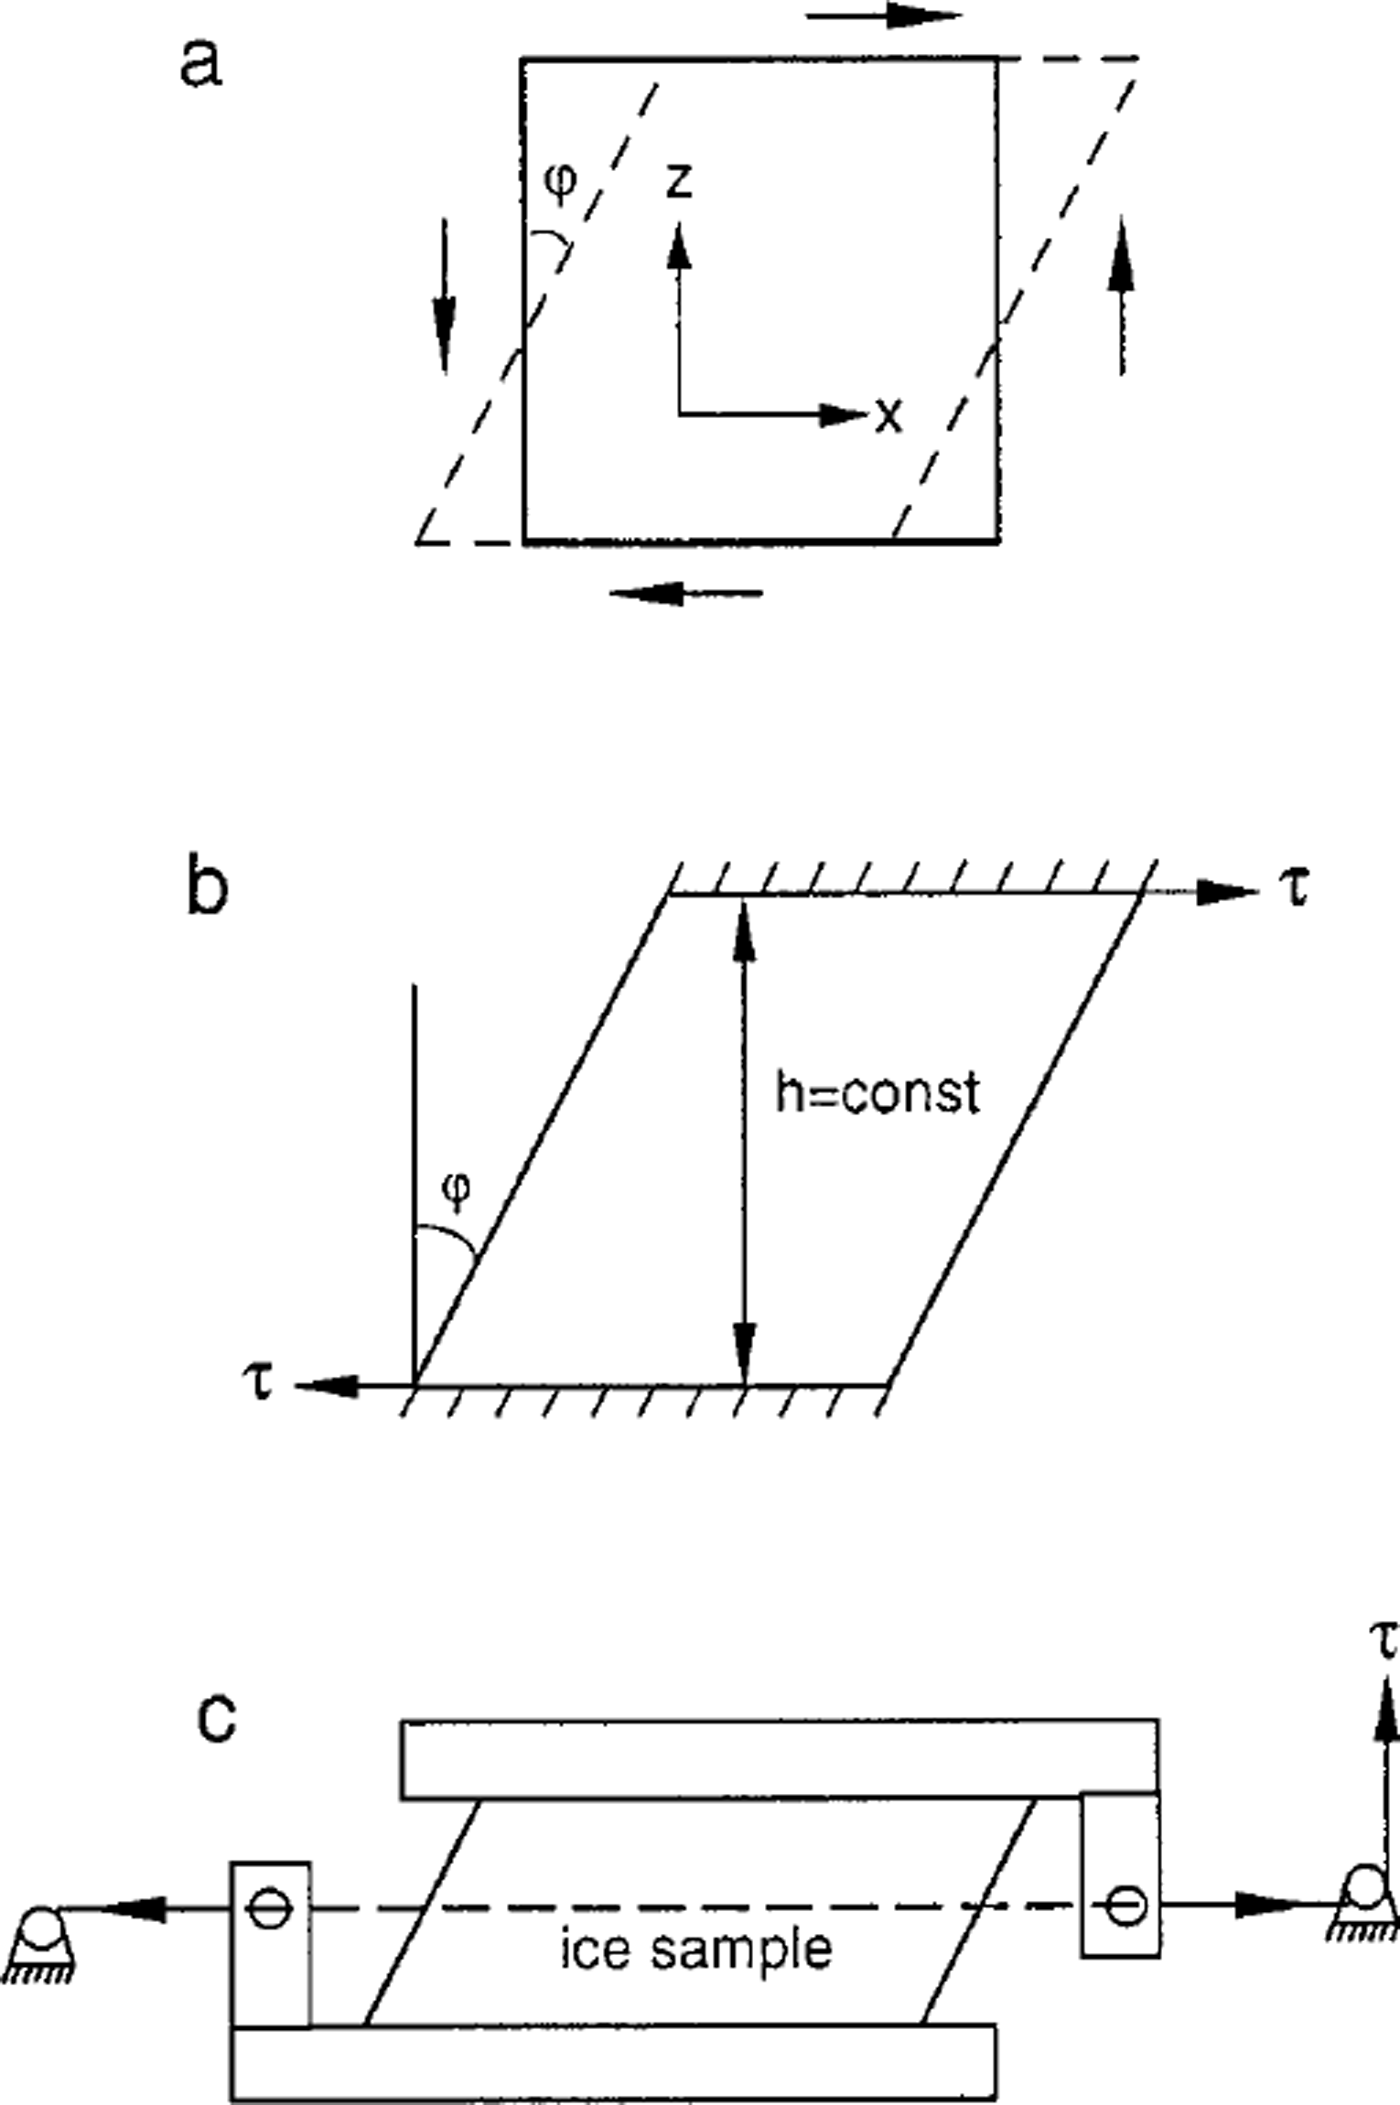
Fig. 1. Schematic diagrams showing: (a) definition of simple shear deformation; (b) assumed stress configuration to generate simple shear; and (c) previously used technique to deform an ice sample in simple shear.
where u is the ice velocity in the × direction (e.g. Reference BuddBudd, 1969). For laboratory applications, we calculate εxz from
where φ is the angle between the x and z coordinate (e.g. Reference JaegerJaeger, 1969). It is important to note that simple shear is a deformation state that is defined by the total displacement pattern. To maintain this type of deformation, the force system required is material-dependent.
The corresponding stress configuration for simple shear deformation of ice is usually taken as illustrated in Figure 1b (e.g. Reference BuddBudd, 1969; Reference JaegerJaeger, 1969). Shear stress is applied in the × direction. Sample height, h, is assumed fixed during the deformation and shear strain is calculated on the basis of Equation (2). The angle φ has been computed from the constant h and the linear movement of the platen along the × direction. If h is mechanically kept constant, a normal stress will be created during the deformation unless the deformation of the ice happens to be truly planar laminar flow, i.e. as a deck of cards.
For the case with platens kept parallel, but with the top platen free to move in the vertical as well as the horizontal direction, it is found that when starting with a sample of rectangular vertical section the top platen moves downwards as the horizontal shear progresses and the sample deforms to a parallelogram-shaped section of reduced height. If the direction of shear is reversed from the deformed parallelogram position the top platen moves upwards until the rectangular-section shape is reached and thereafter with continued shear moves downward as before.
During the deformation the volume and density of the ice sample remain constant. For the case with the platens moving parallel with fixed spacing, the ice sample dimension in the direction normal to the sloping sides of the parallelogram reduces with increasing shear. For the case with the top platen free to move in the vertical direction, the sample dimension normal to the sloping sides of the parallelogram does not reduce as much when the vertical spacing decreases. In addition, spreading occurs in the transverse direction. The reverse applies when the parallelogram is being deformed back towards the rectangular shape with the top platen moving upwards as well as horizontally.
Figure 1c is an example of techniques used for past simple-shear experiments performed in the laboratory (Reference Russell-HeadRussell-Head, 1985; Reference Xiangqun, Jacka, Budd and KunGao and others, 1989; Reference Wang, Li, Jacka and GuodongWang and others, 1996). An ice sample was frozen between two supporting boxes. Shear stress was applied to the sample through a tensioned wire and the supporting boxes. The arm attached to the box was rigid and the position of the pulley was fixed. The height of the sample was thus fixed during the deformation. This led to sample distortion such that, rather than shear at large strains, the deformation resembled extension in the maximum extension direction which rotated as the strain progressed from 45° off vertical, towards the × direction.
Experimental Technique
The ice-deformation apparatus used in the present study, modified from the combined shear/compression apparatus described by Reference Li, Jacka and BuddLi and others (1996), is shown in Figure 2. The ice test sample is frozen between two support boxes. The lower box is fixed to the base of the apparatus so it is stationary. To ensure that the vertical deformation is perpendicular to the base, i.e. without tilting laterally, a force is applied to the upper box through a large diameter piston guided by a piston housing. The piston housing is linked to two horizontal guide rails through linear bearings that allow the housing (and with it the piston and upper box) to move horizontally and independent of the vertical deformation. For the combined shear/compression apparatus, the piston is loaded with weights to provide the compression force. For the present tests, the compression load can be replaced by an extension load through a tension wire that is guided over a simple pulley system. Thus, a combined shear/extension test can be set up, or (more to the point for this study) the compression load due to the apparatus components themselves can be balanced so the ice sample is deformed by the application of horizontal, parallel forces alone.

Fig. 2. Diagram of the apparatus for horizontal shear deformation with free movement in the vertical direction. Within the ice sample, the dashed lines indicate a "back-cut" initial sample shape.
Shear stress is created by a force applied through a wire, tensioned (via a pulley and a load cell) by a fixed 50 mm diameter pneumatic air cylinder, that can be adjusted to maintain a constant force (measured by the load cell) of up to 2000 N. The tensioned wire is connected to an arm fixed to the upper box. The vertical position of the pulley can be adjusted to ensure that the shear force is always applied horizontally through the middle of the ice test sample during deformation. A dial indicator measures the horizontal (shear) displacement of the piston housing with respect to the base. Another dial indicator measures the vertical displacement of the piston with respect to the piston housing. Measurements are taken from both dial indicators for all tests, whether or not a vertical stress is applied, i.e. the apparatus allows us to measure the vertical strain at all times during a test.
The deformation apparatus is placed in a bath of circulating silicone oil inside a deep freezer, so the ice test samples are completely immersed. The temperature of the oil was controlled at 2.0 ± 0.1 °C using a method similar to that described by Reference MorganMorgan (1979).
Parallelepiped test samples, initially of length (l) 60–140 mm, width (ω) 15 mm, and height (h) 10–32 mm were deformed in the above apparatus with the length dimension in the shear direction and as described above, with zero applied stress in the vertical direction. Samples were cut from laboratory ice prepared using the technique described by Reference Jacka and LileJacka and Lile (1984). The samples were polycrystalline with initially random crystal orientations and a mean crystal area of about 1.2 mm2. The applied octahedral shear stresses were 0.2, 0.3 and 0.4 MPa (Table 1, Fig. 3).
Table 1 Summary of test data: τ0 is applied octahedral shear stress; l, h, w and a are sample length, width, height and back-cut angle, respectively; ![]() is the minimum (isotropic) octahedral strain rate;
is the minimum (isotropic) octahedral strain rate; ![]() is the tertiary (anisotropic) octahedral strain rate, εf is the final total strain. Test temperature was –2.0° C for all tests
is the tertiary (anisotropic) octahedral strain rate, εf is the final total strain. Test temperature was –2.0° C for all tests


Fig. 3. Average creep curves (log-log plots of octahedral shear strain rate as a function of octahedral shear strain) at each of three octahedral shear stresses 0.2, 0.3, and 0.4 MPa as indicated in the diagram. The test temperature was –2.0°C.
Results and Discussion
Strain curves
In total, seven tests (A1–A7) were carried out. All samples were deformed to beyond 10% horizontal shear strain, clearly showing minimum and tertiary strain rates. Figure 3 shows the mean strain curves for the horizontal deformation, for tests within each group of octahedral shear stress. The minimum and tertiary strain rates occurred at around 1 % and 10% strain respectively, which is in agreement with previous results (Reference Li, Jacka and BuddLi and others, 1996). Note also, as found previously, that the tertiary (anisotropic) strain rate for each group of tests is a factor about 10 greater than the minimum (isotropic) strain rate.
Horizontal shear effect on vertical strain
Figure 4 is a plot of the strain in the vertical direction, δh/h as a function of shear strain in the horizontal direction for each test. It shows that while the sample was deforming in the horizontal (shear) direction, deformation in the vertical direction occurred even though there was no force applied in this direction, i.e. due to the internal forces within the ice. The samples for tests A1–A4 were cut with end faces 30° from the vertical and placed with the top face displaced away from the shear direction. These test sample configurations are termed "back-cut" samples. The vertical strain for these tests initially increases (i.e. extension) until a horizontal shear strain of about 20% or more is reached. At this stage the sample becomes rectangular in shape, i.e. the flow at this point is planar, laminar and the vertical strain rate is zero. The total vertical strain then decreases with further shear until about 70% horizontal shear strain, after which the initial height displacement is overtaken and net compression occurs for higher shear strains.
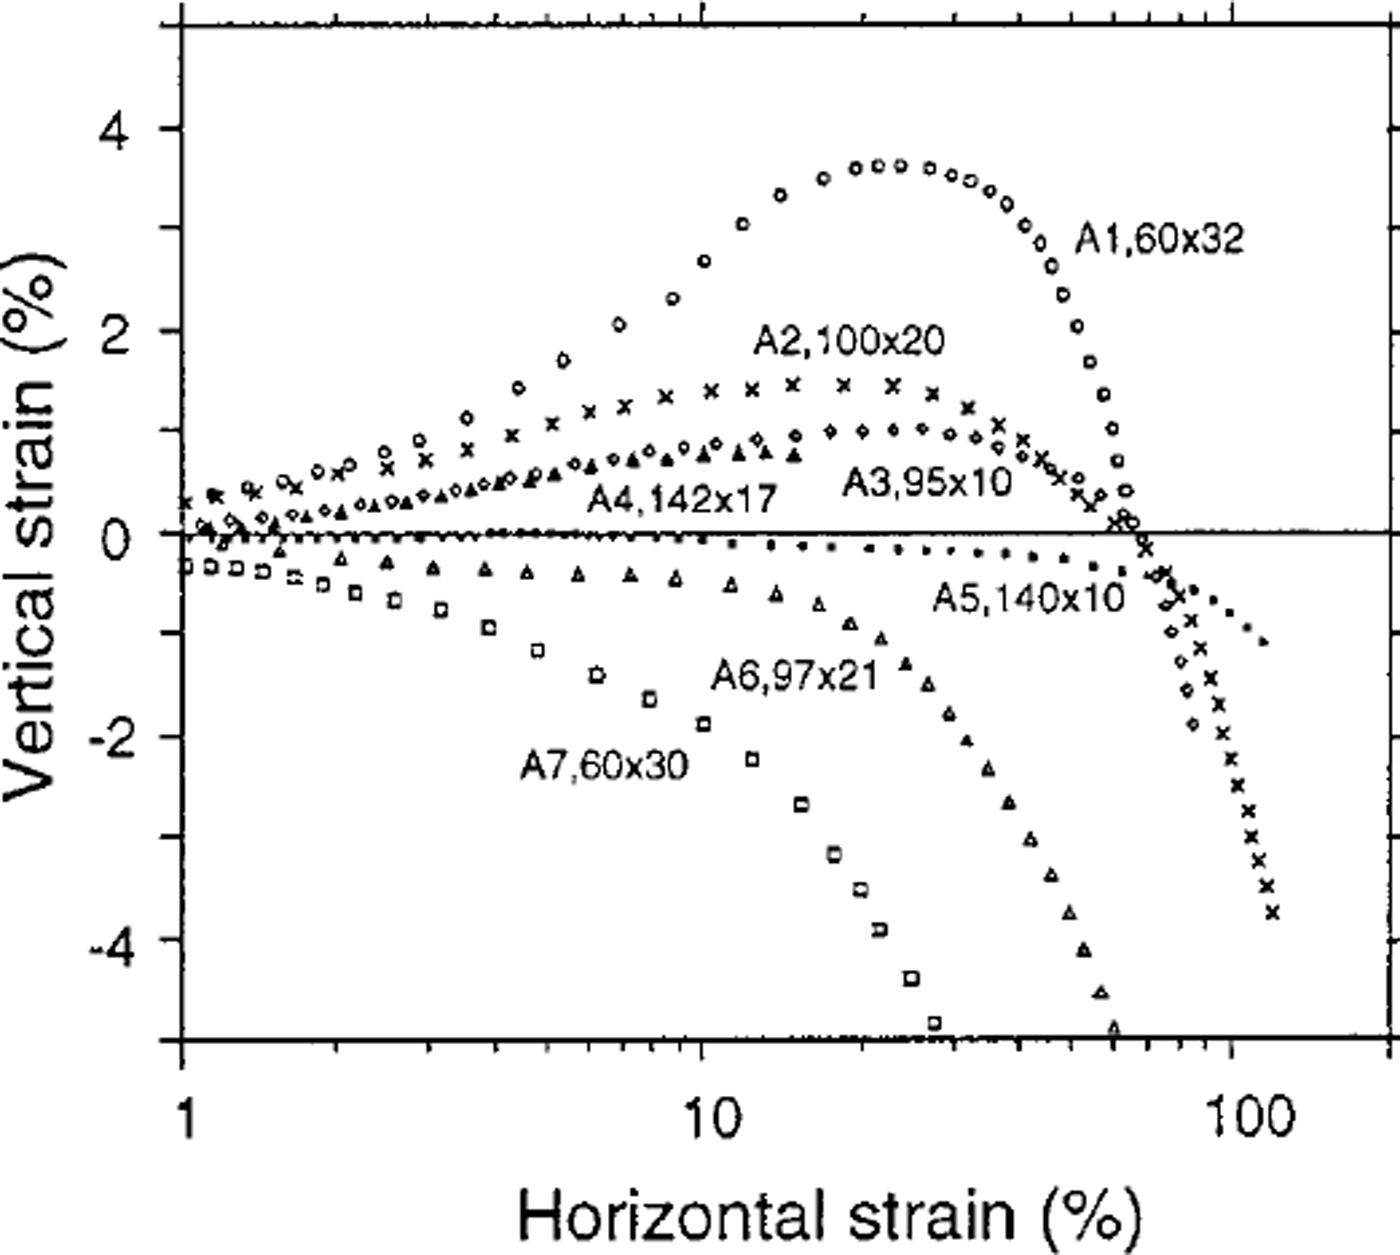
Fig. 4. Plot of vertical strain as a function of horizontal (shear) strain for each deformation test. Sample length and height ( mm) for each test are marked in the diagram. Tests A1–A4 started with a back-cut angle, a, of 30°.
Samples for tests A5–A7 were not back-cut; they were initially rectangular. As shown by Figure 4, for these tests negative values of vertical strain (i.e. compression) increase throughout the test duration, the height of the sample decreasing during the horizontal deformation.
It is seen from Table 1 and Figure 4 (which shows the length and height of the samples along with the vertical deformation curves) that vertical strain, generated by the horizontal shear deformation, depends on the geometry of the test sample. The greater the sample length-to-height ratio the greater the horizontal strain period over which planar laminar flow persists.
Shear experiments performed in the laboratory cannot fully simulate the simple shear of natural large ice masses. This is because of the limited ice-sample size available and because of the limitations of mechanical systems. If the sample height is kept constant artificially, a normal stress perpendicular to the shear direction will be generated during the shear deformation. Based on vertical strain rate at the tertiary stage for the present experiments, the corresponding apparent normal stress may be about 0.1–0.2 MPa according to the strain-rate-stress relation given by Reference Li and JackaLi and Jacka (1996) and will vary with vertical strain rate throughout the experiment.
Comparison of fabrics
A large number of laboratory ice-deformation tests in simple shear have been performed (e.g. Reference Kamb, Heard, Borg, Carter and RaleighKamb, 1972; Reference DuvalDuval, 1981; Reference Xiangqun, Jacka, Budd and KunGao and others, 1989). A two-maxima fabric pattern was typically obtained in these laboratory experiments (e.g. Fig. 5a). One maximum, with stronger concentration of c axis, typically developed in the direction perpendicular to the shear plane, and a second, with weaker concentration, developed several tens of degrees (depending on the strain) away from the shear plane towards the shear direction. This second maximum disappears at large strains (Reference BuddBudd, 1972; Reference LliboutryLliboutry, 1987) as shown by an experiment performed in torsion (Reference Bouchez and DuvalBouchez and Duval, 1982). Attempts to perform these tests in a shear apparatus to large strains (>100%) were also made (Reference Russell-HeadRussell-Head, 1985; Reference Xiangqun, Jacka, Budd and KunGao and others, 1989; Reference Wang, Li, Jacka and GuodongWang and others, 1996). However the heights of these test samples were kept constant during the deformation because of the configuration constraints of the apparatus (Fig. 1c). The resultant fabrics resembled small circle girdles around an axis near the principal extension direction (Fig. 5b), indicating the sample was in tension in the direction near to 45° from the shear plane in the shear direction.

Fig. 5. Crystal-orientation fabric diagrams from previous simple shear tests (a) at49% shear strain (Reference Wang, Li, Jacka and GuodongWang and others, 1996) and (b) at 100% shear strain (Reference Russell-HeadRussell-Head, 1985).
Figure 6 shows crystal c-axis fabrics obtained in this study. Strong single-maximum fabrics have been attained. The single-maximum however is elongated in the direction perpendicular to the shear direction indicating that some transverse extension deformation (in the y axis) has occurred in the sample as a result of the contraction in the vertical direction (decreasing in height) by the end of the experiments. This particularly occurs at large strains as shown by Figure 4. Note, for the back-cut samples, that near planar laminar tertiary shear flow occurs at about 20% strain with vertical strain rate near to zero. Also, for the long samples with low height, the maximum vertical strain reached by the time tertiary shear flow was achieved was less than 1%. This is comparable with the amount of anelastic strain evident in deformation experiments and can be regarded as small relative to the large plastic shear strain of about 20% or more. Tests in compression alone on these oblong shaped samples have shown that a two-maxima fabric develops with centres in the direction perpendicular to the long axis at about 25° to the vertical (Reference Li and JackaLi and Jacka, 1998), confirming that the sample is actually confined (for compression deformation) in the length (shear) direction and unconfined in the width direction.

Fig 6. Crystal-orientation fabric diagrams measured from horizontal thin sections taken from the central region of the samples, showing an elongated strong single-maximum pattern at shear strains > 100%.
Conclusion
Because of the limited size of samples used in laboratory ice-deformation tests, the presence of end effects means that true simple shear cannot be attained. Horizontal shear deformation has an effect on the deformation in the vertical direction. However increasing the sample length and reducing the sample height can minimize this effect. Also, by commencing shear-deformation tests with ice initially with a back-cut shape, plane laminar flow is established at about 20% strain, with the ice in anisotropic tertiary flow.
By shearing ice samples to large strains ( >100%) while allowing free deformation of the sample in the direction perpendicular to the applied shear, strong single-maximum fabrics have developed similar to those observed from high-shear layers in natural ice sheets. These fabrics are slightly elongated in the transverse direction, which we attribute to deformation in the unconfined transverse (yaxis) direction.


