

INTRODUCTION
In the coastal region of Greenland, glaciers and ice caps (GICs) physically separated from the Greenland ice sheet cover an area of ~89 300 ± 2800 km2 (Rastner and others, Reference Rastner2012). Mass loss from Greenland's GICs has increased over recent decades and affected sea-level rise (e.g. Meier and others, Reference Meier2007; Mernild and others, Reference Mernild and Liston2010). Ice, Cloud, and land Elevation Satellite (ICESat) altimetry revealed mass loss of the GICs in Greenland to be −28 ± 11 Gt a−1 for 2003–08 (Bolch and others, Reference Bolch2013) and −38 ± 7 Gt a−1 for 2003–09 (Gardner and others, Reference Gardner2013). These rates of mass loss account for ~10% of the contribution from all the GICs in the world to sea-level rise (Bolch and others, Reference Bolch2013). Because the GICs are located at low elevations, they are susceptible to the recent climate warming in Greenland (Hanna and others, Reference Hanna, Mernild, Cappelen and Steffen2012). Additionally, rapid changes are expected for these GICs also because the response time is shorter compared with the ice sheet (Mernild and others, Reference Mernild2011).
Atmospheric warming is the most important driver of the recent mass loss of the GICs in Greenland. Air temperature has been rising in Greenland since the early 1990s (e.g. Mernild and others, Reference Mernild, Hanna, Yde, Cappelen and Malmros2014), resulting in an increase in the surface melt rate and duration over the ice sheet and GICs (e.g. Box and others, Reference Box, Yang, Bromwich and Bai2009). Other processes, such as acceleration in ice motion, may have additional effects on the changing mass of the GICs. Particularly in early summer, increasing amounts of meltwater input to the bed accelerate ice mass transport to lower elevations, as observed on the land-terminating sections of the ice sheet (e.g. Zwally and others, Reference Zwally2002; Joughin and others, Reference Joughin2008; Van de Wal and others, Reference Van de Wal2008). Seasonal speedup was reported on the Flade Isblink Ice Cap in northeastern Greenland, indicating the influence of meltwater on ice-cap dynamics (Palmer and others, Reference Palmer, Shepherd, Sundal, Rinne and Nienow2010). In the late ablation season, the ice velocity decreases despite an increase in meltwater input, likely in response to increased efficiency of the subglacial drainage system (e.g. Schoof, Reference Schoof2010; Fitzpatrick and others, Reference Fitzpatrick2013). On a decadal timescale, increased meltwater input also increases drainage system efficiency and causes a decrease in annual ice velocity in the lower ablation area of the land-terminating section of the ice sheet, while ice flow accelerates in the upper ablation area in response to higher basal water pressure in an inefficient drainage system (Tedstone and others, Reference Tedstone2015; Van de Wal and others, Reference Van de Wal2015). Despite its importance, there is a dearth of studies on flow variations for the GICs in Greenland, and the influence of velocity change on the ice-cap mass change is not well understood.
Englacial ice temperature plays an important role on the ice dynamics of the GICs. The thermal structure of a glacier is controlled by heat supplied to the glacier surface and bottom, as well as that generated within the glacier. For example, while the atmosphere supplies heat to the glacier surface, geothermal heat is supplied by the glacier bed, and frictional heat is generated when ice glides over the bed. Heat is distributed into the glacier by means of conduction through the ice and advection due to ice motion, as well as water flow into crevasses and moulins. The polythermal structure of high Arctic glaciers is complex and difficult to reproduce by numerical simulations. For example, a thermomechanical glacier model predicted entirely cold ice for Laika Glacier, Coburg Island, Canadian Arctic (75°50′N, 79°10′W), whereas borehole measurements showed a partially temperate bed in the ablation area (Blatter and Hutter, Reference Blatter and Hutter1991). Similar discrepancies between numerical modeling and in situ observations were reported for John Evans Glacier, Ellesmere Island, Canadian Arctic (79°40′N, 74°00′W) (Bingham and others, Reference Bingham, Hubbard, Nienow and Sharp2008) and McCall Glacier, AK, USA (79°17′N, 143°50′W) (Pattyn and others, Reference Pattyn, Nolan, Rabus and Takahashi2005). Near-surface ice temperature is particularly difficult to predict because it is influenced by firn processes, such as refreezing of meltwater and thermal insulation by snow layers (e.g. Reijmer and others, Reference Reijmer, van den Broeke, Fettweis, Ettema and Stap2012; Van Pelt and others, Reference Van Pelt2012, Reference Van Pelt, Pohjola and Reijmer2016). On the Greenland ice sheet, surface temperatures were measured by satellite-based observations (e.g. Hall and others, Reference Hall, Comiso and DiGirolamo2013), and near-surface ice temperatures have been measured at several automatic weather stations (AWSs) (e.g. Steffen and Box, Reference Steffen and Box2001). Nevertheless, near-surface ice temperature data from Greenland's GICs are limited: Siunnaatalik in the northwest (Fristrup, Reference Fristrup1960) and AWS on Mittivakkat Gletscher in the southeastern region (e.g. Van As and others, Reference Van As and Fausto2011).
Despite the substantial mass loss revealed by the ICESat data, field measurements are sparse in Greenland's GICs. One of the longest surface mass-balance (SMB) records is for Mittivakkat Gletscher in southeastern Greenland, which showed 29% volume loss from 1994 to 2012 (Mernild and others, Reference Mernild2013; Yde and others, Reference Yde2014). This mass loss was attributed to increases in summer temperature and reductions in winter precipitation (Mernild and others, Reference Mernild2011). Thinning of Mittivakkat Gletscher in the ablation area resulted in a >50% decrease in flow velocity from 1996 to 2011 (Mernild and others, Reference Mernild2013). The limited amount of in situ data shows that SMB of GICs in Greenland is inhomogeneously distributed in space and time. For example, SMB on Freya Glacier in eastern Greenland ranged from −0.93 to −0.29 m water equivalent (w.e.) a−1 in 2007–12, which was >50% less negative than those at Mittivakkat Gletscher during the same period (Hynek and others, Reference Hynek, Weyss, Binder, Schöner, Jensen, Rasch and Schmidt2013). SMB on Qasigiannguit in southwestern Greenland varied from −0.40 m w.e (2012/13) to −0.32 m w.e (2013/14) (Abermann and others, Reference Abermann, van As, Petersen and Nauta2014), whereas SMB on Mittivakkat Gletscher was more negative in 2013/14 than in 2012/13 (personal communication from S. Mernild, 2016). These previous studies indicate that long-term observations covering the entirety of Greenland are required to improve our understanding of the trend and drivers of recent mass loss of the GICs.
As a part of a research project focused on ice mass change in the Qaanaaq region of northwestern Greenland (Sugiyama and others, Reference Sugiyama2014, Reference Sugiyama, Sakakibara, Tsutaki, Maruyama and Sawagaki2015; Saito and others, Reference Saito, Sugiyama, Tsutaki and Sawagaki2016; Tsutaki and others, Reference Tsutaki, Sugiyama, Sakakibara and Sawagaki2016), we carried out field observations on Qaanaaq Ice Cap (QIC) (Fig. 1a). GICs in this region are losing mass at an increasing rate (Bolch and others, Reference Bolch2013; Saito and others, Reference Saito, Sugiyama, Tsutaki and Sawagaki2016), which is consistent with the acceleration of the ice loss in northwestern Greenland since 2005 (Kjær and others, Reference Kjær2012). Thus, it is important to perform long-term observations to capture the ongoing changes of the GICs in northwestern Greenland. QIC was selected for the study site because of its proximity to Qaanaaq Village and Qaanaaq Airport. Following the previous report of initial field measurements on QIC (Sugiyama and others, Reference Sugiyama2014), this study reports SMB, ice velocity and near-surface ice temperature observed over a period from 2012 to 2016.

Fig. 1. (a) Landsat 8 OLI image (11 July 2015) showing northwestern Greenland including the Qaanaaq region. The box indicates the area shown in (b). The inset shows the location of the region in Greenland. (b) ALOS PRISM image (25 August 2009) showing QIC. The location of Qaanaaq Airport is indicated by the dot. The box indicates the area covered by (c). (c) ALOS PRISM image (25 August 2009) of the study site showing the locations of the measurement sites for SMB and ice velocity (square), and near-surface ice temperature (cross). The catchment area of QG is outlined. The location of the GPS reference station in Qaanaaq Village is indicated (circle). The arrows are horizontal flow vectors from July 2015 to July 2016.
STUDY SITE
QIC (77°28′N, 69°14′W) is located 3 km from Qaanaaq Village in northwestern Greenland, covering an elevation range of 15–1135 m a.s.l. and an area of 312 km2 in 2007 (Howat and others, Reference Howat, Negrete and Smith2014) (Fig. 1b). Mean annual air temperature at Qaanaaq Airport (74°23′N, 20°49′W; 16 m a.s.l.) from 2005 to 2015 is −8.5°C and precipitation at the Pituffik/Thule Air Base (76°32′N, 68°42′W; 76.5 m a.s.l.) is reported as ~300 mm w.e. a−1 (Bales and others, Reference Bales2009). Our measurement sites were located nearby the flowline of Qaanaaq Glacier (QG), one of the outlet glaciers flowing down southwest from the ice cap (Fig. 1c). Sugiyama and others (Reference Sugiyama2014) reported surface melt rate, ice flow velocity and ice thickness along the glacier flowline based on field measurements in summer 2012. Melt rate in July 2012 was 7–46 mm w.e. d−1 within an elevation range of 243–968 m a.s.l. with a mean rate of 30 mm w.e. d−1. Surface melt was enhanced in the middle elevation range (~500–900 m a.s.l.), where ice surface was darker than the other regions because of dark-colored surface dust deposited on glaciers, composed of wind-blown mineral particles and organic matter (Takeuchi and others, Reference Takeuchi, Nagatsuka, Uetake and Shimada2014; Nagatsuka and others, Reference Nagatsuka2016; Uetake and others, Reference Uetake2016). Ice flows at a mean rate of 25 m a−1 at 740 m a.s.l., where the glacier is thickest along the survey route (~165 m). Flow speed measured in the field was significantly greater than those simulated by a thermomechanically coupled ice flow model (Sugiyama and others, Reference Sugiyama2014). A possible shortcoming of the model was ice surface temperature, which was assumed to be equal to the mean annual air temperature. This motivated us to measure ice temperature in this study to better understand the ice dynamics of QIC. An AWS has been operated at the SIGMA-B site (77°31′N, 69°04′W; 944 m a.s.l.) since 19 July 2012 (Aoki and others, Reference Aoki, Matoba, Uetake, Takeuchi and Motoyama2014; Niwano and others, Reference Niwano2015) (Fig. 1c). This station records hourly air temperature, air pressure, relative humidity, wind speed, wind direction and snow height change data as well as short and longwave radiation components. We carried out field observations in the summers 2012–16 along a survey route from the terminus of QG to the elevation of 968 m a.s.l. (Fig. 1c).
METHODS
Surface mass balance
We measured SMB by the direct glaciological observation method (e.g. Fischer, Reference Fischer2011), using six aluminum stakes installed along the survey route (Sugiyama and others, Reference Sugiyama2014) (Fig. 1c). The 2–4 m long stakes were drilled into the glacier surface using a mechanical drill (Kovacs) equipped with an electric drill driver (Makita HR262DRDX). The elevation of the survey sites (Q1201–Q1206) ranged from 243 to 968 m a.s.l. (Table 2). SMB was obtained by reading the height of the stakes above the snow/ice surface for the periods from 29 July 2012 to 4 August 2013, from 4 August 2013 to 3 August 2014, from 3 August 2014 to 30 July 2015 and from 30 July 2015 to 31 July 2016 (Table 1). We refer to these measurement periods as the balance years 2012/13, 2013/14, 2014/15 and 2015/16, respectively. Balance years starting in late July or early August were often employed in previous studies of Greenland's GICs (Machguth and others, Reference Machguth2016). Some SMB data are not available because readings were not possible when a stake was covered by snow or melted out. In a case where the site was covered with snow, we measured the mean snow density of the entire snow layer above the previous summer ice surface in order to calculate SMB in w.e. The mean snow density was within a range of 287–502 kg m−3, and we assumed an ice density of 917 kg m−3. The thickness of superimposed ice was measured by drilling ice to the previous summer surface, which was determined by locating deposition of dark-colored surface dust. Uncertainties in the stake mass-balance measurements arise from stake readings and snow/ice density used for conversion from volume to mass (Cogley and others, Reference Cogley, Adams, Ecclestone, Jung-Rothenhäusler and Ommanney1996). The accuracy of stake reading was ±20 mm w.e. per reading, and the uncertainty of density was assumed to be ±30 and ±50 kg m−3 for ice and snow, respectively. Possible errors related to these two uncertainties (σ
1 and σ
2) were used to compute the uncertainty in SMB measurements at each stake (σ
b
), using the law of error propagation $(\sigma _b = \sqrt {\sigma _1^2 + \sigma _2^2} )$
.
$(\sigma _b = \sqrt {\sigma _1^2 + \sigma _2^2} )$
.
Table 1. Measurement periods of surface mass balance (SMB), summer velocities (u s) and annual velocities (u a) at Q1201–Q1206

Table 2. Surface mass balance (SMB) measured at Q1201–Q1206
Elevations are as measured in July 2012.
The glacier-wide mass balance (B) of QG was calculated by
 $$B = \displaystyle{{{\rm \Sigma} _zS_zb_z} \over S},$$
where S z and b z are the surface area and SMB at each 100 m altitude band, and S is the area of QG catchment. We calculated b z from SMB measurements at Q1201–Q1206 using a method previously proposed by Machguth and others (Reference Machguth2016). The stake data are interpolated every 50 m elevation band, and resampled every 100 m (see Machguth and others (Reference Machguth2016) for details). A 5 m resolution DEM provided by the ArcticDEM project was used to compute S z and S. The glacier margin was based on the ice mask (Howat and others, Reference Howat, Negrete and Smith2014), and modified by manual delineation on an orthorectified Panchromatic Remote-sensing Instrument for Stereo Mapping (PRISM) image from the Advanced Land Observing Satellite (ALOS) acquired in August 2009 (Fig. 1b). We performed watershed analysis using the DEM and GIS software (QGIS), and manually delineated the catchment of QG (Fig. 1c). The catchment covers an elevation range of 207–1128 m a.s.l. and an area of 9.57 km2, according to the DEM in 2014.
Uncertainty in the computed glacier-wide mass balance (σ B ) was evaluated by considering uncertainties in: (1) SMB in each elevation band (σ bz ), (2) ice surface area along the ice-cap margin (σ Sz ) and (3) the stake mass-balance measurement (σ b ):
 $$\sigma _B = \displaystyle{{{\rm \Sigma} S_z\sigma _{bz} + {\rm \Sigma} \sigma _{Sz}\left \vert {b_z} \right \vert + {\rm \Sigma} S_z\sigma _b} \over S}.$$
SMB at each elevation band was estimated from the stake measurements. However, SMB is influenced by spatially inhomogeneous surface conditions (e.g. surface slope and orientation, prevailing wind direction and albedo), and thus uncertainty (1) includes this effect unless stake distributions are sufficiently dense. Following the values estimated by previous Greenland studies (±0.23 to ±0.28 m w.e.) (Bauer, Reference Bauer1961; Braithwaite, Reference Braithwaite1986; Cogley and others, Reference Cogley, Adams, Ecclestone, Jung-Rothenhäusler and Ommanney1996; Machguth and others, Reference Machguth2016), we assumed ±0.25 m w.e. as an uncertainty arising from the SMB inhomogeneity. We also evaluated uncertainty introduced by interpolation and smoothing of the stake SMB data by taking RMSE (RMSE
bz
) of the data from the fitting curve. Accordingly, uncertainty (1) was estimated as $\sigma _{bz} = \sqrt {{0.25}^2 + {\rm RMSE}_{bz}^2} $
. Uncertainty (2) arises because of errors in the ice-cap margins determined by the satellite image. This was estimated by assuming half a pixel of the ALOS-PRISM image (1.25 m) as an error in the delineation process.
$\sigma _{bz} = \sqrt {{0.25}^2 + {\rm RMSE}_{bz}^2} $
. Uncertainty (2) arises because of errors in the ice-cap margins determined by the satellite image. This was estimated by assuming half a pixel of the ALOS-PRISM image (1.25 m) as an error in the delineation process.
The equilibrium line altitude (ELA) in each balance year was estimated by interpolation of the SMB from the stakes. For the years 2012/13 to 2014/15, the two uppermost stake data were extrapolated to a higher elevation to find ELA because no data were available in the accumulation area. Uncertainties in ELA (σ ELA) were estimated by taking σ b at two uppermost stakes used for the linear interpolation/extrapolation. Estimated ELA was used to compute the accumulation-area ratio (AAR).
Ice velocity
The mass-balance stakes were also used for ice velocity measurements. We used dual frequency GPS receivers and antennae (Leica, System 1200 and GNSS Technology Inc., GEM-1) to measure three-dimensional coordinates of the stakes. The stakes were surveyed twice every summer, so that summer and annual ice velocities were obtained each year. The periods of velocity measurements are summarized in Table 1. One of the GPS antennae was mounted on the top of the stakes to record GPS satellite signals every 1 s for at least 30 min. A reference station was operated in the Qaanaaq Village with the same recording intervals (Fig. 1c). GPS data were post-processed in a static mode with GPS software (RTKLIB). Standard deviations (std dev.) of the computed horizontal coordinates ranged from 2 to 9 mm. The uncertainty in the velocity obtained by the GPS survey (ε) was then estimated by considering error propagation (Redpath and others, Reference Redpath, Sirguey, Fitzsimons and Kääb2013):
 $$\varepsilon = \displaystyle{{\sqrt {{(\Delta x/l)}^2\left( {\sigma _{x_1}^2 + \sigma _{x_2}^2} \right) + {(\Delta y/l)}^2\left( {\sigma _{y_1}^2 + \sigma _{y_2}^2} \right)}} \over {\Delta t}},$$
where $\Delta l = \sqrt {\Delta x^2 + \Delta y^2} $
is the horizontal displacement, σ
x
and σ
y
are the std dev. in horizontal coordinates with a subscript indicating first and second surveys, and Δt is the survey interval.
$\Delta l = \sqrt {\Delta x^2 + \Delta y^2} $
is the horizontal displacement, σ
x
and σ
y
are the std dev. in horizontal coordinates with a subscript indicating first and second surveys, and Δt is the survey interval.
Ice temperature
Near-surface ice temperature was measured at Q1201, Q1204 and SIGMA-B (Fig. 1c). Thermistor sensors (Geokon, Model 3810) were installed on 1–3 August 2013 at the depth of 3, 8 and 13 m from the ice surface, using ~30 mm diameter holes drilled with a steam drill. The thermistors were calibrated in ice water (0°C) to convert measured resistance to temperature with an accuracy of ±0.2°C. Thermistor resistance at SIGMA-B was measured once a day from 3 August 2013 to 23 July 2015 with a data logger (Campbell Scientific, CR1000), using a 10 kΩ metallic coating resistance as a reference. The resistance of the thermistors at Q1201 and Q1204 was measured by connecting the same device to the sensors on 3 August 2014, 1 year after the installation to avoid the influence of the drilling.
Meteorological data
We used air temperature records from a weather station at Qaanaaq Airport located at 3.5 km northwest of Qaanaaq (Fig. 1b). Daily mean temperatures at this station since 1996 are distributed by the United States National Climate Data Center (http://www.ncdc.noaa.gov/). We used this data set to compute summer (June/July/August) mean temperature (SMT) for the periods corresponding to the balance years from 2012/13 to 2015/16.
Snow accumulation at SIGMA-B was estimated from snow height recorded every hour by an ultrasonic distance sensor (Campbell Scientific, SR50) from 29 July 2012 to 31 July 2016. The distance from the sensor to the snow surface was averaged for ±12 h, and increments in distance are attributed to snow deposition. Snow accumulation over each balance year was computed by assuming a fresh snow density with associated uncertainties of 120 ± 50 kg m−3 based on a previous Arctic study (Jones and others, Reference Jones, Pomeroy, Walker and Hoham2001). We also included possible displacement of the sensor (±0.1 m) in the error analysis.
RESULTS
Surface mass balance
SMB measured at Q1201–Q1206 for 2012–16 is summarized in Table 2. SMB in each balance year ranged from −1.19 to −0.12 m w.e. a−1 (2012/13), from −1.55 to −0.09 m w.e. a−1 (2013/14), from −2.15 to −0.26 m w.e. a−1 (2014/15) and from −2.15 to 0.16 m w.e. a−1 (2015/16). The most negative SMB was observed in 2014/15, whereas the most positive was in 2012/13 (Fig. 2a). For example, SMB at Q1201 in 2014/15 was 1.8 times more negative than in 2012/13.
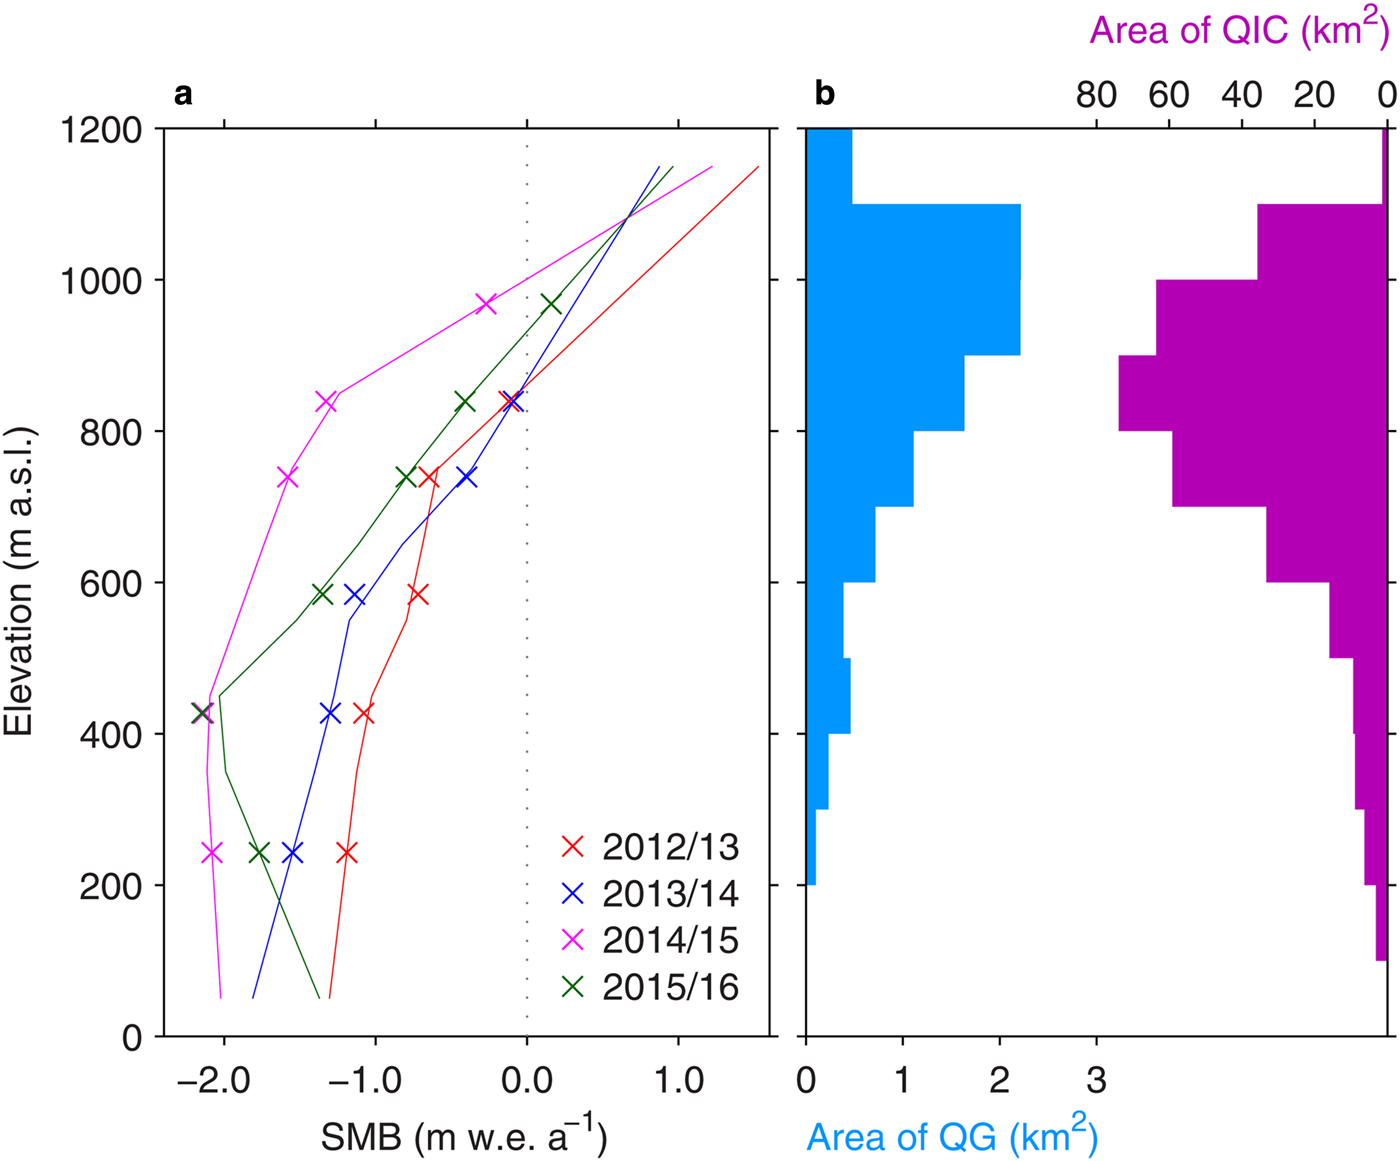
Fig. 2. (a) Measured SMB at Q1201–Q1206 (cross) and the SMB gradient every 100 m bin for the balance years 2012/13–2015/16. (b) Hypsometry of QG (blue) and QIC (purple) with altitude bands of 100 m.
The glacier-wide SMB (B QG) was +0.16 ± 0.29 m w.e. a−1 in 2012/13, −0.04 ± 0.30 m w.e. a−1 in 2013/14, −0.72 ± 0.32 m w.e. a−1 in 2014/15 and −0.27 ± 0.31 m w.e. a−1 in 2015/16. The mean glacier-wide SMB from 2012 to 2016 was −0.22 ± 0.30 m w.e. a−1. The ELA was 862 ± 8, 868 ± 19, 1001 ± 12 and 932 ± 9 m a.s.l. for the balance years from 2012/13 to 2015/16 (Table 3).
Table 3. The glacier-wide surface mass balance (SMB) of QG (B QG) and QIC (B QIC), and equilibrium line altitude (ELA) for the balance years 2012–16
Summer and annual ice velocities
Summer and annual mean ice velocities at Q1201–Q1206 are summarized in Table 4, and annual mean flow vectors in 2015/16 are shown in Figure 1c. The greatest velocities were observed at Q1203 and Q1204 (Fig. 3), where the glacier is relatively thick (~120–165 m) based on the previously reported ice radar survey (Sugiyama and others, Reference Sugiyama2014). Summer velocities observed from 18 to 29 July 2012 were significantly greater than those in the other periods (Fig. 3a). For example, at the middle part of the survey route (Q1203 and Q1204), the summer velocity in 2012 was 19% greater than those from the summers of 2013 and 2014. The summer velocity in 2012 was 10–30% faster than those computed over the second half of July 2013 and 2014; thus, the greater speed in 2012 cannot be attributed to the shorter observation period, as compared with the other two summers. The summer velocities in 2013 and 2014 are close to the annual mean velocities in 2012/13 and 2013/14 (Table 4).
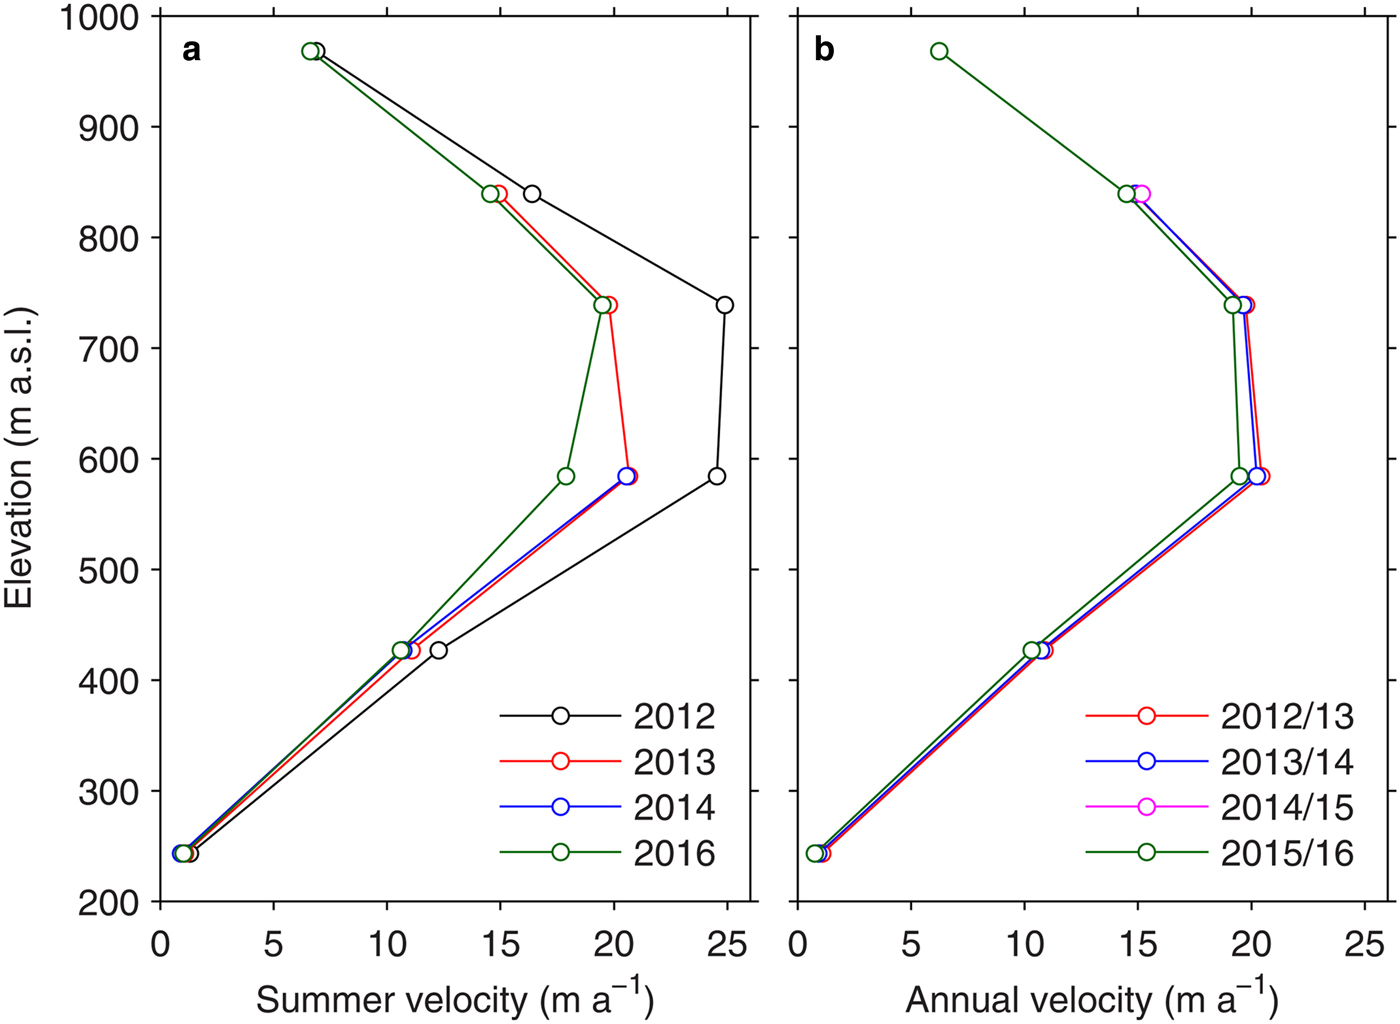
Fig. 3. (a) Summer ice flow velocity measured at Q1201–Q1206 in 2012–16. (b) Annual mean ice flow velocity at Q1201–Q1206 in 2012/13–2015/16.
Table 4. Summer and annual velocities at Q1201–Q1206
Near-surface ice temperature
Figure 4a shows near-surface ice temperature variations at SIGMA-B from August 2014 to July 2015. Ice temperature from August 2013 to July 2014 was excluded from the data to avoid the influence of drilling. The ice temperature at the depths of 3 and 8 m showed clear seasonal fluctuations, but the range of the variation reduces to 0.6°C at the depth of 13 m. The mean temperature at 13 m was −8.0°C. Figure 4b shows vertical ice temperature profiles measured on 3 August 2014. Ice temperature at the depth of 13 m was −10.5, −10.3 and −8.0°C at Q1201, Q1204 and SIGMA-B, respectively. The uppermost site showed 2.5°C warmer temperature than the lowermost site; thus, 13 m temperature was not a simple function of surface elevation.
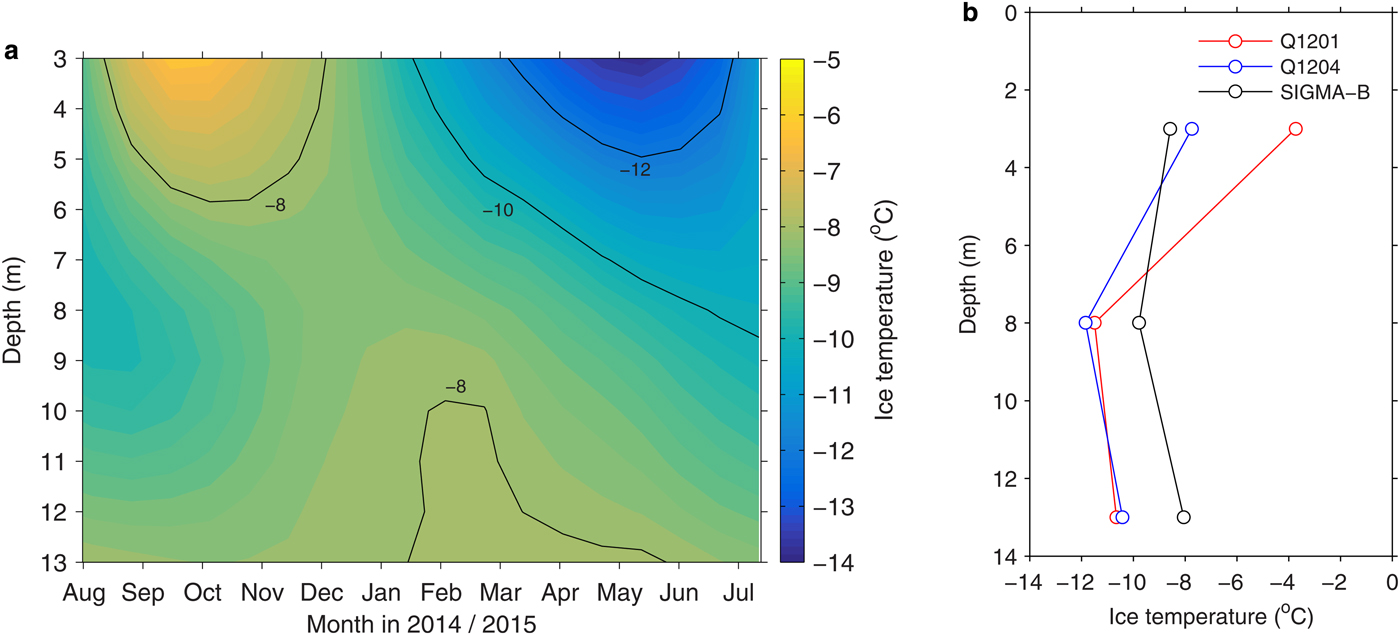
Fig. 4. (a) Ice temperature variations at SIGMA-B from 1 August 2014 to 23 July 2015. (b) Ice temperatures at the depth of 3, 8 and 13 m at Q1201, Q1204 and SIGMA-B measured on 3 August 2014.
Summer temperature and snow accumulation
Figure 5 shows daily mean air temperature at Qaanaaq Airport and daily snow accumulation at SIGMA-B from 2012 to 2016. Air temperature exceeded 0°C between late May and mid-September. SMT was 4.9, 4.9, 5.4 and 5.8°C for the balance years from 2012/13 to 2015/16 (Fig. 6). Snow accumulation occurred through the year, including the mid-summer period, and no clear seasonal variation was observed in the snow accumulation (Fig. 5). Cumulative snow accumulation was 0.68 ± 0.28, 0.52 ± 0.22, 0.40 ± 0.17 and 0.47 ± 0.20 m w.e. for the balance years from 2012/13 to 2015/16 (Fig. 6). The calculated snow accumulation is similar to the values reported for a coastal region in the northwestern Greenland ice sheet based on ice core analysis and ground-penetrating radar measurements: ~0.3 m w.e. for 1950–2000 (Bales and others, Reference Bales2009) and ~0.7 m w.e. for 1980–2007 (Hawley and others, Reference Hawley2014).

Fig. 5. Daily mean air temperature measured at Qaanaaq Airport and daily snow accumulation estimated from the sonic distance sensor measurement at SIGMA-B from 29 July 2012 to 31 July 2016. The color bands indicate the balance years 2012/13–2015/16 taken in this study.
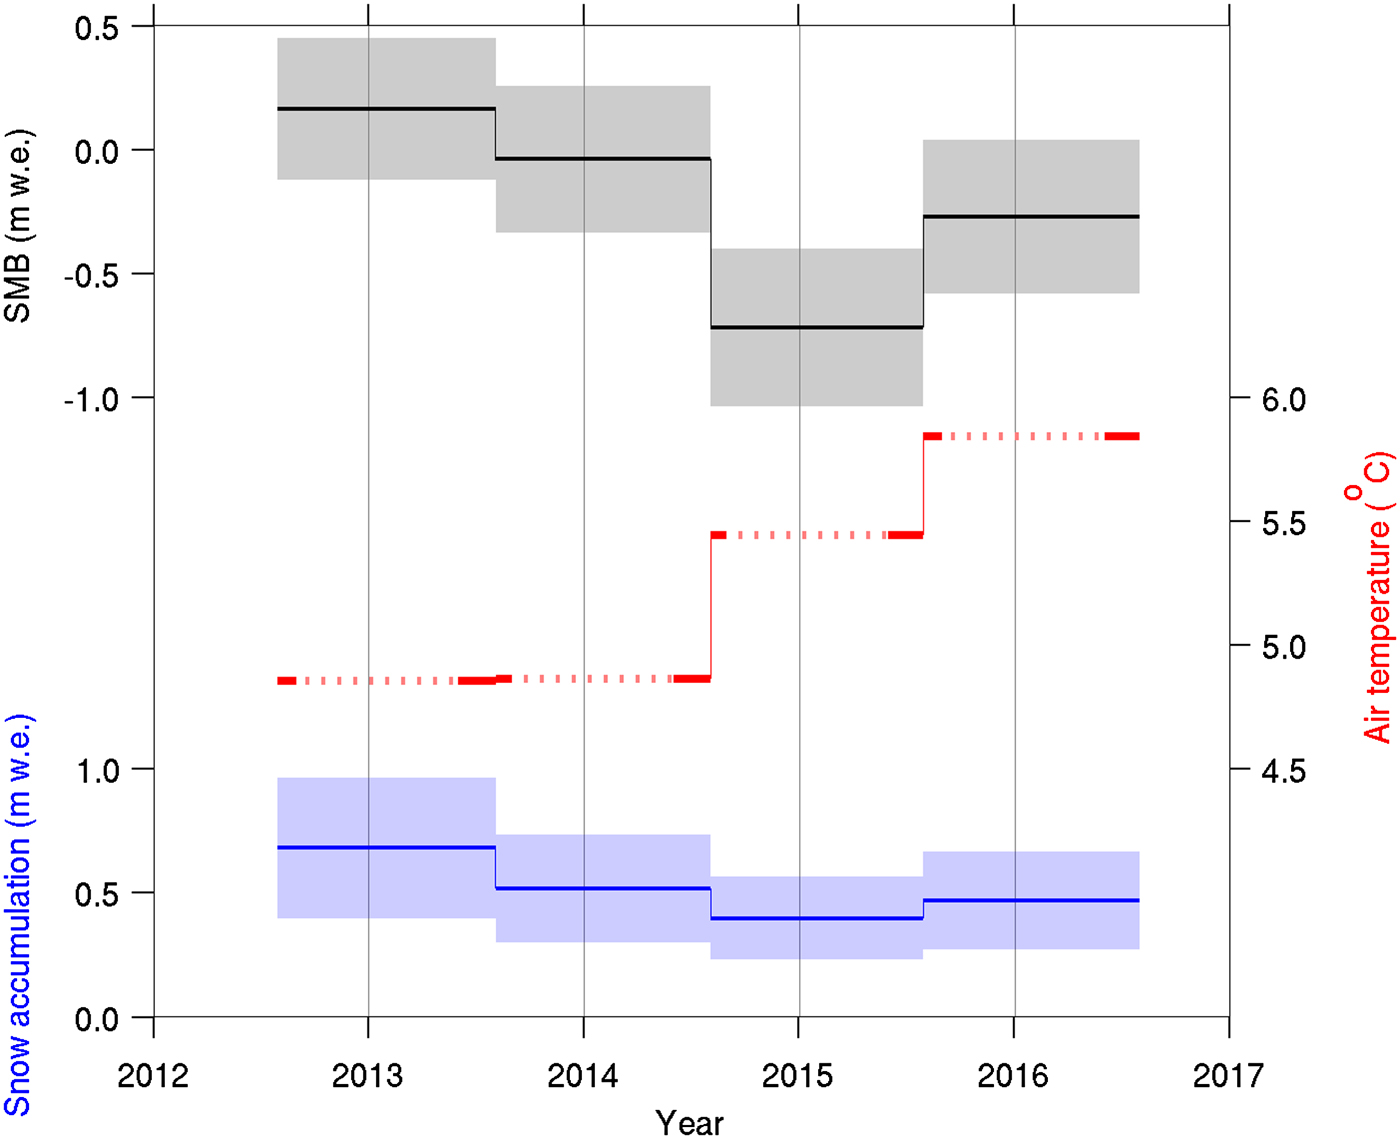
Fig. 6. The glacier-wide SMB (black), summer (June–August) mean air temperature at Qaanaaq Airport (SMT: red) and snow accumulation at SIGMA-B (blue). The solid line in temperature indicates the periods included in the temperature calculation.
DISCUSSION
Surface mass balance
Our in situ measurements revealed that the glacier-wide SMB of QG was negative over the study period except for 2012/13. Assuming the same SMB–elevation relationship over the entire ice cap, the ice-cap-wide SMB was estimated using Eqn (1). The ice-cap-wide SMB was −0.13 ± 0.26 m w.e. a−1 in 2012/13, −0.24 ± 0.27 m w.e. a−1 in 2013/14, −1.10 ± 0.29 m w.e. a−1 in 2014/15 and −0.52 ± 0.28 m w.e. a−1 in 2015/16 (Table 3). The mean mass loss from QIC for 2012–16 (−0.49 ± 0.27 m w.e. a−1) is in reasonably good agreement with the mass loss reported for all the peripheral GICs in northwestern Greenland in 2003–08 (−0.41 ± 0.17 m w.e. a−1) (Bolch and others, Reference Bolch2013). Saito and others (Reference Saito, Sugiyama, Tsutaki and Sawagaki2016) reported more rapid mass loss of QIC (−1.1 ± 1.3 m w.e. a−1) for a later period 2007–09 based on DEMs derived by satellite image photogrammetry. Our result indicates that the mass loss from QIC has decelerated in recent years after the significant mass loss in 2007–09. This trend is consistent with the extraordinarily warm summers from 2007 to 2012 (SMT > 6°C), which were followed by a sudden drop in SMT to ~4°C in 2013 (Saito and others, Reference Saito, Sugiyama, Tsutaki and Sawagaki2016). As revealed by our analysis, SMT never exceeded 6°C after 2013 during our study period (Fig. 6).
The mean AAR of QIC for 2012–16, obtained by assuming the same ELA over the entire ice cap and the hypsometry of QIC (Fig. 2b), was 0.29 ± 0.04, which is significantly smaller than those reported for other GICs in Greenland. For example, AAR of Mittivakkat Gletscher in southeast Greenland was 0.61 for 1995–2010 (Mernild and others, Reference Mernild2011). The AAR of QIC is also smaller than the mean AAR (0.44) of 86 GICs outside of Greenland for 1997–2006 (Bahr and others, Reference Bahr, Dyurgerov and Meier2009). Because AAR of a glacier in equilibrium is typically within a range of 0.5–0.6 (Dyurgerov and others, Reference Dyurgerov, Meier and Bahr2009), the small AAR of QIC is consistent with the negative mass balance during the study period. The obtained AAR suggests that mass loss from QIC is more significant than the average of GICs around the world. Because a large surface area is distributed near the ELA (Fig. 2b), the AAR of QIC is sensitive to the change in ELA. This explains the large interannual variability in AAR and the ice-cap-wide mass balance observed in this study. It is likely that a small increase in ELA in the future would cause rapid wastage of ice in QIC.
Mass balance of GICs in the Arctic region is sensitive to SMT. For example, mass loss of Mittivakkat Gletscher for 1996–2010 was primarily driven by warm summer conditions (Mernild and others, Reference Mernild2011). Mass loss from GICs in the Canadian Arctic increased from 2004–06 to 2007–09, which was attributed to an increase in surface ablation caused by elevated summer temperatures (Gardner and others, Reference Gardner2011). To examine the relationship between summer temperature and the glacier-wide SMB of QG, we compared the glacier-wide SMB with SMT in each balance year. SMT progressively increased from 4.9 to 5.8°C during 2012/13 and 2015/16, whereas SMB showed increasingly negative mass balance from 2012/13 to 2014/15 and then less negative balance in 2015/16 (Fig. 6). Although the data set is relatively small (n = 4), our data imply a negative relationship between SMT and SMB (Fig. 7a). The correlation is not high, suggesting that SMB is influenced also by other processes including winter precipitation. Our SMB data show a positive relationship with snow accumulation at SIGMA-B (Fig. 7b). It should be noted that the range of the annual variation in snow accumulation (0.40–0.68 m w.e.) is significantly smaller than that in SMB (−0.72 to +0.16 m w.e.). This implies that the influence of snow accumulation on SMB is amplified as it reduces summer melt by maintaining high albedo surface until later in summer. The importance of winter accumulation in recent mass loss was reported for Mittivakkat Gletacher as well (Mernild and others, Reference Mernild2011).
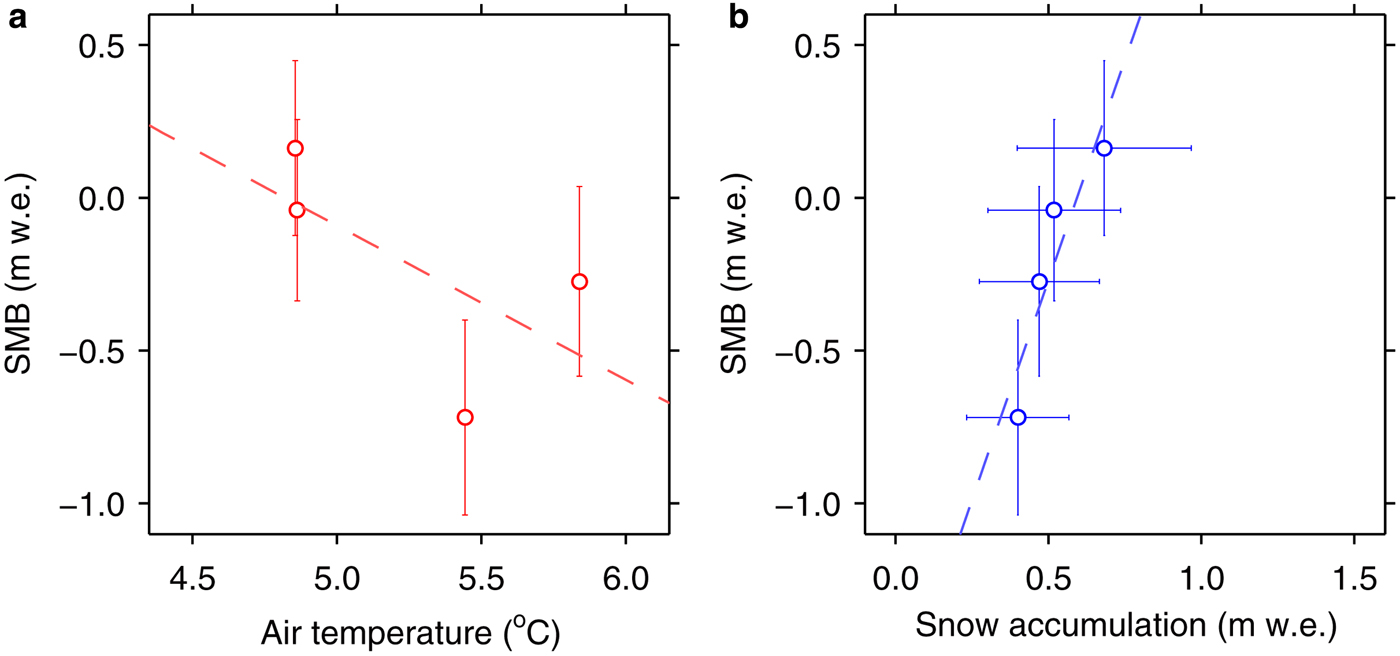
Fig. 7. Scatter plots between (a) SMB and SMT, and (b) SMB and snow accumulation. Dashed lines are a linear regression of the data.
The above discussion is based on data covering only four balance years. Therefore, continuing measurements in the future is crucial to better understand the mechanisms driving the mass balance of the ice caps in this region. It should also be noted that our SMB measurements cover only a portion of the ice cap, and thus spatial variability is difficult to accurately evaluate SMB distribution over the entire QIC. Ablation and accumulation processes are affected by slope orientation, surface albedo and deposition of drifting snow, causing significantly large spatial variations in SMB. Indeed, the rate of elevation change on the ice caps in northwestern Greenland is spatially non-uniform, under the influence of altitudinal distribution of ice-cap surface area as well as spatial distribution of surface albedo (Saito and others, Reference Saito, Sugiyama, Tsutaki and Sawagaki2016). Snow accumulation is also highly variable spatially in the region (Bales and others, Reference Bales2009). Spatially distributed measurements and modeling are required to more accurately quantify the SMB over the entire ice cap.
Seasonal ice acceleration
Summer speed up was observed at Q1203 (584 m a.s.l.) and Q1204 (739 m a.s.l.) in 2012 (Fig. 3a). Seasonal speed up was reported at several GICs in the Arctic region: Flade Isblink Ice Cap in northeastern Greenland (Palmer and others, Reference Palmer, Shepherd, Sundal, Rinne and Nienow2010), Mittivakkat Gletscher in southeastern Greenland (Mernild and others, Reference Mernild2013), John Evans Glacier, Nunavut, Canada (Bingham and others, Reference Bingham, Nienow and Sharp2003) and Nordenskiöldbreen in Svalbard (Den Ouden and others, Reference Den Ouden2010). The mean air temperature at Qaanaaq Airport during June and August 2012 (6.2°C) was higher than those in 2013 (4.1°C), 2014 (5.4°C), 2015 (5.5°C) and 2016 (6.0°C). In July 2012, extraordinarily warm weather caused a melt event over >90% of the Greenland ice sheet (e.g. Nghiem and others, Reference Nghiem2012). It is likely that such warm weather conditions enhanced supraglacial meltwater production and the water penetrated to the bed of QIC, thereby increasing basal motion and causing seasonal ice speed up. This mechanism, so-called supraglacial hydraulic forcing (e.g. Zwally and others, Reference Zwally2002; Bingham and others, Reference Bingham, Nienow, Sharp and Boon2005), also explains diurnal ice speed variations observed at the same sites in July 2012 (Sugiyama and others, Reference Sugiyama2014).
In northwestern Greenland, SMT has increased by 2.5°C from 2001 to 2012 (Wong and others, Reference Wong2015). Under a recent warming trend, seasonal speed up would occur more frequently in QIC and potentially accelerate mass loss by transporting ice more rapidly to lower elevations. On the other hand, studies in the lower ablation area of the land-terminating section of the ice sheet suggest that increased meltwater input increases subglacial drainage system efficiency and causes a decrease in annual velocity (Van de Wal and others, Reference Van de Wal2008; Sole and others, Reference Sole2013; Tedstone and others, Reference Tedstone2015). A more recent study by Van de Wal and others (Reference Van de Wal2015) demonstrated that the impact of meltwater increase on ice dynamics is more important in the upper ablation zone near ELA. Further observation of seasonal and interannual variability in ice velocity is needed to better understand the influence of atmospheric warming on the ice dynamics of QIC.
Ice temperature
It is often approximated that 10 m-depth ice temperature is equal to mean annual air temperature. However, ice temperature at SIGMA-B (944 m a.s.l.) was warmer than those at Q1201 (243 m a.s.l.) and Q1204 (739 m a.s.l.). Sugiyama and others (Reference Sugiyama2014) computed the ice temperature of QIC with a thermomechanically coupled ice flow model. Surface ice temperature was prescribed in the model by assuming it was equal to mean annual air temperature estimated from the temperature at Qaanaaq Airport (−8.0°C) and the lapse rate obtained with data from SIGMA-B (−4.42 × 10⁻³ K m−1). Ice temperatures measured in this study at 739 and 944 m a.s.l. were warmer than the above estimate by 1.4 and 4.6°C, respectively. Near the glacier front at 243 m a.s.l., the measured ice temperature was 1.4°C colder than the estimated air temperature (Fig. 8). These results demonstrated that near-surface ice temperature of QIC is controlled not simply by air temperature. One of the relevant processes is heating by latent heat released when surface meltwater percolates and refreezes in a cold firn layer, or on the ice surface (e.g. Cox and others, Reference Cox, Humphrey and Harper2015). A 0.35 m thick superimposed ice was formed at Q1206 (968 m a.s.l.) between July 2013 and August 2014, which implies the influence of refreezing on the ice temperature. Such heating due to the release of latent heat was reported in the accumulation zone of GICs in Svalbard (Watanabe and others, Reference Watanabe2001; Schäfer and others, Reference Schäfer2012; Van Pelt and Kohler, Reference Van Pelt and Kohler2015), northern Sweden (Reijmer and Hock, Reference Reijmer and Hock2008) and the Canadian Arctic (Zdanowicz and others, Reference Zdanowicz2012; Bezeau and others, Reference Bezeau, Sharp, Burgess and Gascon2013; Gascon and others, Reference Gascon, Sharp, Burgess, Bezeau and Bush2013). This process is not effective at Q1201 and Q1204 in the ablation zone because bare ice surface prevents percolation and refreezing of meltwater. Surface meltwater also transports sensible heat into ice when it flows into crevasses or moulins (e.g. Bingham and others, Reference Bingham, Hubbard, Nienow and Sharp2008; Wohlleben and others, Reference Wohlleben, Sharp and Bush2009). This process is likely in QIC because we frequently observed surface water flowing into shallow cracks near the SIGMA-B site. In addition to the influence of meltwater, snow cover maintains ice at a relatively warm temperature by insulating the ice surface from cold air during the winter. These processes are complex and difficult to evaluate quantitatively from available data. Therefore, more detailed study of heat balance is needed to further understand ice temperature distributions in QIC and its influence on the ice dynamics.
Fig. 8. Ice temperatures at the depth of 13 m at Q1201, Q1204 and SIGMA-B measured on 3 August 2014. Dashed line indicates mean annual air temperature estimated in Sugiyama and others (Reference Sugiyama2014).
CONCLUSION
We carried out field measurements on QIC in northwestern Greenland over the summers of 2012–16. SMB, ice velocity and near-surface ice temperature were measured along a survey route from the terminus of an outlet glacier to an elevation of 968 m a.s.l. Ice-cap-wide SMB obtained from SMB measured at six locations showed a large interannual variability, ranging from −1.10 ± 0.29 to −0.13 ± 0.26 m w.e. a−1 during the study period. We found a negative relationship between SMB and SMT and a positive relationship between SMB and snow accumulation. This result implies that the mass balance of GICs in northwestern Greenland is affected by atmospheric warming and possible change in precipitation. Ice flow velocity showed seasonal acceleration only in summer 2012, suggesting that surface meltwater penetrated to the bed and enhanced basal ice motion under the extraordinarily warm 2012 summer conditions. Near-surface ice temperature in the upper reaches (944 m a.s.l.) was 2.5°C higher than that near the terminus (243 m a.s.l.), suggesting the thermodynamics of the ice cap are affected by heat carried by meltwater and insulation of the snow layer. Monitoring of these processes on QIC, that is, SMB, ice speed and temperature, for longer periods in the future would help us to understand the evolution of the GICs in Greenland.
ACKNOWLEDGEMENTS
The authors would like to thank T. Sawagaki, S. Matsuno, M. Maruyama, J. Saito and the members of the 2012–16 field campaigns in Qaanaaq. Special thanks are due to S. Daorana and T. Ohshima for providing logistical support in Qaanaaq. The manuscript was handled by the Scientific Editor C. Reijmer, and carefully commented by two anonymous reviewers. This research was funded by MEXT (Japanese Ministry of Education, Culture, Sports, Science and Technology) through the Green Network of Excellence (GRENE) Arctic Climate Change Research Project and the Arctic Challenge for Sustainability (ArCS) Project. This study was also supported by the Japan Society for the Promotion of Science (JSPS), Grant-in-Aid for Scientific Research, number 23221004 and 16H01772 (SIGMA Project). The authors also thank H. Enomoto for his contribution as the leader of the GRENE project. ArcticDEMs provided by the Polar Geospatial Center under NSF PLR awards 1043681, 1559691 and 1542736.


 Open access