Introduction
The surface fluxes of radiation, sensible and latent heat and momentum are important links between the atmosphere and the ice. Over the polar ice pack Uiere are few surface-based measurements of these qualities, and the measurements that do exist are for isolated points and are of relatively short duration. Our understanding of the Arctic climate and our ability to predict the weather would he improved with accurate and timely estimates of these fluxes over the entire Arctic Basin. Satellite observations hold some promise of determining these lluxes with sufficient accuracy. In this paper we explore the possibility of estimating surface lluxes of sensible heal and momentum using the TIROS Operational Vertical Sounder (TOVS) on the National Oceanic and Atmospheric Administration (NOAA) series of polar-orbiting satellites. Information retrieved from TOVS data has tremendous potential for studies of energy transfer and atmospheric dynamics over sea ice where conventional data are sparse. This rich source has only begun to be tapped. Reference FrancisFrancis (1994). for example, uses retrievals to investigate the adveetion of heat from lower latitudes into and within the Arctic basin, and data from TOYS have also been used to estimate Arctic surface radiation fluxes (Reference Schweiger and KeySchweiger and Key. 1997).
Large-scale models of sea ice require inputs of geostrophic wind, downwelling shortwave and longwave fluxes and surface air temperature. Downwelling shortwave and longwave Muxes are traditionally computed using simple parameterizations based on air temperature, cloud fraction and humidity. Questionable climatologies or data from poorly validated numerical weather-prediction models are frequently used for these inputs. Turbulent exchange of heat is specified using bulk formula with a surface skin temperature determined from a surface energy-balance equation. A constant geostrophic drag coefficient is used to determine the ice stress, ignoring changes in the boundary-layer stratification that can have important ramifications for the actual stress (Reference Overland and DavidsonOverland and Davidson, 1992).
Our approach to the problem of estimating the turbulent fluxes using satellite data is to model temperature profiles in the ice and the atmosphere over time, and to determine within the model the required sensible heat and momentum fluxes needed to maintain the surface energy balance. We use observations from the April 1992 Lead Experiment (LeadEx) ice camp to verily the results.
The numerical experiments described below demonstrate a simple one-dimensional (1-D) thermodynamic sea-ire model that is driven by input variables first derived from surface-based observations and then derived from satellites. The modeled atmospheric profiles of temperature and wind are allowed to vary in time so the surface stress can respond to the changing stratification of the boundary layer. The model is used to compute turbulent fluxes in a series of three experiments.
-
(a) Experiment 1: surface forcing. The first experiment is designed to establish a baseline for Comparison with the other two experiments. It uses surface-based observations only and does not include a boundary-layer model. The surface turbulent fluxes calculated in this model are compared to surface measurements. The forcing parameters are surface-observed air temperature, humidity, winds for a height of 2 m, and downwelling shortwave and longwave radiative fluxes. The free parameters are skin temperature, ice-temperature profile and surface turbulent fluxes.
-
(b) Experiment 2: radiosonde forcing. The second experiment is designed to show that the boundary-layer portion of the model works correctly. The forcing parameters are radiosonde data (temperature, humidity and wind vector) from the 850 mb level and surface-observed downwelling radiative fluxes. The free parameters are the same as those in experiment 1. plus boundary-layer (850 mb to the surface) profiles of air temperature, humidity and wind vector.
-
(c) Experiment 3: TOVS forcing. The third experiment is designed to show the utility of satellite-based observations. The forcing parameters are the 850 mb air temperature and humidity retrieved from TOVS, geostrophic winds from buoy-observed pressure fields (assumed to apply to the 850 mb level) and radiative flux estimates derived from TOVS radiances, free parameters are the same as those in experiment 2.
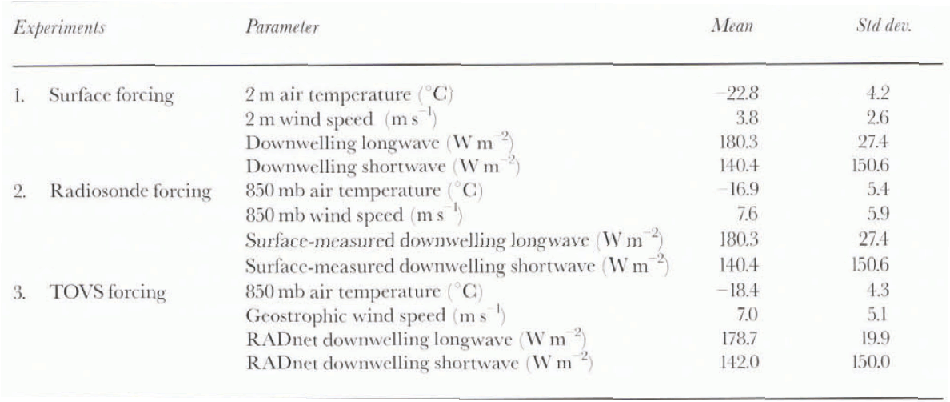
The forcings for the three experiments are summarized Table 1. which includes the mean and std dev. of each parameter. The fluxes computed in experiments 2 and 3 are compared to those computed in experiment 1.
Table 1. Forcings for three numerical experiments
Model Description
We adapted a 1-D boundary-layer model taken from the National Center for Atmospheric Research Community Climate ModelVersion 2 (NCAR-CCM2; Reference Hack, Boville, Briegleb, Kiehl, Rasch and WiliamsonHack and others. 1993). We used only the components that compute the vertical diffusion, the surface energy balance and the subsurface thermal flux. The model is essentially a column model that extends from the bottom of the ice to either the 2 m or 850 mb level in the atmosphere. The principal forcing parameters are air temperature and wind velocity at the forcing level (2 m or 850 mb) and surface downwelling radiative fluxes. Figure 1 shows a schematic diagram of the model.
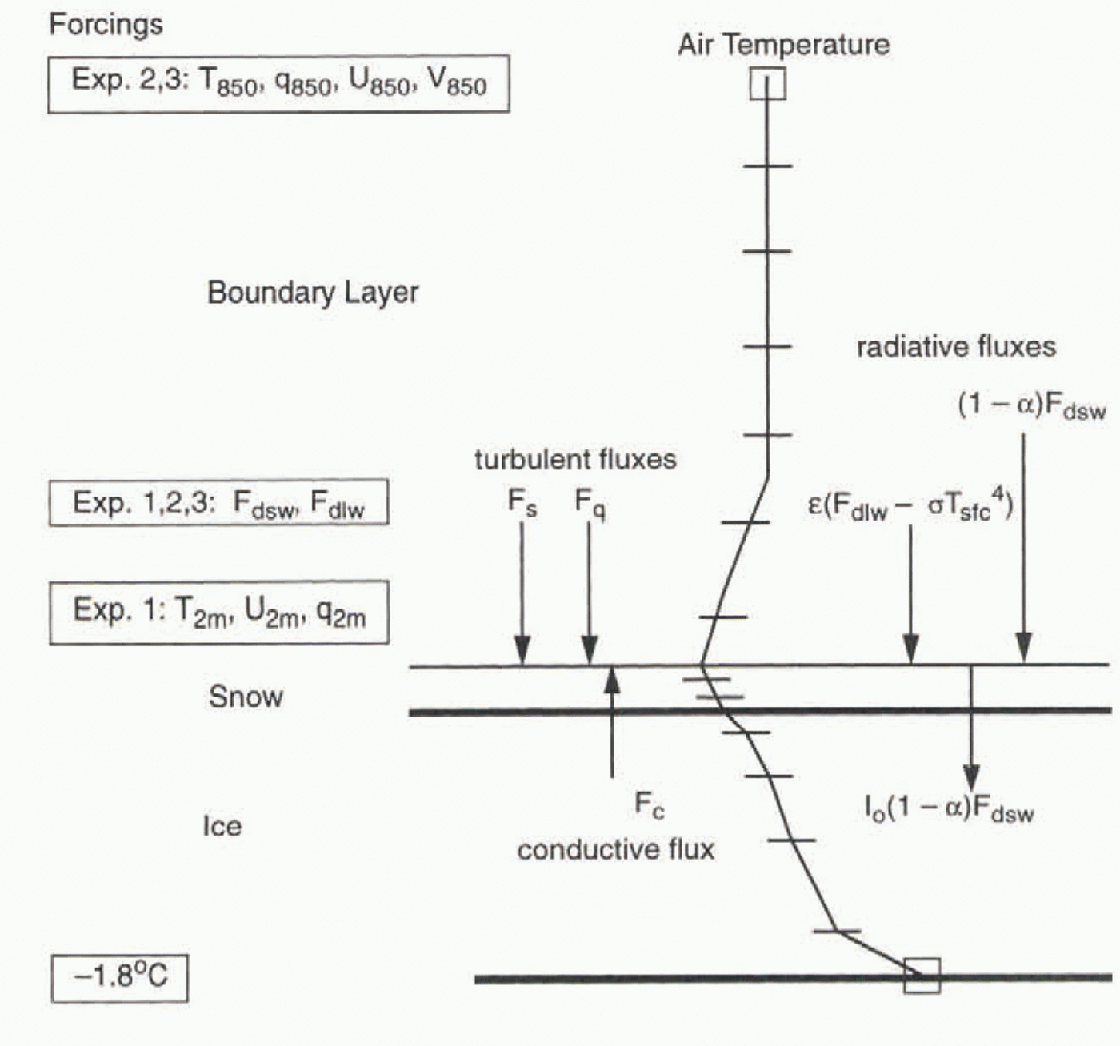
Fig. 1. Schematic of the model temperature profile and heat fluxes. The foreing parameters are the surface downwelling radiative fluxes and the air temprature and wind speed at either a height of 2m (experiment 1) or at the 850mb level (experiments 2 and 3). There are five layers within the snow, five within the ice. and 10 within the atmospheric boundary layer.
We selected tin- NCAR-CCM2 model because it is well established in the scientific community, runs quickly and can be forced with the observations at hand.The adaptation of the CCM2 model leaves out the algorithm that determines radiative heating rates within the atmosphere. We discuss briefly each of the model components in turn, beginning with the ice model, then the surface energy-balance model and finally the boundary-layer model.
Thermodynamic Ice model
The thermodynamic ice model is in the tradition of Reference Maykut and UntersteinerMaykut and Untersteiner (1971). We use a version of the CCM2 subsurface thermal model that includes enhanced ice physical properties, additional ice and snow layers, and penetration of solar flux below the surface. The temperature profile is calculated by solving the thermal dilfusivity equation for 10 layers with a fully implicit Crank-Nicholson scheme. Layer thickness, density, heat capacity and thermal conductivity are specified. There are five quadratically spaced layers in the snow and five in the ice. The top layer in the snow is 1 cm thick. in order to resolve fluctuations on the order oif one hour (Reference Guest, Davidson, Johannessen, Muench and OverlandGuest and Davidson. 1994). The solar radiative flux is allowed to penetrate the surface and be absorbed throughout the snow layer, with but a small fraction entering the ice (Reference GrenfellGrenfell. 1979). Consistent with observations mack- at the LeadEx camp, the snow depth in the model is 10cm, the snow density is 400kgm−3, the ice thickness is 3.0 m and the albedo is 0.80. All four are held constant.
Surface energy balance
The terms of the energy balance flux the surface layer in the snow include the net radiation. Fr the sensible heat flux. Fg, the latent heat flux, Fg, and the conductive flux from below. Fc. The balance is expressed as:
All fluxes are considered positive if directed toward the surface, and the balance is zero because the top layer in the snow has negligible heat capacity and melting does not occur. The net radiation consists of both the shortwave and longwave components:
where Fdsw and Fd1w are the downwelling shortwave and longwave fluxes at the surface. α is the albedo of the ice. I0 is the fraction of the net shortwave flux that penetrates below the first layer, ε is the surface emissivity, σ is the Boltz-mann constant and life is the surface (skin) temperature. The dow dwelling radiative fluxes are prescribed either from direct measurements experiments 1 and 2) or from fluxes derived from TOVS radiances (experiment 3).
The sensible heal flux is determined bv using a stability-dependent exchange coefficient (Reference Hack, Boville, Briegleb, Kiehl, Rasch and WiliamsonHack and others, 1993):
where Tsfc, is the model-calculated surface (skin) temperature, ρ is the air density and cp the heal capacity. The air temperature Tair and the wind speed U is for a height of 2 m in experiment 1 and the midpoint of the lowest layer (30 m) in experiments 2 and 3. The stress is also found using a bulk parameterization:
The transfer Coefficients Cs and Cd are calculated as functions of the bulk Richardson number of the lowest layer The latent heat is determined with the model-calculated surface- (skin) mixing ratio, and the mixing ratio determined either from the relative humidity measurements at 2m (experiment 1) or estimated by the model forthelowest layer (experiments 2 and 3). The transfer coefficient for humidity is the same as that for sensible heat.
The 10m neutral values of the heat-transfer coefficient and the drag coefficient are set Io the average values measured ai the camp, Cd = Cs = 0.0012. Note that this measured value of Cs is corrected from that reported in Reference Ruffieux, Persson, Fairall and WolfeRuffieux and others (1995). based on a correction of die infrared measurements of the surface temperature. The uncertainty in the measured values of these coefficients is 0.0002. The same coefficients are used in all three experiments.
Atmospheric boundary-layer model
The boundary-layer model is outlined in Reference Holtslag and BovilleHollslag and Boville (1993) and in Reference Hack, Boville, Briegleb, Kiehl, Rasch and WiliamsonHack and others (1993). It is an explicit, non-local parameterization of the vertical fluxes of heat, moisture and momentum based on eddy diffusivities. The eddy diffusivities are the same for all three fluxes. The local diffusion scheme uses an eddv diffusivity determined independently at each point in the column, based on local vertical gradients of wind and virtual potential temperature, similar to the usual approach in global atmospheric models. The non-local scheme, used in unstable conditions only, determines an eddy-diffusivity profile based on a diagnosed boundary-layer height and a turbulent-velocity scale. It can allow for a flux directed counter to the local gradient. The major advantage of the non-local parameterization is that large eddy transport is accounted for and entrainment effects are treated implicitly.
There are 10 layers in the model. The first is centered at 30m, the second al 73 m and the rest are approximately 140 m thick. The boundary-layer model provides tendency terms for tenmerature, moisture and wind velocity at each level. Geostrophic adjustment terms are also included for the wind velocity. the model time-step is 15 minutes.
Forcing Parameters
Surface data
The LeadEx ice camp occupied a multi-year ice flow from 20 March to 22 April 1992 in the Beaufort Sea. about 400 km north of Dead horse. Alaska. The purpose of the experiment was to study the physical processes associated with leads in heavy pack ice. At the main camp a full set of meteorological observations was made with 15 minute averaging periods. In addition, radiosonde ascents and measurements of radiative and turbulent fluxes were made, The surface observations were reviewed by Reference Ruffieux, Persson, Fairall and WolfeRuffieux and others (1995). The authors report significant diurnal cycles in observed skin temperature, air temperature, relative humidity, net radiation and sensible heal flux. The wind speed was measured at a height of 3 m, and hence the wind speed was adjusted to 2 m with a factor of 0.96. based on a logarithmic wind profile. The average and std dev. of each of the forcing parameters arc shown in Table 1. Figure 2 shows the 2 in air temperature and the 2 in wind speed for the period 28 March (day 87) to 21 April (day 111), and Figure 3 shows the downwelling shortwave and longwave fluxes. The turbulent flux measurements for the period (sensible heat and stress) are show n in Figure 4. Reference Ruffieux, Persson, Fairall and WolfeRuffieux and others (1995) reported that the measurement uncertainties are ±2 Wm 2 in the sensible heat flux, ±0.003 Ntm−2 in the stress, and ±3 W m2 in the downward-longwave radiative flux. The two shortwave-flux instruments used in the field agreed to within 2% ((about 10 W m−2 at midday).
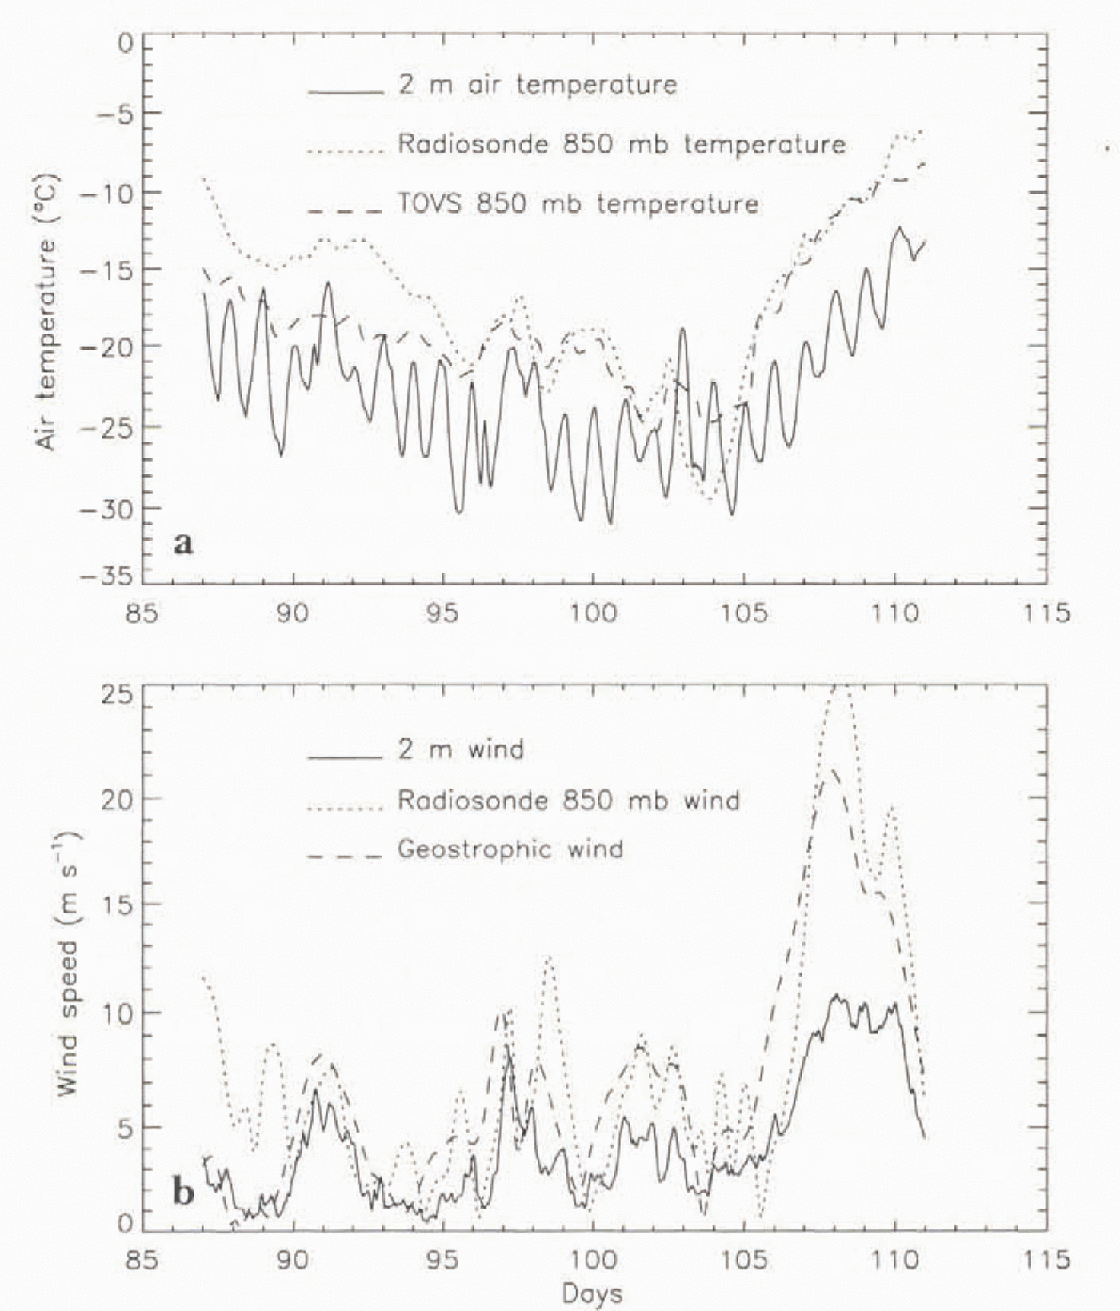
Fig. 2. Comparisons of the forcing air temperatures (a) and the forcing wind speeds (b).

Fig. 3. Comparison of the measured downwelling radiative pluses at the LeadEx camp to those derived from the TOVS radiances: (a) shortwave and (b) longwave. The shortwave fluxes are nearly identical because of the common solar-zenith-angle dependence, so only the daily maxima in the TOVS-based estimates are plotted.

Fig. 4. Surface turbulent fluxes from experiment 1 with surface forcing (line) and from measurements (points): (a) sensible heat flux, (b) stress. The measurements are hourly averages and the model output is hourly.
Radiosondes
The radiosonde observations from the LeadEx camp and nearby shore stations were reviewed by Reference Persson, Ruffieux and DavidsonPersson and others (1992). They reported that a well-mixed daytime boundary layer, with a depth of a few hundred meters, was common but not always present, and that the median height of the inversion base was only 28 m. The median inversion depth was 589 m. They also reported that low-level jets were common, and that the air in the boundary layer was often saturated with respect to ice. The ascents were made ever) 12 hours and hourly time-series for the 850 mb level were gen-erated with cubic spline interpolations. The air temperature and wind speed for that level are shown Ln Figure 2. Note that the 850 mb temperature averages over 5°C warmer than the 2m temperature. The measured winds, both at the surface and aloft, indicate a high wind event in the last live dav s of the period. This event is accompanied by significant warming.
TOVS
The TOVS instrument comprises three radiometer arrays, two of which are used in the retrieval. The High-resolution Infrared Radiation Sounder (HIRS) has 24 channels in the visible through thermal infrared spectrum, and the Microwave Sounding Unit (MSU) has 4 channels in the 60GHz oxygen band. Radiances were processed with a version of the Improved Initialization Inversion (31) algorithm (Reference Chedin, Scott, Wahiche and MoulinerChe-din and others, 1985) that has been improved for applications in polar regions (Reference FrancisFrancis, 1994). Temperature profiles, humidity in five thick layers, cloud formation and surface skin temperature are produced for each retrieval. Daily gridded fields of the various parameters at 100 km resolution north of 60° N are produced for the NASA Pathfinder Program and are available from the National Snow and Ice Data Center. This project uses individual retrievals, not the gridded fields.
The accuracy of TOVS-derivcd air temperature usually decreases below 900 mb. consequently we use the retrieved 850 mb air temperature to force the model. The wind speed at this level is assumed to be geostrophic. determined from air pressure measurements made by surface buoys. There are about 100 TOVS retrievals each day within a 200 km range of the ice station. A smooth time series of the various parameters is derived from these retrievals by averaging simultaneously in time and space all observations within 200 km of the camp that were obtained within one day of the target time. The TOVS 850 mb air temperatures are compared to the radiosonde observations in Figure 2. The comparison is good except for the first eight days, when the TOVS temperature is up to 5°C warmer than the radiosonde measurements, This is a time of generally greater cloud cover as shown in the higher values of the downwelling longwave fluxes seem in Figure 3. The clouds may have contributed to the error in the retrieved temperature. Also seen in Figure 2 is the time series of the geostrophic wind speed determined from air pressure measurements made by buoys and interpolated by the International Arctic buoy Program, The mean geostrophic wind speed is 7.0ms−1 (Table 1). The 850mb radiosonde winds average 0.6ms−1 more than the geostrophic winds and the rms difference between them is 3.4 ms−1.
Downwelling shortwave (DSW) and longwave (DLW) radiation fluxes at the surface are obtained directly Iiom TOVS brightness temperatures using the method developed by Reference Schweiger and KeySchweiger and Key (1997).This method i (RADnet) is based on a neural network that was trained using surface observations from the LeadEx experiment. It uses TOVS HIRS and MSL brightness temperatures as inputs and provides estimates of DLW and DSW as outputs.
The DLW fluxes were interpolated to hourly observations by averaging in time and space as discussed above. DSW observations, naturally displaying a large diurnal cycle, were interpolated to hourly values using a “solar zenith angle” weighting scheme. RADnet-compputed DWS values at satellite overpass times were used to compute an “apparent cloudiness” by inverting the downwelling shortwave parameterization given by Reference ShineShine (1984). This parameterization is designed to estimate the downwelling shortwave flux using the solar zenith angle, cloudiness, cloud optical depth and surface albedo. For each retrieval, the cloud fraction required to obtain the TOVS-estimated DSW in the Reference ShineShine (1984) parameterization is determined using constant values for albedo and optical depth. The apparent cloudiness includes other radiative effects, such as DWS retrieval error, variable albedo and variable cloud optical depth, as well as radiative effects not included in the parameterization. This apparent cloudiness is then averaged in time and space to form an hourly time series. The hourly cloud fractions are finally used in the Reference ShineShine (1984) parameterization to compute hourly DWS fluxes. The mean differences between the measured downwelling fluxes and the TOVS-derived fluxes arc less than 2 W m−2. The rms differences are 16.8 Wm 2 for DWL and 21.3 Wm −2 for DSW. The time series for both fluxes are compared to the surface-measured values in Figure 3 in which lhe DWS From TOVS is plotted only at local noon, since the TOVS-based estimate and the measured value from the camp are similar when viewed as time series.
Results
We used 24 hour running mean values for numerical comparisons applied to both the measured and the modeled fluxes. We did this because the fluxes values for both the radiosondes and for TOVS are derived from either twice daily samples (radiosondes) or from running 24 hour mean values (TOVS). In addition, variations on scales of < 1 day are of limited interest for most climate studies. The mean and std dev. of the measured turbulent fluxes are show n in Table 2, in which the std dev. is indicated for hourly averages and daily averages. Times when the wind direction corre-sponded to the direction of the camp hav e been excluded. Comparisons of vthe surface flux values from lhe three numerical experiments are summarized in Table 3. First, experiment 1 is compared to the measurements, then experiments 2 and 3 arc compared to results from experiment 1.
Table 2. measured turbulet fluxes

Table 3. Sensible heat flux and Stress comparisons (daily averages)
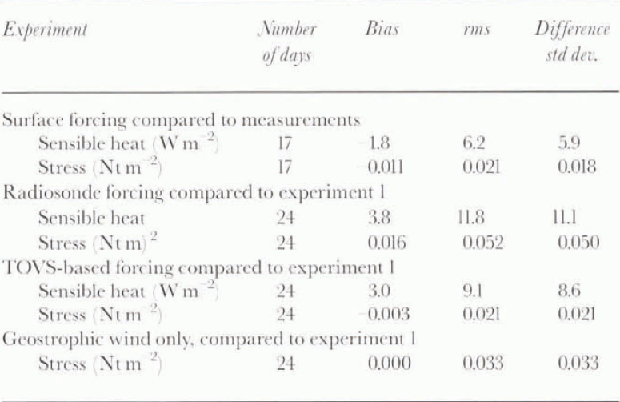
Figure 4 shows time series of sensible heal flux and stress for experiment 1 compared to hourly averages of the surface measurements. The diurnal cycle of the sensible heal flux is well represented, but significant biases appear in the last few days when the winds are strongest. The change in the magniiude of the differences may be associated with unknown changes in snow depth, density or albedo that are associated with the wind storm or with changes in the measurement systems.Table 3 compares the daily (24 hour running mean) values of the results of experiment 1 to the measurements. The bias is −1.8 Wm−2. The rms difference is larger (6.2−2), reflecting errors in the model including characterization of the surface or errors in the flux measurements. Errors in either the turbulent-flux measurements or the radiative-flux measurements would both contribute to differences between the measured and the modeled fluxes. The average model stress is 0.0011−2 less than the measured stress, indicating that the reported mean value of the 10m drag coefficient may have been based on a slightly different sub-set of the stress measurements. A value of Cd = 0.014 provides near perfect agreement, a value that is within the range of uncertainty in the reported value.
Experiments 2 and 3. which include the boundary layer, are compared to the results of experiment 1 in Figure 5 and in Table 3. In the radiosonde-based estimates of the sensible heat flux the bias and the rms difference are 3.8 W m−2 and ll.8Wm−2, respectively Wiih the TOVS-based estimates, these differences drop to 3.0Wm−2 and 9.1 Wm−2 Thestress estimates are also slightly better with the TOVS-based model. The bias is 0.016 Ntm2 for experiment 3. The rms differences are 0.052m−2 and 0.021 Nt m−2 respectively. The improved performance of the TOVS-based model may be due to the increased averaging (horizontal, vertical and temporal) inherent in the TOVS-based forcing. It may also reflect the presence of significant thermal wind effects that are not included in the model. These effects would make the 850 mb radiosonde wind a poorer basis for estimating the surface stress compared to the surface geostrophic wind that is used in experiment 3.
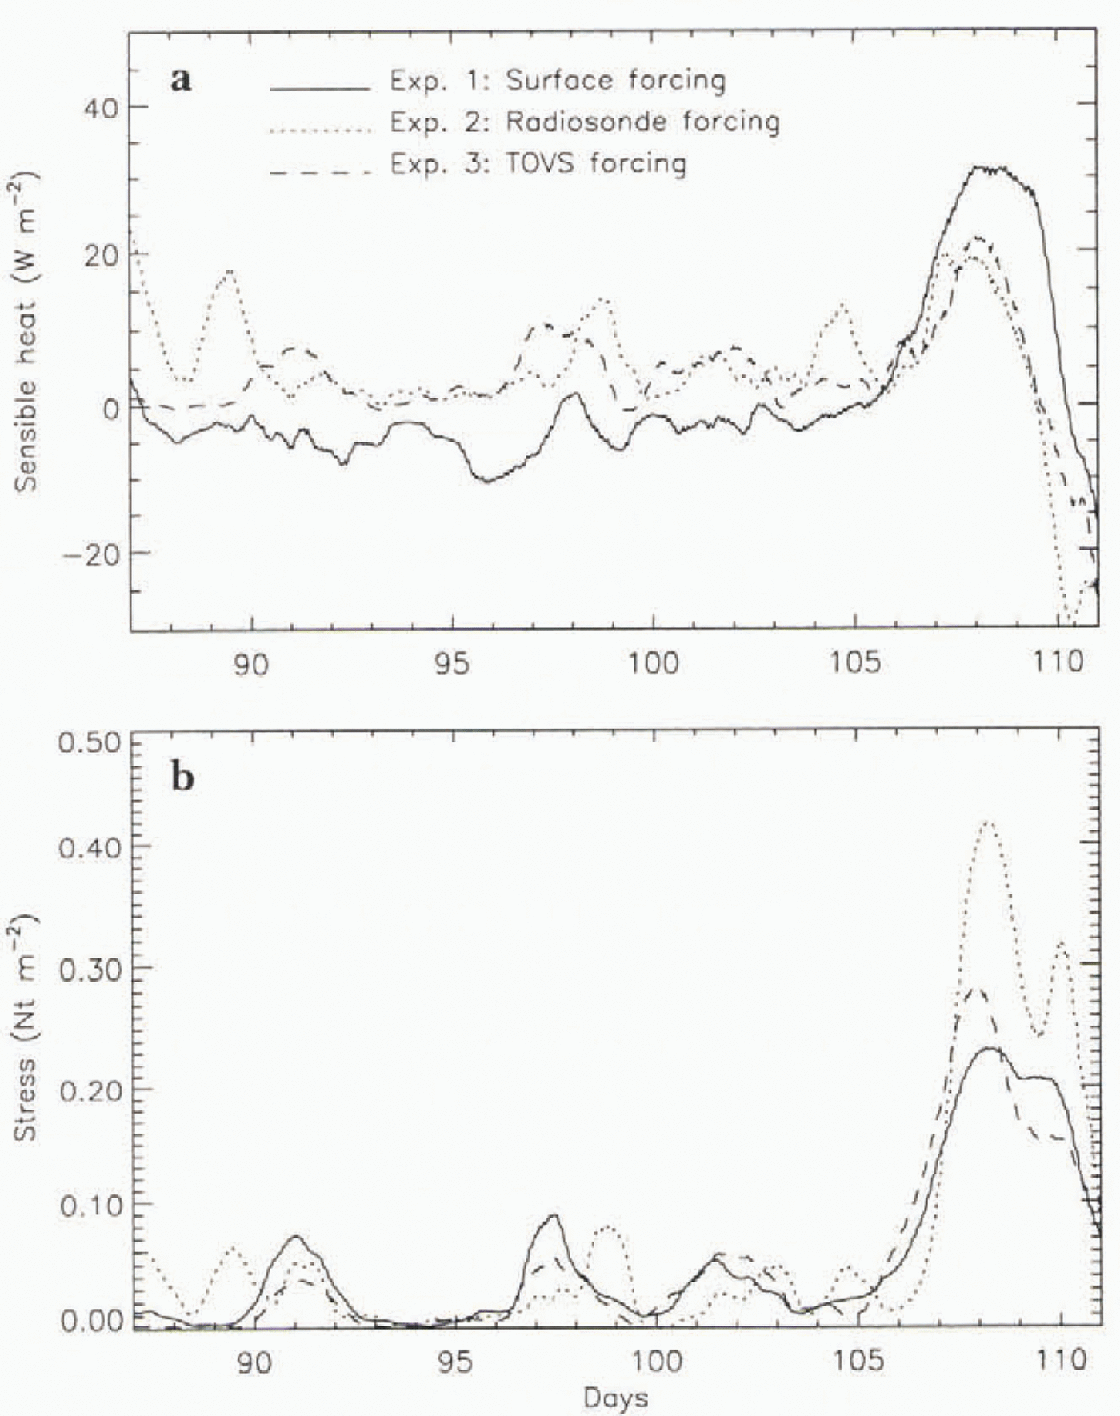
Fig. 5. Comparisons of the three numerical experiments: (a) sensible heatflux, (b) stress. The time series are 24 hour running means of the model outputs.
Discussion and Conclusions
One of our principal motivations for this study was to lest a scheme in which estimates of the surface stress can account for variations in the boundary-layer stratification. How satisfactory are traditional approaches in which stratification is not accounted for? The stress in large-scale sea-ice models is often calculated with just the geostrophic wind speed G and a fixed geostrophic drag coefficient Cg as:
In our numerical experiments we used a measured value of the local 10m drag coefficient and so, to provide a useful comparison, selected a value of Cg that gives zero bias in the stress calculated from Equation (5) when compared to the results of experiment I. That value is Cg = 0.00051. The rms difference between the experiment 1 estimates and the estimate from Equation (5) is 0.033 Ntm, compared to 0.021 Ntm for the TOVS-based estimate (experiment 3) which also showed negligible bias. Thus the error in the TOVS-based estimate is 30% less than that found with a constant geostrophic drag coefficient. This improvement is due to the inclusion of stability effects in the boundary-layer model that influence the geostrophic drag coefficient and are determined by the surface energy balance.
In these numerical experiments, the satellite-based estimates of the stress arc significantly better than estimates using a couslant-drag coefficient. Because of this, we feel that a column model with TOVS-based forcing show s promise for more accurately determining the surface stress. The heat-flux estimates, on the other hand, show errors of several Wm−2 . Only the high-wind event near the end of the period is detected, and even that is with poor accuracy. the heat flux estimates from TOVS-based forcing (Table 3) is every bit as accurate as those from radiosondes.
Experiment 1 highlights some of the difficulties in using an energy-balance model to determine the sensible heat flux. First, the net radiation must be determined, which depends both on accurate downwelling fluxes and on accurate estimates of the albedo, and second the conductive flux must be determined, which depends on an accurate estimate of the snow depth and snow density. Finally, the fluxes during LeadEx are small, often averaging over the course of one day to <10 Wm−2 in absolute value, so measuring a significant portion of their variance is difficult. Space-based estimates in the near future will probably be able to detect only the strong events such as that seen in the last six days. Although this event is detected in the TOVS-based estimates (Figure 5), significant bias remains.
The results are also sensitive to the turbulent-transfer coefficients specified. We found that if the drag coefficient and the heat-transfer coefficient were tuned independently to provide the minimum error in experiment 1. the rms differences between the results of experiments 2 and 3 and the measurements could be made to fall below 5W m−2 and the bias in the stress compared to the measurements made to disappear. An accurate characterization of the surface roughness will be needed to determine adequately the stress.
These experiments have shown that it is feasible to estimate surface turbulent fluxes using data collected from satellites. However, much work remains Io be done before our procedure can be coupled to a two-dimensional ice ocean model and fluxes can be computed on a routine basis for the entire Arctic. First, additional work needs to be conducted to select and tune the appropriate numerical model. Is the NCAR CCM2 the right one? Other models may prove more useful. Second, the results of the model are sensitive to a number of different parameters including albedo, snow depth, ice thickness and turbulent-exchange coefficients. Determining the correct values to use in the absence of in-situ data could be a formidable task. Finally, additional validation experiments should be performed for different seasons of the year and different ice conditions.
Possible enhancements to the model might include the addition of a radiative flux-diverge nee estimate and lead heat-flux estimates. Both would contribute to the heating rates within the boundary layer. The inclusion of clouds within the boundary layer would improve the flux divergence calculations. The sensible heat flux determined hen-is appropriate for thick ice. The method could be extended to other ice classes and to estimates of regional heal flux by estimating the near surface air temperature and wind speed for the dominant ice class in a region using the TOVS-based forcing and the column model described here. The near-surface air temperature and wind speed could then be used to estimate the heat fluxes from other ice classes, including leads.
Acknowledgements
This work was supported by the Office of Naval Research under grants N00014-96-1-0070 and N000T4-91-J-1557 by NASA under grant NAGW 4169.


