


Introduction
The Antarctic Peninsula has shown considerable warming, with maximum surface air temperature increases of up to 2.58C in 50 years at Vernadsky (Faraday) station, corresponding to a trend of +0:0538 ± 0:02658Ca∼1. Further north, the warming is less pronounced, although still significant (at the 5% level), with warming trends of +0:0221 ±0:01688Ca∼1 at Bellingshausen station (19692011) and +0:0094 ± 0:01068C a1 for summer (1968-2011; significant at the 10% level) (Reference TurnerTurner and others, 2005; Reference MarshallMarshall, 2012). Ice masses on the northern Antarctic Peninsula, the South Shetland and sub-Antarctic islands are subject to a maritime climate. Glaciers in such climates are generally considered sensitive to climate change, due to high accumulation rates and temperatures close to the melting point (Reference Knap, Oerlemans and CadeeKnap and others, 1996; Reference OerlemansOerlemans, 2001; Reference Hock, De Woul and RadicHock and others, 2009; Reference Jonsell, Navarro, Banon, Lapazaran and OteroJonsell and others, 2012).
Significant changes have been observed in the ice masses on the Antarctic Peninsula, including widespread retreat (Reference Cook, Fox, Vaughan and FerrignoCook and others, 2005), increased surface melt (Reference VaughanVaughan, 2006), acceleration and potential dynamic thinning of the glacier tongues (Reference Pritchard and VaughanPritchard and Vaughan, 2007) and surface lowering (Reference Pritchard, Arthern, Vaughan and EdwardsPritchard and others, 2009). Estimates of ice mass loss and the associated contribution to sea-level rise are still ambiguous and strongly driven by eastern and western Antarctic Peninsula glacier speed-up after collapse of the Larsen A and B ice shelves (Reference Rott, Muller and Nagler Tand FloricioiuRott and others, 2011; Reference Shuman, Berthier and ScambosShuman and others, 2011). Reference Pritchard and VaughanPritchard and Vaughan (2007) give a value of 0:16 ±0:06 mm sea-level equivalent (SLE)a∼1 (58 ± 22 Gta∼1), combining surface melt estimates by Reference VaughanVaughan (2006) and dynamic mass losses for the entire Antarctic Peninsula. Reference Chen, Wilson, Blankenship and TapleyChen and others (2009) and Reference Ivins, Watkins, Yuan, Dietrich, Casassa and RulkeIvins and others (2011) found mass losses of ∼40Gta∼1 (∼0.111 mm SLEa∼1) for the period 2003-09, based on the Gravity Recovery and Climate Experiment (GRACE) for the same region.
For the western Antarctic Peninsula, Reference RignotRignot and others (2008) found mass losses of 7 ± 4 Gta∼1 (0:019 ± 0:011 mm SLEa∼1) in 1996, 10 ±5 Gta∼1 (0:028 ± 0:014 mm SLEa-1) in 2000 and 13±7Gta∼1 (0:036 ± 0:019mm SLEa-1) in 2006. Reference Hock, De Woul and RadicHock and others (2009) estimated 0:22 ±0:16 mm SLEa∼1 (79±58Gta∼1) as the melt contribution from all mountain glaciers and ice caps around Antarctica (most of which are located around the Antarctic Peninsula) for the period 1961-2004, based on temperature trends and modelled mass-balance sensitivities. These estimates are considered lower bounds, since mass losses by calving or marine melting were neglected. However, some recent studies suggest that the regional trend of ice mass losses has slowed during the last decade (e.g. Reference Davies, Carrivick, Glasser, Hambrey and SmellieDavies and others, 2011; Reference Navarro, Jonsell, Corcuera and Martın-EspanolNavarro and others, 2013). The range of reported rates of mass loss for various domains of the Antarctic Peninsula and surrounding islands highlights the need for further detailed studies using the capabilities of the new generation of sensors with more detailed spatial resolution.
In this paper we analyse multitemporal data from the Advanced Land Observing Satellite (ALOS) with its Phased Array-type L-band synthetic aperture radar (PALSAR). We derive surface velocity fields by intensity feature tracking and combine those results with ice thickness estimates to quantify the ice mass flux into the ocean of the ice cap on King George Island.
Study Area and Previous Work
King George Island is the largest island in the South Shetland Island group, located ∼100km off the tip of the Antarctic Peninsula (Fig. 1). King George Island has a total area of ∼1250km2 of which >90% is currently ice-covered (1127 km2). The ice cap is ∼70km long and 25 km wide, with elevations up to ∼700 m a.s.l. Most of the perimeter of the ice cap is ocean-terminating. While the western part of the ice cap has several domes and drains with smooth slopes into the sea, the southern coast is formed by steep fjord-like inlets and outlet glaciers. Various studies have been performed to determine surface melt, surface mass balance and general characteristics of ice masses on the island, indicating significant glacier retreat and surface lowering in the recent past (Reference BintanjaBintanja, 1995; Reference Braun, Saurer, Vogt, Simões and GossmannBraun and others, 2001a; Reference Braun and HockBraun and Hock, 2004; Reference Ruckamp, Braun, Suckro and BlindowRuckamp and others, 2011). However, there is very little information available about dynamic mass losses. Previous attempts to derive surface flow from synthetic aperture radar interferometry (InSAR) (Reference Moll and BraunMoll and Braun, 2006) faced rapidly changing surface conditions, limited on-board storage and down-link capabilities for data, and unfavourable acquisition conditions (e.g. main flow perpendicular to radar line of sight). In situ measurements of surface velocities only cover the interior of the ice cap (Reference Ruckamp, Blindow, Suckro, Braun and HumbertRuckamp and others, 2010). The region is not covered by the recently released pan-Antarctic velocity mosaic of Reference Rignot, Mouginot and ScheuchlRignot and others (2011).
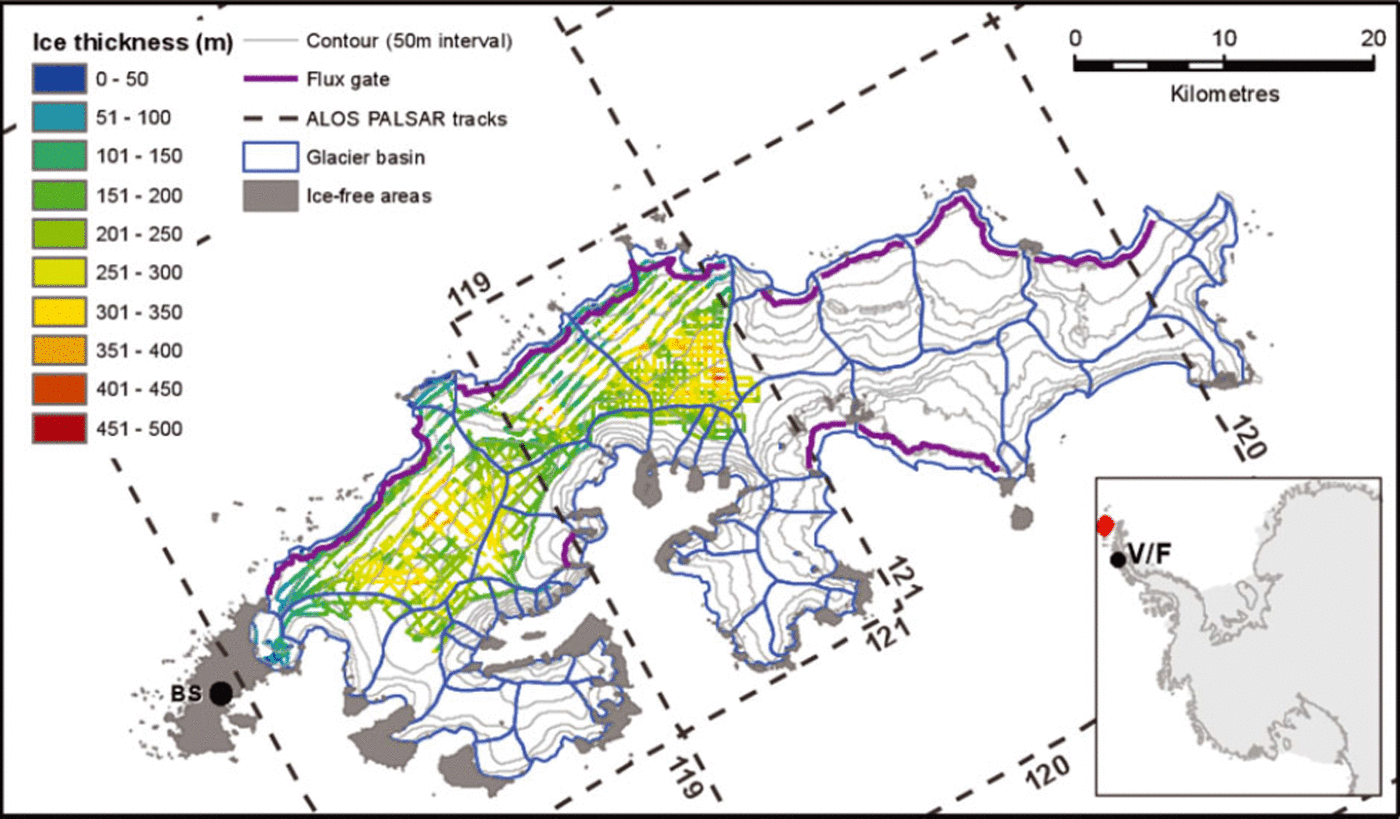
Fig. 1. Location, topography and ice thickness observations of the study area. Blue curves delineate individual glacier drainage basins, purple curves indicate the flux gates used in this study and the dashed lines show the boundaries of the ALOS PALSAR tracks. BS: Bellingshausen station. The red dot in the inset marks the location of King George Island, and V/F that of Vernadsky (Faraday) station.
Data
We calculate ice discharge using glacier surface velocities, modelled ice thicknesses and a digital elevation model (DEM). The surface velocities are calculated using synthetic aperture radar (SAR) imagery. All datasets are described below.
Ice thickness
Ice thickness data for the northwestern and central part of the ice cap are available from several field campaigns (Reference BlindowBlindow and others, 2010; Reference Ruckamp and BlindowRuckamp and Blindow, 2012; Fig. 1). During the austral summers of 1997/98 and 2006/07, ground-based radio-echo sounding surveys were carried out with a ground-penetrating radar (GPR) system operating at centre frequencies of 25 and 50 MHz. The total length of profiles was ∼-1200km, with an area coverage of ∼200km2 (Reference BlindowBlindow and others, 2010). However, the heavily crevassed coastal areas were not covered. An airborne radio-echo sounding survey performed with the BGR-P30 GPR system during the austral summer of 2008/09 completed the coverage over the northwestern coastal area. The BGR-P30 GPR system, operating at a centre frequency of 30 MHz, was deployed to collect a total length of 250 km of airborne profiles, with an estimated coverage of 140 km2 (Reference Ruckamp and BlindowRuckamp and Blindow, 2012). The GPR data from both ground-based and airborne surveys were combined and converted to ice thickness using a radio-wave velocity in ice of 0.168 m ns∼1, with an altitude-dependent correction forfirn using a velocity in firn of 0.194mns∼1. The relative error in ice thickness estimates given by Ruckamp and Blindow is about ±2.3%. Mean ice thickness in the surveyed area is 240 ± 6 m, with a maximum value of 422 ± 10 m. Areas with the glacier bed below sea level were found in several zones of the northwestern coast (Reference Ruckamp and BlindowRuckamp and Blindow, 2012).
Digital elevation model
A DEM with 50 m grid spacing was generated by combining multiple datasets, following the approach of Reference BraunBraun and others (2001b). Wherever possible, the differential GPS (DGPS) measurements taken simultaneously with the ice thickness measurements were interpolated. Areas not covered by the GPS data were covered either by the Advanced Spaceborne Thermal Emission and Reflection Radiometer (ASTER) Global DEM (GDEM) version 1.0 (e.g. eastern part of the island) or maps with the best available resolution. Hence the quality of the DEM used for ortho-rectification is of variable quality. Furthermore, fast decorrelation of the glacier surface prevented use of InSAR for DEM generation.
ALOS PALSAR Imagery
PALSAR was an L-band (1270 MHz) SAR imaging system on board the Japanese ALOS satellite. ALOS was operational between January 2006 and April 2011, during which time it collected imagery from repeating tracks with a complete cycle period of 46 days. The data used in our analysis came from a total of three tracks covering the whole of King George Island. All images were collected in fine beam single polarization mode, which provides a ground resolution of about 9 m x 5 m. The images have a swath width of ∼ 7 0 km in the range direction.
The central part of King George Island is covered by all three tracks, providing the highest temporal sampling rate for this area. A total of 19 pairs from track 119, 8 pairs from track 120 and 13 pairs from track 121 (Fig. 1) were processed for the analysis. The time- span of the acquisitions is 27 January 2008 to 5 March 2011. Except for a period between February and October 2010, acquisitions are relatively evenly spaced in time. The time between the two image acquisitions forming the pair is referred to as the temporal baseline. The distribution of temporal baselines for all processed tracks is shown in Figure 2.
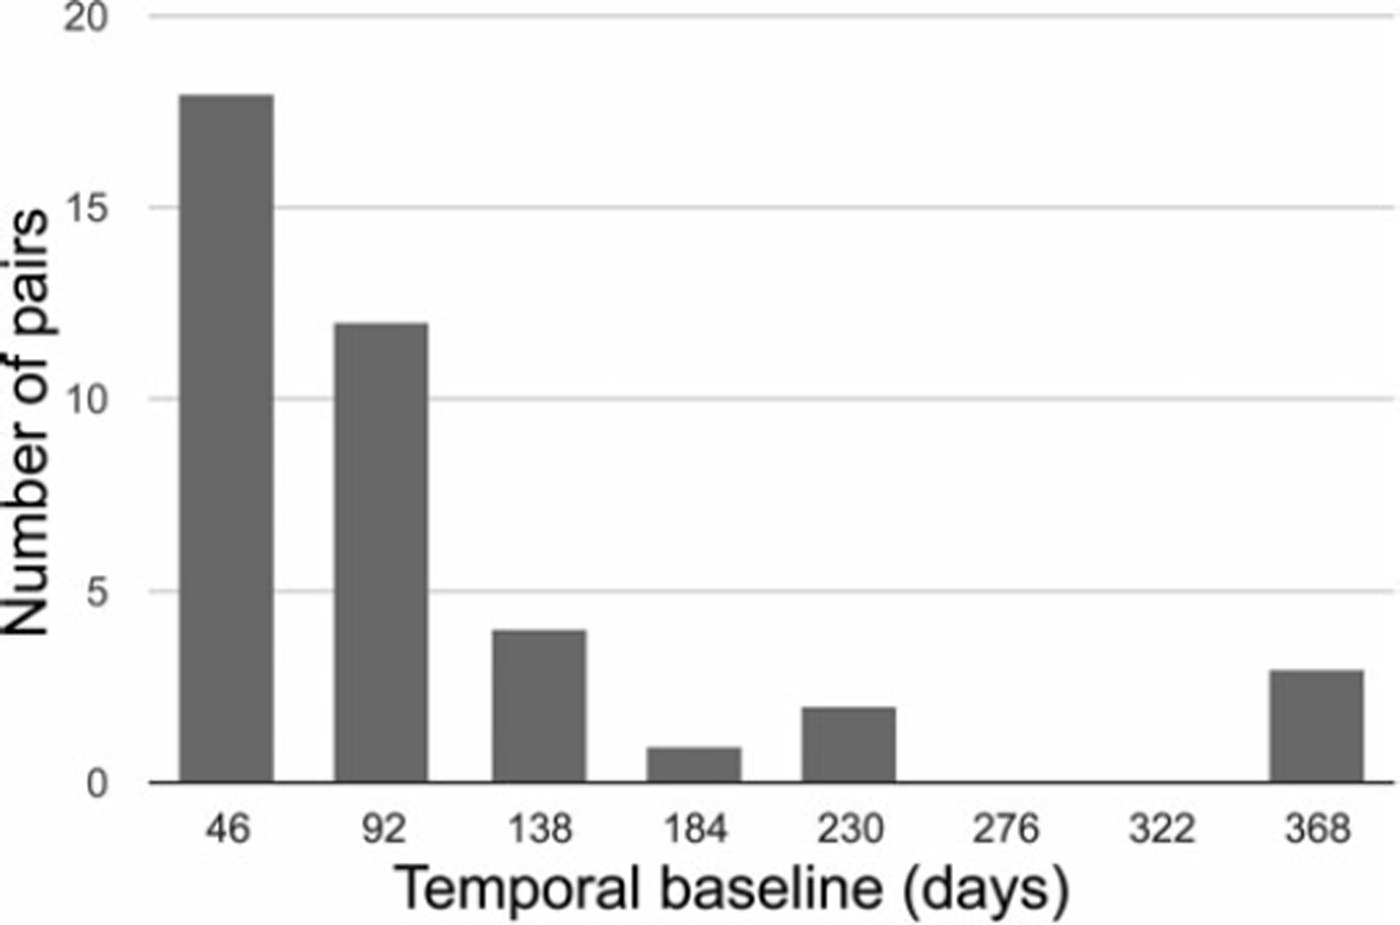
Fig. 2. Distribution of temporal baselines for the offset tracking pairs between January 2008 and January 2011.
Methods
Ice discharge
We compute ice discharge into the ocean using a flux-gate approach. We calculate the ice flux through predefined flux gates close to the ocean-terminating ice perimeter. The method yields a measure of frontal ablation (the sum of calving and submarine melting) but does not allow us to distinguish between these two components of mass change at the terminus. We neglect any mass changes due to terminus retreat. Calculation of ice flux across a flux gate requires information on horizontal, depth-averaged ice velocity and ice thickness. The former can be approximated from surface velocity observations (Reference Rignot, Forster and IsacksRignot and others, 1996; Reference Cuffey and PatersonCuffey and Paterson, 2010). Then, for a given ice thickness, H, horizontal ice flux, q, is calculated as (Reference CogleyCogley and others, 2011)
where 7 is the conversion factor between surface, usfc, and depth-averaged velocity. We assume 7 = 0.9 (Reference Cuffey and PatersonCuffey and Paterson, 2010). The ice discharge, D, is then defined as the integral of ice flux perpendicular to the flux gate over the length, X, of the gate:
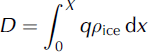
where pice is the density of ice. The unit of ice discharge is mass over time (Gta∼1).
Surface velocity
Glacier surface velocities are determined using an offset tracking algorithm (Reference Gray and SteinGray and others, 1998; Reference Strozzi, Luckman, Murray, Wegmuller and WernerStrozzi and others, 2002, Reference Strozzi, Kouraev, Wiesmann, Wegmuller, Sharov and Werner2008; Reference Werner, Wegmuller, Strozzi and WiesmannWerner and others, 2005) applied to the SAR intensity images. Pixel offsets in range (cross-track) and azimuth (flight direction) are obtained simultaneously by calculating the offsets for a large number of points (∼300 000) evenly distributed over the entire image. Offsets are calculated by finding the translation of a small (slave) window from the second image over a larger (master) window in the first image, which provides the highest cross-correlation in intensity. The offset tracking method used in this analysis is generally referred to as ‘intensity tracking’, which provides better results than ‘coherence tracking’ for this study area, due to a large extent of incoherent areas in the imagery (Reference Strozzi, Luckman, Murray, Wegmuller and WernerStrozzi and others, 2002).
The size of the search window is an important parameter in estimating the pixel offsets. The slave window has to be large enough to contain a statistically significant intensity feature for matching, and sufficiently small to not blur the result. In this study, the slave window size is set to ∼1.2 km in both directions. The master window size is increased adaptively to accommodate a maximum velocity of 800 ma∼1 (about twice the expected maximum velocity). In order to minimize noise due to surface change and deformation, all processed pairs have the shortest possible temporal baselines (Fig. 2).
An average surface velocity is then calculated using weighted least-squares inversion. The weights are set such that the pairs with shorter temporal baselines have a larger weight:
where wk is the weighting factor for the kth pair, 46 is the repeat cycle in days (minimum temporal baseline) for ALOS and Btk is the temporal baseline of the pair. We apply a weighting factor because we found that the pairs with longer-term baselines underestimated the glacier motion. This might be due to deformation of intensity features with longer temporal baselines or permanent geological structures generating repeated patterns over times at more or less the same location (e.g. crevasses over a bedrock bump). Figure 3 shows the absolute difference of each pair’s velocity estimate from a reference average daily velocity with and without a weighting factor, wk, as a function of the pair’s temporal baseline. The reference average daily velocity is calculated using two randomly selected pairs for each temporal baseline (except 184 days, where only one pair is available). Having the same number of pairs for each temporal baseline prevents a possible bias in the average velocities due to a larger number of available short-baseline pairs. Figure 3 illustrates that the absolute difference increases with temporal baseline if no weighting is applied, and the correlation between temporal baseline and difference is removed when the weighting factor is applied.
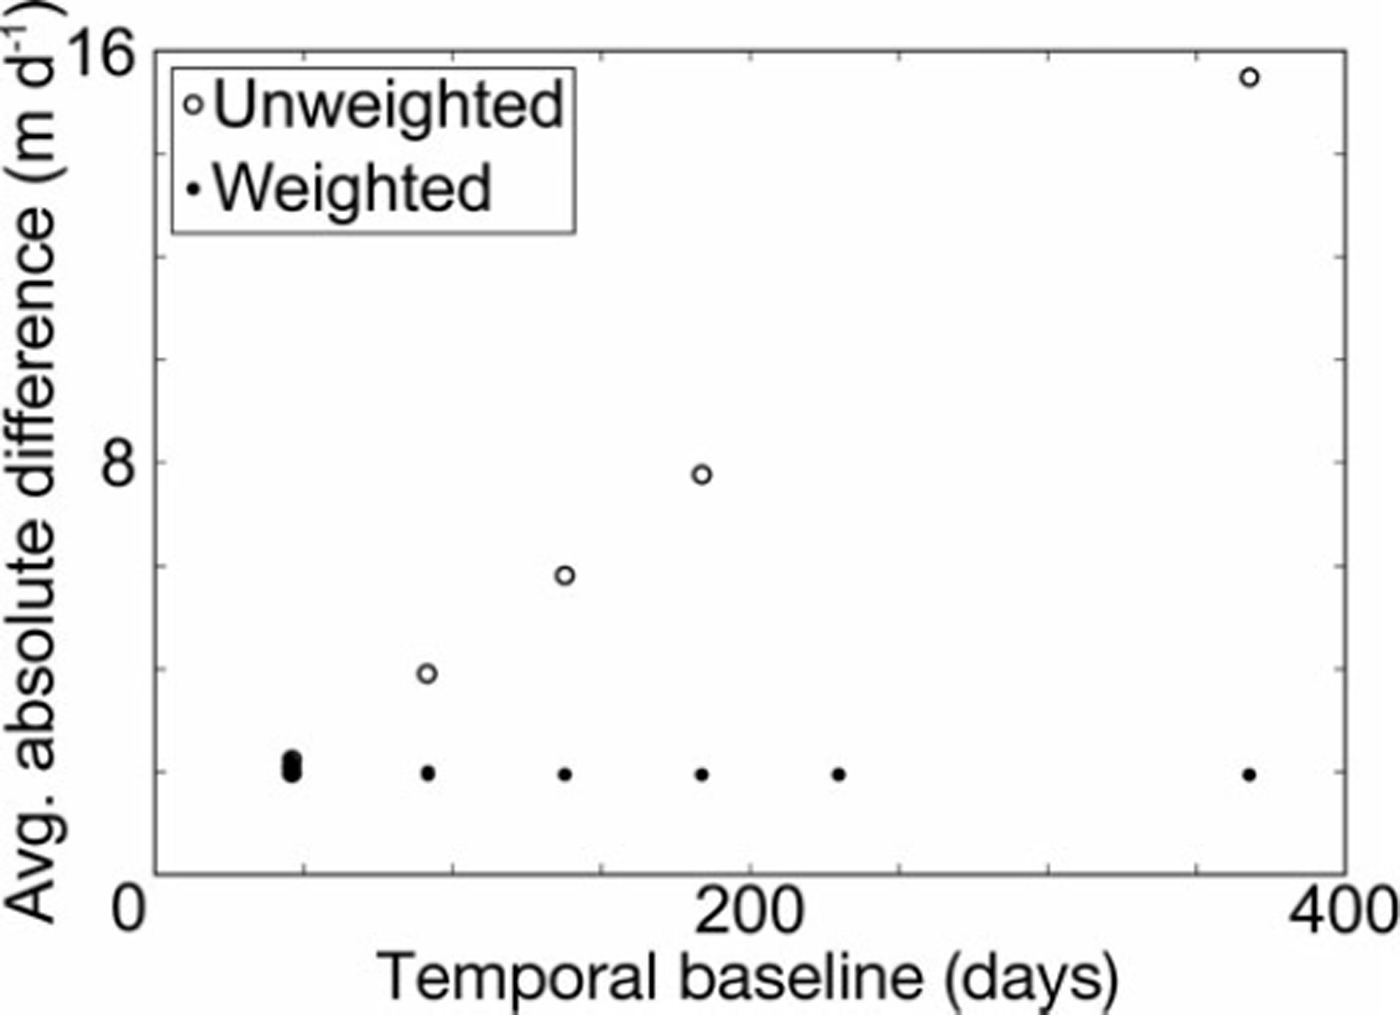
Fig. 3. Spatially averaged absolute difference between average daily velocities and a reference velocity vs temporal baseline with and without a weighting factor (Eqn (3)).
Another important point to note is that not all points (pixels) contain a surface velocity for all pairs, because data from different tracks are being inverted at the same time. Therefore, for each pixel, the appropriate weights are calculated based on the available observations. The weighted linear inversion, with the assumption of uncorrelated errors, is the solution of the linear system:
where W denotes the vector of weighting factors, wk, for available observations, M is the design matrix, u is the weighted average surface velocity, b is the observed displacement and the subscript A, cj> denotes the location (latitude, longitude) of the pixel being solved. The design matrix, M, is simply a vector of the temporal baselines for each pair, and therefore the average velocities are obtained in units of m d∼1. Furthermore, the measurements with large temporal variations or low signal-to-noise ratio (<4dB) are masked out, using the weighted misfit function:
where x is the misfit, ![]() is the estimated ice thickness and H is the measured ice thickness. In order not to remove too many observations due to natural seasonal variation of the surface velocity, the misfit threshold is set to 1 m d∼1 .
is the estimated ice thickness and H is the measured ice thickness. In order not to remove too many observations due to natural seasonal variation of the surface velocity, the misfit threshold is set to 1 m d∼1 .
Ice thickness
Since ice thickness data are not available for a large fraction of the ocean-terminating perimeter, we derive ice thickness from calculated surface velocity fields, following Reference Rignot, Forster and IsacksRignot and others (1996), by solving for ice thickness in:
where usfc is the surface velocity obtained from intensity feature tracking, f is an adjustable parameter between 0 and 1 setting the amount of sliding (f = 0, no sliding; f = 1, free sliding), n is Glen’s flow law parameter, Td is the gravitational driving stress, B is the column-averaged flow constant, E is the flow law enhancement factor, ![]() is the estimated ice thickness, R is a constant including the effects of bed roughness and m is Weertman’s flow law parameter. In Eqn (7)
g is gravity, pice is density and a is the surface slope. The deformation component of Eqn (6) assumes deformation by simple shear, i.e. it does not include the effect of longitudinal stress gradients. In contrast to Reference Rignot, Forster and IsacksRignot and others (1996), we treat E as an adjustable parameter rather than a constant. Typical values for E are in the range 0.5-10; however, values outside this range have also been reported (Reference Greve and BlatterGreve and Blatter, 2009). For this analysis we calculate B based on ice temperature defined by the Arrhenius relationship (-3°C, B = 231 866kPaa1//3), while we set R to 4kPam1 / 2 a1/2 (Reference Rignot, Forster and IsacksRignot and others, 1996; Reference Greve and BlatterGreve and Blatter, 2009; Reference Cuffey and PatersonCuffey and Paterson, 2010). The m and n parameters are set to 2 and 3, respectively, while a truncated-Newton iterative optimization routine is used to find f and E using the available thickness data (Fig. 1). For King George Island the best-fitting values for f and E are 0 and 1.39, respectively. These parameters result in a root-mean-square (rms) misfit of 73 m between the estimated and observed thickness data. The large rms misfit indicates a poor fit between the data and model approximations. A cutoff value of 600 m ice thickness was used to mask out unrealistic ice thicknesses. These unrealistically high ice thicknesses occur only in the eastern part of the island, where topographic information is also less reliable.
is the estimated ice thickness, R is a constant including the effects of bed roughness and m is Weertman’s flow law parameter. In Eqn (7)
g is gravity, pice is density and a is the surface slope. The deformation component of Eqn (6) assumes deformation by simple shear, i.e. it does not include the effect of longitudinal stress gradients. In contrast to Reference Rignot, Forster and IsacksRignot and others (1996), we treat E as an adjustable parameter rather than a constant. Typical values for E are in the range 0.5-10; however, values outside this range have also been reported (Reference Greve and BlatterGreve and Blatter, 2009). For this analysis we calculate B based on ice temperature defined by the Arrhenius relationship (-3°C, B = 231 866kPaa1//3), while we set R to 4kPam1 / 2 a1/2 (Reference Rignot, Forster and IsacksRignot and others, 1996; Reference Greve and BlatterGreve and Blatter, 2009; Reference Cuffey and PatersonCuffey and Paterson, 2010). The m and n parameters are set to 2 and 3, respectively, while a truncated-Newton iterative optimization routine is used to find f and E using the available thickness data (Fig. 1). For King George Island the best-fitting values for f and E are 0 and 1.39, respectively. These parameters result in a root-mean-square (rms) misfit of 73 m between the estimated and observed thickness data. The large rms misfit indicates a poor fit between the data and model approximations. A cutoff value of 600 m ice thickness was used to mask out unrealistic ice thicknesses. These unrealistically high ice thicknesses occur only in the eastern part of the island, where topographic information is also less reliable.
Flux gates
A flux gate is a theoretical line over which the ice discharge is calculated for a particular outlet glacier. In this study, all flux gates are generated parallel to the coastline some distance inland, and generally they are roughly perpendicular to the approximate horizontal ice flow direction (Fig. 1). The satellite-derived velocities seaward of the calving fronts sometimes appear to point up-glacier due to retreat of the calving front. These areas are easily detected by large misfit values. Therefore the flux gates used in this study are placed ∼500m up-glacier of the calving front, determined by the availability of the velocity observations and ice thickness data. Flux gates are only defined for those marine-terminating glaciers where ice velocities at the flux gates exceed 25 m a∼1. For the remaining tidewater and all land-terminating glaciers (46% of the glacierized area), ice discharge into the ocean is assumed negligible.
Error analysis
Errors in calculated ice discharge will arise from errors in glacier surface velocity, usfc, estimated ice thickness, H, surface-to-depth averaged velocity coefficient, 7, average ice density, pice (Eqns (1) and (2)) and the selection of flux gates. We assume that the errors for 7, pice and flux gate location are small compared to the combined errors in ice thickness and surface velocity. Because the ice thicknesses are retrieved from surface velocities, any misfit between observed and estimated H will also contain surface velocity errors. Therefore we estimate the error in ice discharge exclusively from the misfit between observed and estimated H. Each available observation is compared with the closest value computed from Eqn (6). We define two lines around the 1 :1 line between observed and estimated H originating at zero and chosen to depart from the 1 :1 line in opposite directions with the minimum angle /3 needed to include 95% of the scatter (Fig. 4). This approach was preferred over applying a fixed 2a error based on the standard deviation of ice thickness error, because this approach would result in overestimating the error for slow and shallow ice, while underestimating it for fast and thick ice. Another approach would be to use the variance of surface velocity to estimate a new ice thickness value. However, the nonlinear relationship between the surface velocity and ice thickness causes problems, because the f and E parameters in Eqn (6) are calibrated for the observed surface velocities. Using model parameters calibrated for the weighted average surface velocities, usfc, with uncalibrated surface velocities of usfc + 2au, results in very high (or very low for usfc — 2ou) ice discharge. Furthermore, velocities less than 5 m a∼1 are observed over ice-free areas, providing an error estimate for the velocity measurements. It must be noted that for some areas with less defined features, the errors can be higher (up to 20 ma- 1). A sensitivity analysis was done to test the effect of errors in velocity. For the range of velocities and slopes found on King George Island the largest recorded error was <0.1 Mta∼1. Therefore errors in surface velocities affect computed ice discharge much less than the other uncertainties; they are therefore not included in the error estimate directly, but only indirectly through the errors in ice thickness.

Results
Ice velocities
Time-averaged surface velocities are shown in Figure 5a, revealing a number of fast-flowing outlet glaciers, in particular on the northern part of the island, with velocities up to∼225 m a∼1. Velocities from intensity offset tracking are mainly limited to the edges of the ice cap and major outlet glaciers, where surface structures, such as crevasses, enable a sufficiently strong signal for tracking. Surface velocities could not be estimated over smoother areas up-glacier. Although no overlap between the in situ (Fig. 1) and remote-sensing velocities exists, satellite-based estimates form a consistent spatial pattern with the nearby in situ observations. The highest surface velocities are obtained at Eldred, Drake and Anna glaciers, but other outlet glaciers such as Poetry, Crystal and Usher glaciers also show high velocities. Reference Ruckamp, Blindow, Suckro, Braun and HumbertRuckamp and others (2010) report measured in situ values of 0-80 ma∼1 for Arctowski Icefield and the upper catchments of Usher Glacier West and East. Highest measured in situ surface velocities are reported for the upper catchment of Lange Glacier, with 114ma∼1 over a 4week period in 1997/98 (Reference Braun, Saurer, Vogt, Simões and GossmannBraun and others, 2001a). Typically for tidewater glaciers, the surface velocities tend to increase down-glacier, as expected from an extensional stress regime which also produces transverse crevasses (Reference NyeNye, 1952; Reference Cuffey and PatersonCuffey and Paterson, 2010). Considerably lower velocities are found for all land-terminating glaciers and the remaining smaller tidewater glaciers that were not analysed.

Fig. 5. (a) Average ice velocities from intensity feature tracking between January 2008 and January 2011. Observed ice velocity vectors (Reference Ruckamp, Blindow, Suckro, Braun and HumbertRuckamp and others, 2010) are shown as wedges in the same colour scale. Names are given for the tidewater glaciers for which ice discharge is calculated. (b) Calculated ice thicknesses (Eqn (6)). Noisy areas are masked out and appear white in both panels. BS: Bellingshausen station, BD: Bellingshausen Dome.
Ice thickness and discharge
Computed ice thicknesses (Fig. 5b) vary between 0 and 350 m in most areas of the western part of the ice cap, while larger thicknesses are computed in the eastern part, >500 m in some areas (e.g. Crystal Glacier, Unnamed Glacier). A well-defined trough is visible at Poetry Glacier.
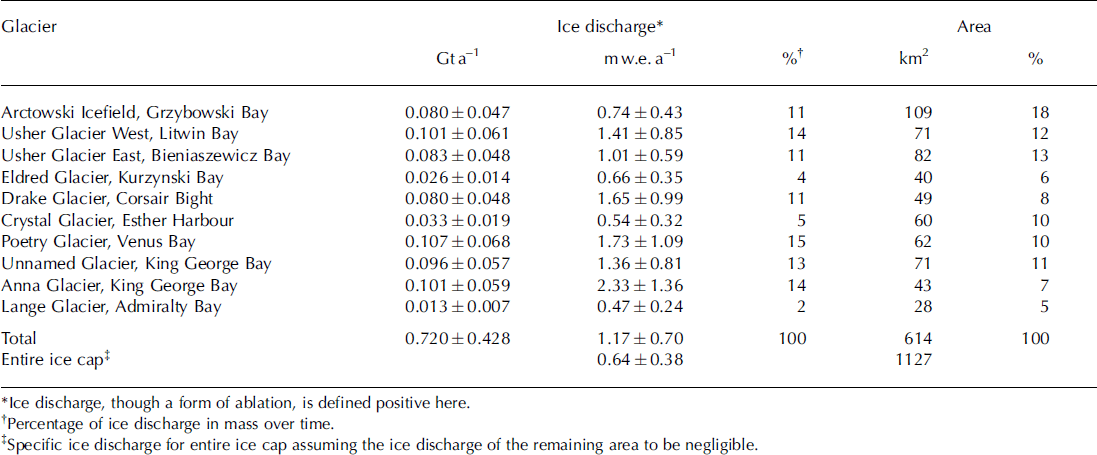
The estimated ice discharge for each of the calculated glaciers is shown in Figure 6, with further details given in Table 1. Glaciers on the northwestern coast (Usher Glacier West and East, Arctowski Icefield) drain almost comparable amounts of ice, while values for the catchments on the northeastern side show a more variable pattern, depending on their size. Highest ice discharge rates (Gta∼1) are computed for Poetry Glacier followed by Usher West and Anna Glacier. The defined outlet of Eldred Glacier, draining to the north, shows about double the ice discharge of Lange Glacier, draining south with about half the size. The estimated total ice discharge of the mapped catchments is 0:720 ± 0:428 Gta∼1. Ice discharge in specific units (i.e. mass loss per area) ranges between 0:47 ± 0:24 m w.e. a∼1 for Lange Glacier and 2:33 ± 1:36 m w.e. a∼1 for Anna Glacier.
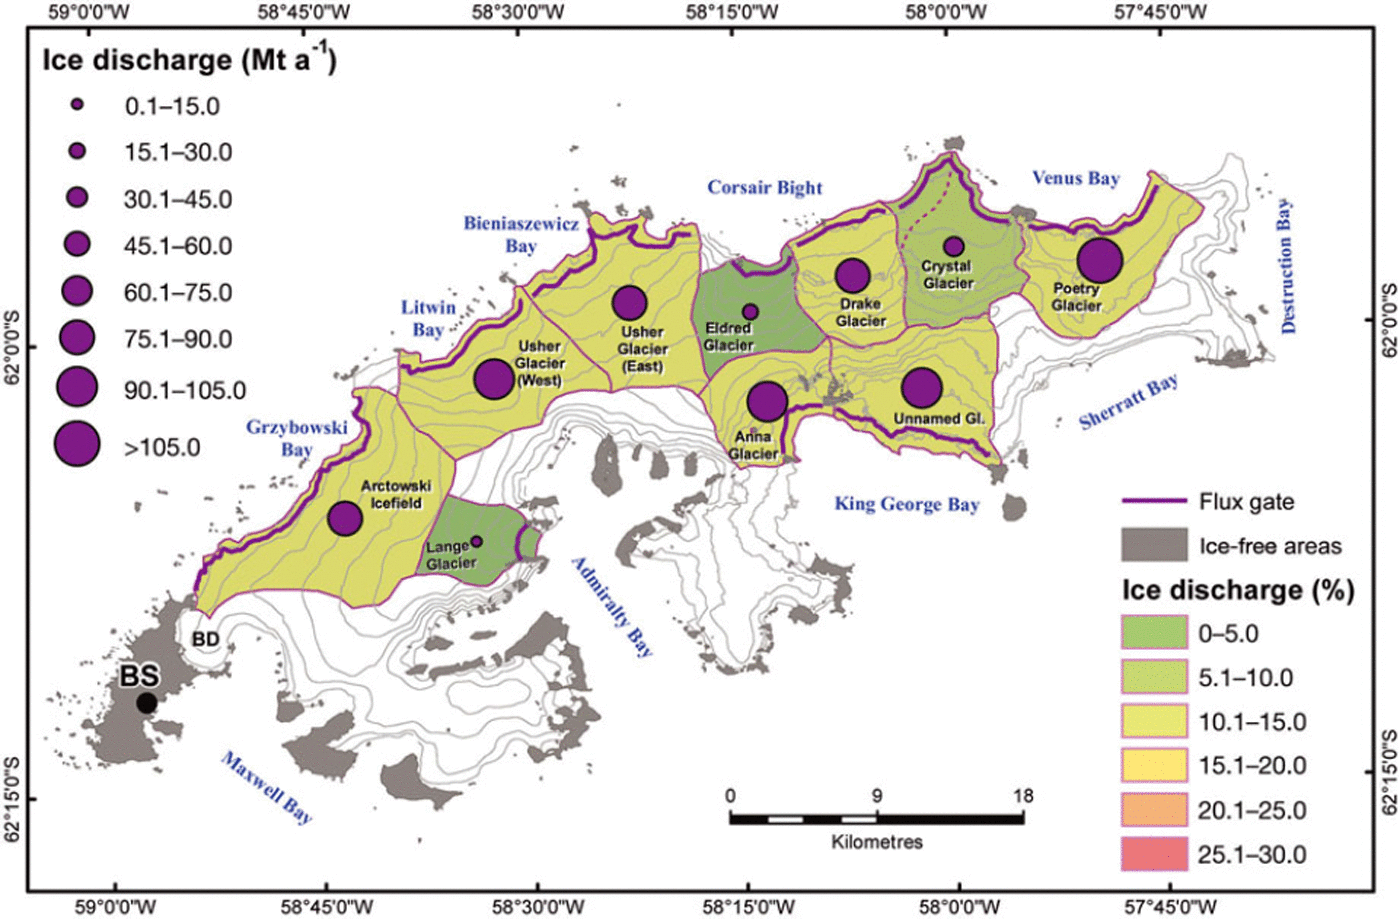
Fig. 6. Ice discharge for individual glacier basins of King George Island ice cap. Colours indicate the percentage of total ice discharge. Basins coloured white were assumed to have negligible ice discharge into the ocean. BS: Bellingshausen station, BD: Bellingshausen Dome.
Table 1. Ice discharge for tidewater glaciers on King George Island. Specific ice discharge (mw.e.a 1) is derived by dividing the ice discharge (Gta∼1) by the total area of each glacier
Discussion
Ice-discharge estimates for King George Island must be considered a first-order approximation, due to large uncertainties in ice thicknesses. Figure 4 shows large discrepancies between the calculated and observed thicknesses, and the rms misfit is 73 m. We attribute this error to (1) limitations inherent in the physics underlying the model (Eqn (6)), (2) uncertainties in the values of the model parameters and (3) errors in the input data to the model.
The model given by Eqn (6) only includes deformation by simple shear and does not include longitudinal stress gradients. The latter are important in areas close to the calving fronts, where the sliding velocity and its along-flow gradient are both large. As a result, it is expected that the ice-thickness estimates from the surface velocity data could be poor in these areas, which unfortunately are those where the discharge fluxes are computed. Furthermore, the best fit between observed and computed ice thickness is obtained for the model parameter values f = 0 and E = 1:39, where the zero value for f represents no sliding. This may be valid for certain zones of the ice cap (e.g. the land-terminating zones with glacier thickness tapering to zero), but cannot be true near the calving fronts, where the velocity is dominated by sliding.
Despite the unphysical value for f, the model is able to reproduce the ice thicknesses with reasonable accuracy, probably because the enhancement parameter, E, partly compensates the under-represented sliding component of the model. In other words, the model (Eqn (6)) reproduces the observed surface velocity reasonably well, but is unable to determine the ratio of deformation and sliding. Naturally, this has a negative implication for the inferred ice thickness, which is manifested in the rather large rms misfit. During the analysis we observed lower rms misfit values for low f and high R values. Therefore it is possible to obtain an equivalent fit with f = 0:05 and E = 1:46 for R values exceeding 32 kPa m1=2 a1=2. In spite of the model limitations and large uncertainties involved, our results provide a first-order approximation to the ice discharge in an area that is under-represented in the literature.
For most parts of the western ice cap, ice thicknesses are consistent with the available in situ observations with a maximum of ∼450 m (Fig. 1). The well-defined trough at Poetry Glacier is confirmed by large ice thicknesses (∼400 m) in the BEDMAP data (Reference Lythe and VaughanLythe and others, 2001). Field observations and optical satellite data also indicate the presence of this outflow. Decreasing ice thicknesses of Poetry Glacier towards the ice divide are consistent with the presence of a geological horst structure in this area (Reference TokarskiTokarski, 1987). For other glaciers in the eastern part of the island, there are no ground measurements to validate the estimates. Some of the high ice thicknesses on Crystal Glacier are found in an area where surface structures and diverging ice flow directions would suggest the presence of a subsurface ridge rather than a trough, and the derived ice thicknesses are probably overestimates. Another area of very high ice thickness is shown for Unnamed Glacier. This might be a model misfit due to the quite flat terrain here and the general lower quality of the DEM in the eastern part of the island. Ice discharge (Gta∼1) varies considerably between outlet glaciers. This can be only partially attributed to different glacier sizes, as indicated by a large variation in specific ice discharge (Table 1). The largest ice discharge is found for Poetry Glacier, probably due to the deep bedrock trough and associated high velocities. Different rates of ice discharge may be related to variations in glacier retreat rates. Reference Ruckamp, Braun, Suckro and BlindowRuckamp and others (2011) investigate retreat rates of all glacier catchments between 2000 and 2006/08 from remote-sensing data and also show the ice front from 1956 maps. Anna Glacier shows the largest specific ice discharge, coincident with the largest retreat rates of all outlet glaciers between 2000 and 2008, indicating that significant frontal ablation may have been triggered by the partial loss of the tidewater tongue. However, there appears to be little correlation between ice discharge and retreat rates for other glaciers. The glaciers in the northeast were relatively stable between 2000 and 2008, though they vary greatly in ice discharge.
Only very limited data are available to compare the mass loss through ice discharge to surface mass-balance estimates. Annual point-mass-balance measurements were made in the accumulation area, at elevations above 400 ma.s.l., of Arctowski Icefield and Usher Glacier (Reference Ruckamp, Braun, Suckro and BlindowRuckamp and others, 2011) during two mass-balance years. Results indicate a strong altitude dependence, as well as large interannual variability. Annual point balances range from 3.7 to 5.0mw.e. a∼1 in 2007/08 and from 1.6 to 3.1 mw.e. a-1 in 2008/09 for the same domain. The balances are subject to high uncertainties, since snow density was based on previous studies (Reference SimõesSimões and others, 2004) and the accumulation stakes were buried and their depths were measured with GPR. The mass-balance year 2007/08 was an exceptionally high precipitation year (Reference Ruckamp, Braun, Suckro and BlindowRuckamp and others, 2011). However, higher net accumulation rates in the former compared to the latter mass-balance year are consistent with glacier-wide annual balances obtained on Hurd and Johnsons Glaciers on Livingston Island, ∼120 km west of King George Island (Reference Navarro, Jonsell, Corcuera and Martın-EspanolNavarro and others, 2013).
An ice core at the ice divide between Arctowski Icefield and Lange Glacier (690ma.s.l.) yielded an average net accumulation rate of 0.59 mw.e.a∼1 for the 73 year period 1922-95 (Reference SimõesSimões and others, 2004). Geodetic estimates of mass balance are only available for Bellingshausen Dome (Fig. 5b), a small ice dome not exceeding 250 m a.s.l., where results indicated strong altitude-dependent surface lowering for the period 1997/98 to 2008/09 (Reference Ruckamp, Braun, Suckro and BlindowRuckamp and others, 2011). Overall, the available measurements for King George Island are not sufficient to derive glacier-wide estimates of surface or total mass balance for our investigated glaciers or the entire ice cap.
Our rates of ice discharge are comparable to other glaciers on the Antarctic Peninsula. For the tributaries to the former Larsen B ice shelf, Reference Rott, Muller and Nagler Tand FloricioiuRott and others (2011) reported values of 0.144 Gta∼1 (0.0004 mm SLEa-1) before 1995/96 and 0.459 Gta∼1 (0.001 mm SLEa∼1) after the collapse of the Larsen B ice shelf (2008) for Evans Glacier (210 km2), while Reference Shuman, Berthier and ScambosShuman and others (2011) estimated a total mass loss of grounded ice in the period 2001-06 of ∼1.6Gta∼1 (0.004 mm SLEa-1). The 2008 mass flux rate given by Reference Rott, Muller and Nagler Tand FloricioiuRott and others (2011) for a drainage system like Evans Glacier is hence close to the entire mass flux of King George Island estimated in this study.
Per unit area, King George Island loses more mass through ice discharge (0.64 m w.e. a∼1; Table 1) than many ice caps in the Arctic for which estimates have been reported (AMAP, 2011). Estimates range from — 0:02 m w.e. a∼1 for Novaya Zemlya, Russia (Reference GovorukhaGovorukha, 1988), to —0:31 mw.e. a∼1 for Austfonna, Svalbard (Reference Dowdeswell, Benham and Strozzi Tand HagenDowdeswell and others, 2008), estimated for various periods between 1930 and 2006, and ice caps ranging from ∼6000 to 40000 km2. For Johnsons Glacier on Livingston Island, Reference Navarro, Jonsell, Corcuera and Martın-EspanolNavarro and others (2013) estimate —0:14mw.e.a-1 average loss through ice discharge for the last decade. A larger value is reported for Columbia Glacier, Alaska (—3:3 mw.e. a- 1 ; Reference O’Neel, Pfeffer, Krimmel and MeierO’Neel and others, 2005). The larger specific ice discharge compared with the Arctic ice caps may be attributed to a larger fraction of ice draining through marine-terminating outlets and to the warmer and more maritime climatic setting. Our results emphasize the potentially large role of calving and maritime melting in the mass budget of the ice masses in the Antarctic periphery.
Conclusions
We have presented the first detailed estimates of ice discharge for the ice cap on King George Island for the period 2008-11 based on glacier surface velocities estimated from SAR pixel offset tracking and ice thicknesses derived from simple principles of ice flow mechanics. We find an ice discharge rate of 0:720 ± 0:428 Gta∼1, corresponding to an ice-cap-wide specific rate of 0:64 ± 0:38 m a- 1 , which is larger than rates reported for ice caps in the High Arctic.
Our estimates of ice discharge suffer from substantial uncertainties in ice thickness, emphasizing the need for more comprehensive ice thickness measurements for glaciers in the Antarctic periphery. Only in this way will we be able to properly evaluate the response of ocean-terminating glaciers and ice caps to climate change. Future work will need to include estimates of the climatic mass balance (the sum of surface and internal balances) to assess the total mass change and its contribution to sea-level rise, and to evaluate the importance of ice discharge for total mass loss.
Acknowledgements
Funding was provided by US National Science Foundation project No. ANT-1043649, NASA project No. NNX11AO23G, DFG (German Research Foundation) No. BR2105 9-1 and the National Plan of R&D (Spain) project CTM2011-28980. We thank the ESF (European Science Foundation) ERANET Europolar IMCOAST project (BMBF award AZ 03F0617B), the Alaska Satellite Facility for data provision and M. Ruckamp for his suggestions and providing the ice thickness and measured surface velocity data via the PANGAEA database. Comments by two reviewers improved the manuscript.


