

INTRODUCTION
Basic and praticai studies of blowing snow have been made extensively in many northern countries throughout the world, and a considerable amount of information gathered (Mellar I965; Radok 1977). However, our understanding of’ basic processes is still unsatisfactory; among them the least clearly understood is the initiation process, that is the taking-off and acceleration mechanism of snow particles at the snow surface. This aspect is considered most fundamental and important in the phenomenon of blowing snow.
The present study seeks detailed information on the physical characteristics of blowing snow with a special reference to particle sizes, concentrations, velocities and saltation lengths. Measurements of static pressures, vertical heat transfer and electric charges were also conducted in relation to the dynamic mechanism of blowing snow. This paper reports only an outline of each measurement, detailed descriptions will be published separately.
EXPERIMENTAL APPARATUS AND METHODS
Experiments were conducted in a cold wind-tunnel (Figure 1) of working length 8.0 m, cross-sectional area 0.5 m x 0.5 m: temperature could be kept constant between 0 and -30˚C. Sieved snow particles of mean diameter 0.45 mm were sprayed in the tunnel, forming a layer roughly 3 cm thick, with smooth surface.

Fig. 1. Schematic Diagram Of Measuring Apparatus,
Measurements were made in steadily blowing snow, realised by feeding snow particles in at the windward end to trigger the onset of a snow drift (Maeno and others 1979). The average diameter of seed snow particles was 0.32 mm. Wind velocity was measured with a hot-film or thermister anemometer at mid-height of the tunnel, 25 cm above the snow surface.
Blowing snow particles were photographed by still and high-speed movie cameras using stroboscopie and/or continuous lights: particle concentrations and other parameters were obtained from the pictures. In some runs snow particles were captured with a silicon-oil-coated glass plate (25 mm x 530 mm) exposed for a few seconds or less perpendicularly, or parallel to the wind direction. Collected particles were measured with a microscope to give their size distributions as functions of vertical height and horizontal distance. Temperature, pressure and electric charge were also measured.
MOTIONS OF SNOW PARTICLES
Figure 2 was taken under a screened stroboscopie light lasting 25 μs at a wind velocity of 9.0 m/s. Each spot corresponds to an individual blowing snow particle. Figure 3 shows density of snow particles as functions of height and wind velocity. Mean concentrations, averaged in a vertical column 10 cm high, are not always higher in stronger winds (legend, Figure 3), since concentration depends not only on wind velocity but also on the complex structure and property of the snow surface; this is a reason for plotting normalized concentrations. The slopes of curves in Figure 3 imply that near the snow surface more particles are transported near the snow surface at lower than at higher velocities: hence the importance of saltation in a weak wind. The thickness of the saltation layer increases with increasing wind velocity (Figure 3).
Figure 4 gives the horizontal and vertical components of velocities of blowing snow particles, estimated from lengths of trajectories in a photograph taken at an exposure of 10 ms. Horizontal velocities of most descending particles are larger than those of ascending ones and comparable to the mean wind velocity. On the other hand, vertical velocities of descending particles seem to be smaller than those of ascending ones though the latter scatter in t wide range. The scatter is larger at lower levels: maximum at each level is indicated by a dashed line in the figure.

Fig. 2. Photograph of blowing snow particles taken with stroboscopie light lasting 25 μs.

Fig. 3. Cumulative number-concentration of blowing snow articles at various wind velocities, estimated from photographs.

Fig. 4. Horizontal and vertical velocities of blowing snow particles estimated from a photograph.
VERTICAL GRADIENT OF STATIC AIR PRESSURE
The above results are consistent with earlier analyses of particle trajectories photographed under illumination with time marks (Araoka and Maeno 1981). These noted the existence of a force acting downward on every particle in a saltation layer. The force is neither simple drag due to the surrounding air, nor Magnus force due to spinning. We attempted to measure static air pressures at two levels in blowing snow, the difference of which might be the cause of the downward force observed.
Pressure difference between two levels 30 mm apart, was measured using two static tubes of 1 mm diameter connected to a strain-gauge-type transducer and recorded on magnetic tape (Figure 5). In winds without drifting snow, the pressure difference (Δρ = PB - PA) was negative, ie static air pressure was lower at higher levels: the difference was Δρ = 0.11 Pa at 5.2 m/s and -10°C, corresponding to a vertical pressure gradient of -3.6 Pa/m. The pressure gradient became positive, however, when blowing snow was introduced.
In a run at -8.3˚C, wind velocity was gradually increased without seed snow particles. At wind velocities below about 5 m/s, no drifting took place and the pressure difference was negative and small. At wind velocities of 8-10 m/s, weak drifting occurred intermittently; pressure differences were positive at each drifting. When the wind velocity was increased to 11.2 m/s, the snow blew steadily and continuously, and the pressure gradient was steadily positive at 9.6 Pa/m,
These measurements verify the steady existence of a positive pressure gradient in a saltation layer of blowing snow, a gradient that exerts a downward force on every blowing snow particle. The presence of such a gradient was suggested by Owen (1964), who showed that there must be a pressure gradient to balance the vertical flux of momentum carried by saltating particles. The downward force due to the pressure difference is in accordance with the experimental result by Araoka and Maeno (1981), but its magnitude is too small: the downward acceleration produced on a spherical ice particle by the pressure difference of + 9.6 Pa/m is only 0.016 m/s2. Thus the downward force must be attributed to factors other than the pressure gradient.

Fig. 5. Schematic diagram of apparatus for measuring the vertical pressure gradient.
SALTATION LENGTHS AND SIZE DISTRIBUTIONS OF SNOW PARTICLES
The mean saltation length (1) of blowing snow particles was measured and given in Figure 6 as a function of wind velocity and temperature. The saltation length was estimated from the relation, 1 - Q/G, derived by Bagnold (1936) and Kawamura (1951) for steady uniform saltation in sand storms, where Q (kg/m 2s) is the total drift transport rate (ies the mass transported in a unit time through a vertical surface of a unit width perpendicular to the wind direction) and G (kg/m2s) is the mass flux of falling or taking-off particles on an equilibrium surface. Q and G were measured by using the snow-collector shown in Figure 1. The collector was composed of six boxes lined up in the wind direction; each box was 10 cm long, 20 cm wide and 10 cm deep.
Though the data in figure 6 are scattered, the increase in I with wind velocity is clear, seeming to show that 1 is proportional to the squared velocity. On the other hand, there seems no obvious relation between 1 and temperature. In fact the saltation length is a function of various factors including sizes and physical properties of snow particles and the structure of the air flow.

Fig. 6. Mean saltation length plotted against the wind velocity.

Fig. 7. Diameters of blowing snow particles plotted against height. The particles were captured with an oil-coated plate.
Figure 7 shows vertical distributions of average diameters of blowing snow particles observed at four different wind velocities. Each of the four represents a profile at the moment when the glass plate coated with oil was exposed to the blowing snow. The standard deviations are larger at lower levels and become smaller with height; this tendency is also shown in the histograms in Figure 8. The large standard deviations and broad distributions of particle diameters at lower levels correspond to the presence of various particle velocities there as shown in Figure 4; in agreement with the result of Maeno and others (1979) and Araoka and Maeno (1981) they suggest a complex process of particle accelerations within a layer of a few millimeters above or partly in the snow layer.
The average diameter seems to be almost constant near the snow surface, but begins to decrease rather sharply several centimeters above the surface; the height is considered to correspond to the thickness of the saltation layer, which increases with increasing wind velocity. Above the saltation layer, snow particles are transported in the suspended state, and so their size distributions and height dependences will change too.
VERTICAL HEAT TRANSPORT IN BLOWING SNOW
It has been reported that the heat transfer coefficient in a fluidized snow is several times larger than that in an air flow containing no snow particles (Kaneda and Maeno 1980; Maeno and others 1980). To examine the effect of blowing snow on the vertical heat transfer, a strong inversion layer of temperature was produced above the snow surface by cooling with crushed C02 (2-3 cm in thickness) laid under the snow layer. The temperature of air above the snow surface was measured with fine copper-constantan thermocouples (0.1 mm in diameter), which were fixed at ten levels and protected from impact with snow particles by gauze. Temperature measurements were taken every ten seconds by use of a computer-controlled data logger.

Fig. 8. Histograms of particle diameters of blowing snow particles in the same runs as in Fig.7.
A typical result of the measurement is shown in Figure 9. When the temperature of the surrounding air was -9.5 °C and wind blew at a speed of 6.2 m/s without drifting snow, a steady boundary layer of temperature was formed above the snow surface (open circles in Figure 9); the temperature gradient in the layer was roughly 15°C/m, but that in the thin layer, possibly a few millimeters thick, just above the snow surface was much stronger, amounting to 3000 °C/m.

Fig. 9. Variations of vertical temperature profile caused by blowing snow.
When blowing snow was initiated the temperature at each point began to decrease and the temperature change propagated upward from the bottom. It was noted that the temperature change was greater at lower levels than at about 6 cm, suggesting the effective heat transfer in the saltation layer.
When the snow was not blowing, temperature was proportional to the logarithms of height in the boundary layer, about 10 cm thick (Figure 9). On the analogy of the wind velocity profile and the momentum transfer, the linear relation can be explained to show that the vertical heat flux is constant in the boundary layer. Our result showed that blowing snow destroyed the linear relation and weakened the temperature gradient especially at levels below 6 cm where saltating motions were most active.
We conclude that blowing snow increases the vertical transport of heat. The increase is attributed to the enhanced turbulent diffusion and the direct heat transfer between the air and saltating particles, both of which can be described as the increase in the apparent turbulent diffusion coefficient,
ELECTRIC CHARGE OF BLOWING SNOW PARTICLES
Electric charge of blowing snow particles was measured with an electrometer; snow particles were collected in a Faraday cage located at various distances from the end-step of the snow layer (Figure 10). The height of the step was 15 cm. Figure 11 gives the observed charge of snow particles collected at about 30 cm from the step. The charge was approximately -0.1 μC/kg at -5°C and its magnitude increased with lowering temperature.
Though no dependence on wind velocity was found in the range from 5 to 9 m/s, seed snow particles gave important effects: the particles used in our experiment to initiate blowing snow were supplied into the wind-tunnel along a wooden guide, by which they were charged negatively, -0.06 to -0.4 μC/kg at -10°C. On the other hand, when the seed snow particles were supplied along an acrylic plate, they were charged positiviely; the charge was roughly +6 μC/kg at -15 *C. Both of the negative and positive seeds gave essentially similar results to those of Figure 11, which leads to a conclusion that the charge generation is directly related with the interaction between blowing snow particles and the snow surface. The conclusion is supported by the fact that the magnitude of charge is small when positive seeds are used and the charge was definitely negative when blowing snow appeared spontaneously at high wind velocities or low temperatures without using seeds (Figure 11).

Fig. 10. Schematic diagram of electric measurement of blowing snow particles.
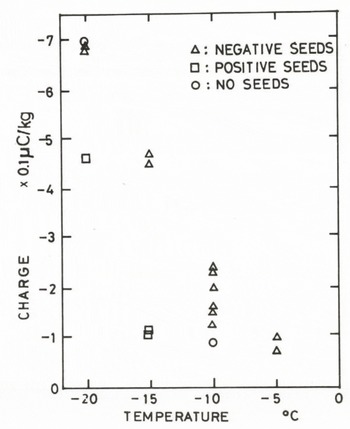
Fig. 11. Electric charge of blowing snow particles plotted against temperature.
Figure 12 compares our results with those of Wishart (1968) and Latham and Montagne (1970), who measured the charge of blowing snow particles respectively at Byrd Station, Antarctica and Montana, USA. The magnitude of charge we observed is much smaller than that in natural blowing snow. The difference is attributed to the fact that the fetch of our wind-tunnel is not long enough. The charge separation is considered to take place mostly between blowing snow particles and the snow surface when they take off from the surface so that on average their sign is negative and that of the surface positive. The charge carried by the taking-off particles is discharged in various ways, by collision with other particles and the positive snow surface. Consequently the average charge acquired by blowing snow particles is determined by the net balance of the two opposing processes.

Fig. 12. Electric charge of blowing snow particles as a function of temperature and wind velocity.
Open circles in Figure 12 refer to snow particles collected just below the snow step. The magnitudes of their charges are small because they saltated at lower levels only requiring a weak charge and easily discharging it in the frequent contact with the surface.
Electric measurements were also made for snow particles sampled from various points on the blowing snow surface. Snow particles composing the roof of a cornice formed at the snow step had negative charges, roughly -0.007 μC/kg. The charge of a drift formed behind the step was also negative, about -0,06 μC/kg. The two measurements are in good agreement with the result obtained above since both of a cornice and drift are formed with blowing snow particles, which are charged negatively. The sign of electric charge of particles sampled from the snow surface was not unique but varied from place to place, their magnitudes ranging from -0.01 to +0.03 μC/kg. It is suggested that the negative and positive charges correspond to the local accumulation and erosion areas on the snow surface respectively; wave patterns were often observed to form in the course of blowing snow experiments in the wind-tunnel.
ACKNOWLEDGEMENTS
This work was partly supported by the Grant-in-Aid for Co-operative Research and Scientiric Research of the Ministry of Education, Science and Culture, Japan, and the Railway Technical Institute, Japanese National Railways.


