


Introduction
Twenty years ago, Brännvall et al. (Reference Brännvall, Bindler, Renberg, Emteryd, Bartnicki and Billström1999) published the first high-resolution evidence demonstrating that the largest-scale lead pollution in Northern Europe prior to the modern era occurred between c. AD 1150 and 1200. Their evidence came from concentration and isotope analysis of lead deposited in annual varve sediments from Swedish lakes (Brännvall et al. Reference Brännvall, Bindler, Renberg, Emteryd, Bartnicki and Billström1999: 4392–93). This peak in lead pollution almost certainly reflected later twelfth-century urban population and economic growth in Western and Central Europe. Brännvall et al.'s (Reference Brännvall, Bindler, Renberg, Emteryd, Bartnicki and Billström1999: 4394) application of heavy metal aerosol-transport modelling suggested that the largest quantities of lead pollution had been delivered, in order of magnitude, from England, Germany, Wales and Poland.
Our study uses ultra-high-resolution evidence from the new Colle Gnifetti (CG) ice core (Switzerland), along with textual and archaeological sources, to affirm Brännvall et al.'s (Reference Brännvall, Bindler, Renberg, Emteryd, Bartnicki and Billström1999) conclusion that England was the major contributor of pollution in the later twelfth and early thirteenth centuries AD. Detailed yearly analysis of the different sources of evidence indicates that, for the mid 1160s to 1216, the CG ice core provides a measurable, continuous record of the environmental impact and economic history of silver and lead production in England under the Angevin kings, Henry II, Richard the Lionheart and John. As a result of the way in which they affected production, key events linked to the political economy of the Angevin Empire, from warfare and castle and monastery construction to the deaths of monarchs, are inscribed into the pollution record.
The Colle Gnifetti ice-core chronology and annual lead-pollution record
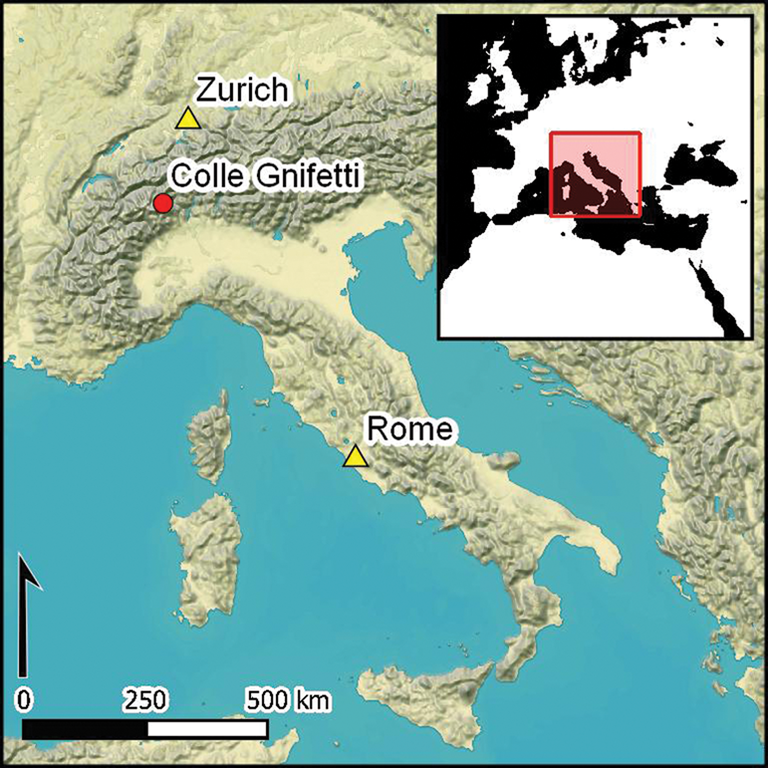
The new CG ice core was extracted in 2013 from the north-facing slope of the glacier at Monte Rosa (45°55′ N, 7°52′ E), 4450m asl (Figure 1). The chronological framework for analysis of the ice core was established in two stages: firstly, through continuous-flow analysis, high-resolution discrete inductively coupled plasma mass spectrometry (ICP-MS) and ion chromatography; and secondly by annual layer-counting using ultra-high-resolution laser ablation inductively coupled plasma mass spectrometry (LA-ICP-MS) (see Sneed et al. Reference Sneed2015; More et al. Reference More2017; Bohleber et al. Reference Bohleber, Erhardt, Spaulding, Hoffmann, Fischer and Mayewski2018; Loveluck et al. Reference Loveluck2018). Discrete liquid-based ICP-MS measurement of the concentration of lead and other elements was also conducted along the small melted portion of the core, at an average resolution of 45mm from a water stream generated by the continuous melter system (Bohleber et al. Reference Bohleber, Erhardt, Spaulding, Hoffmann, Fischer and Mayewski2018).
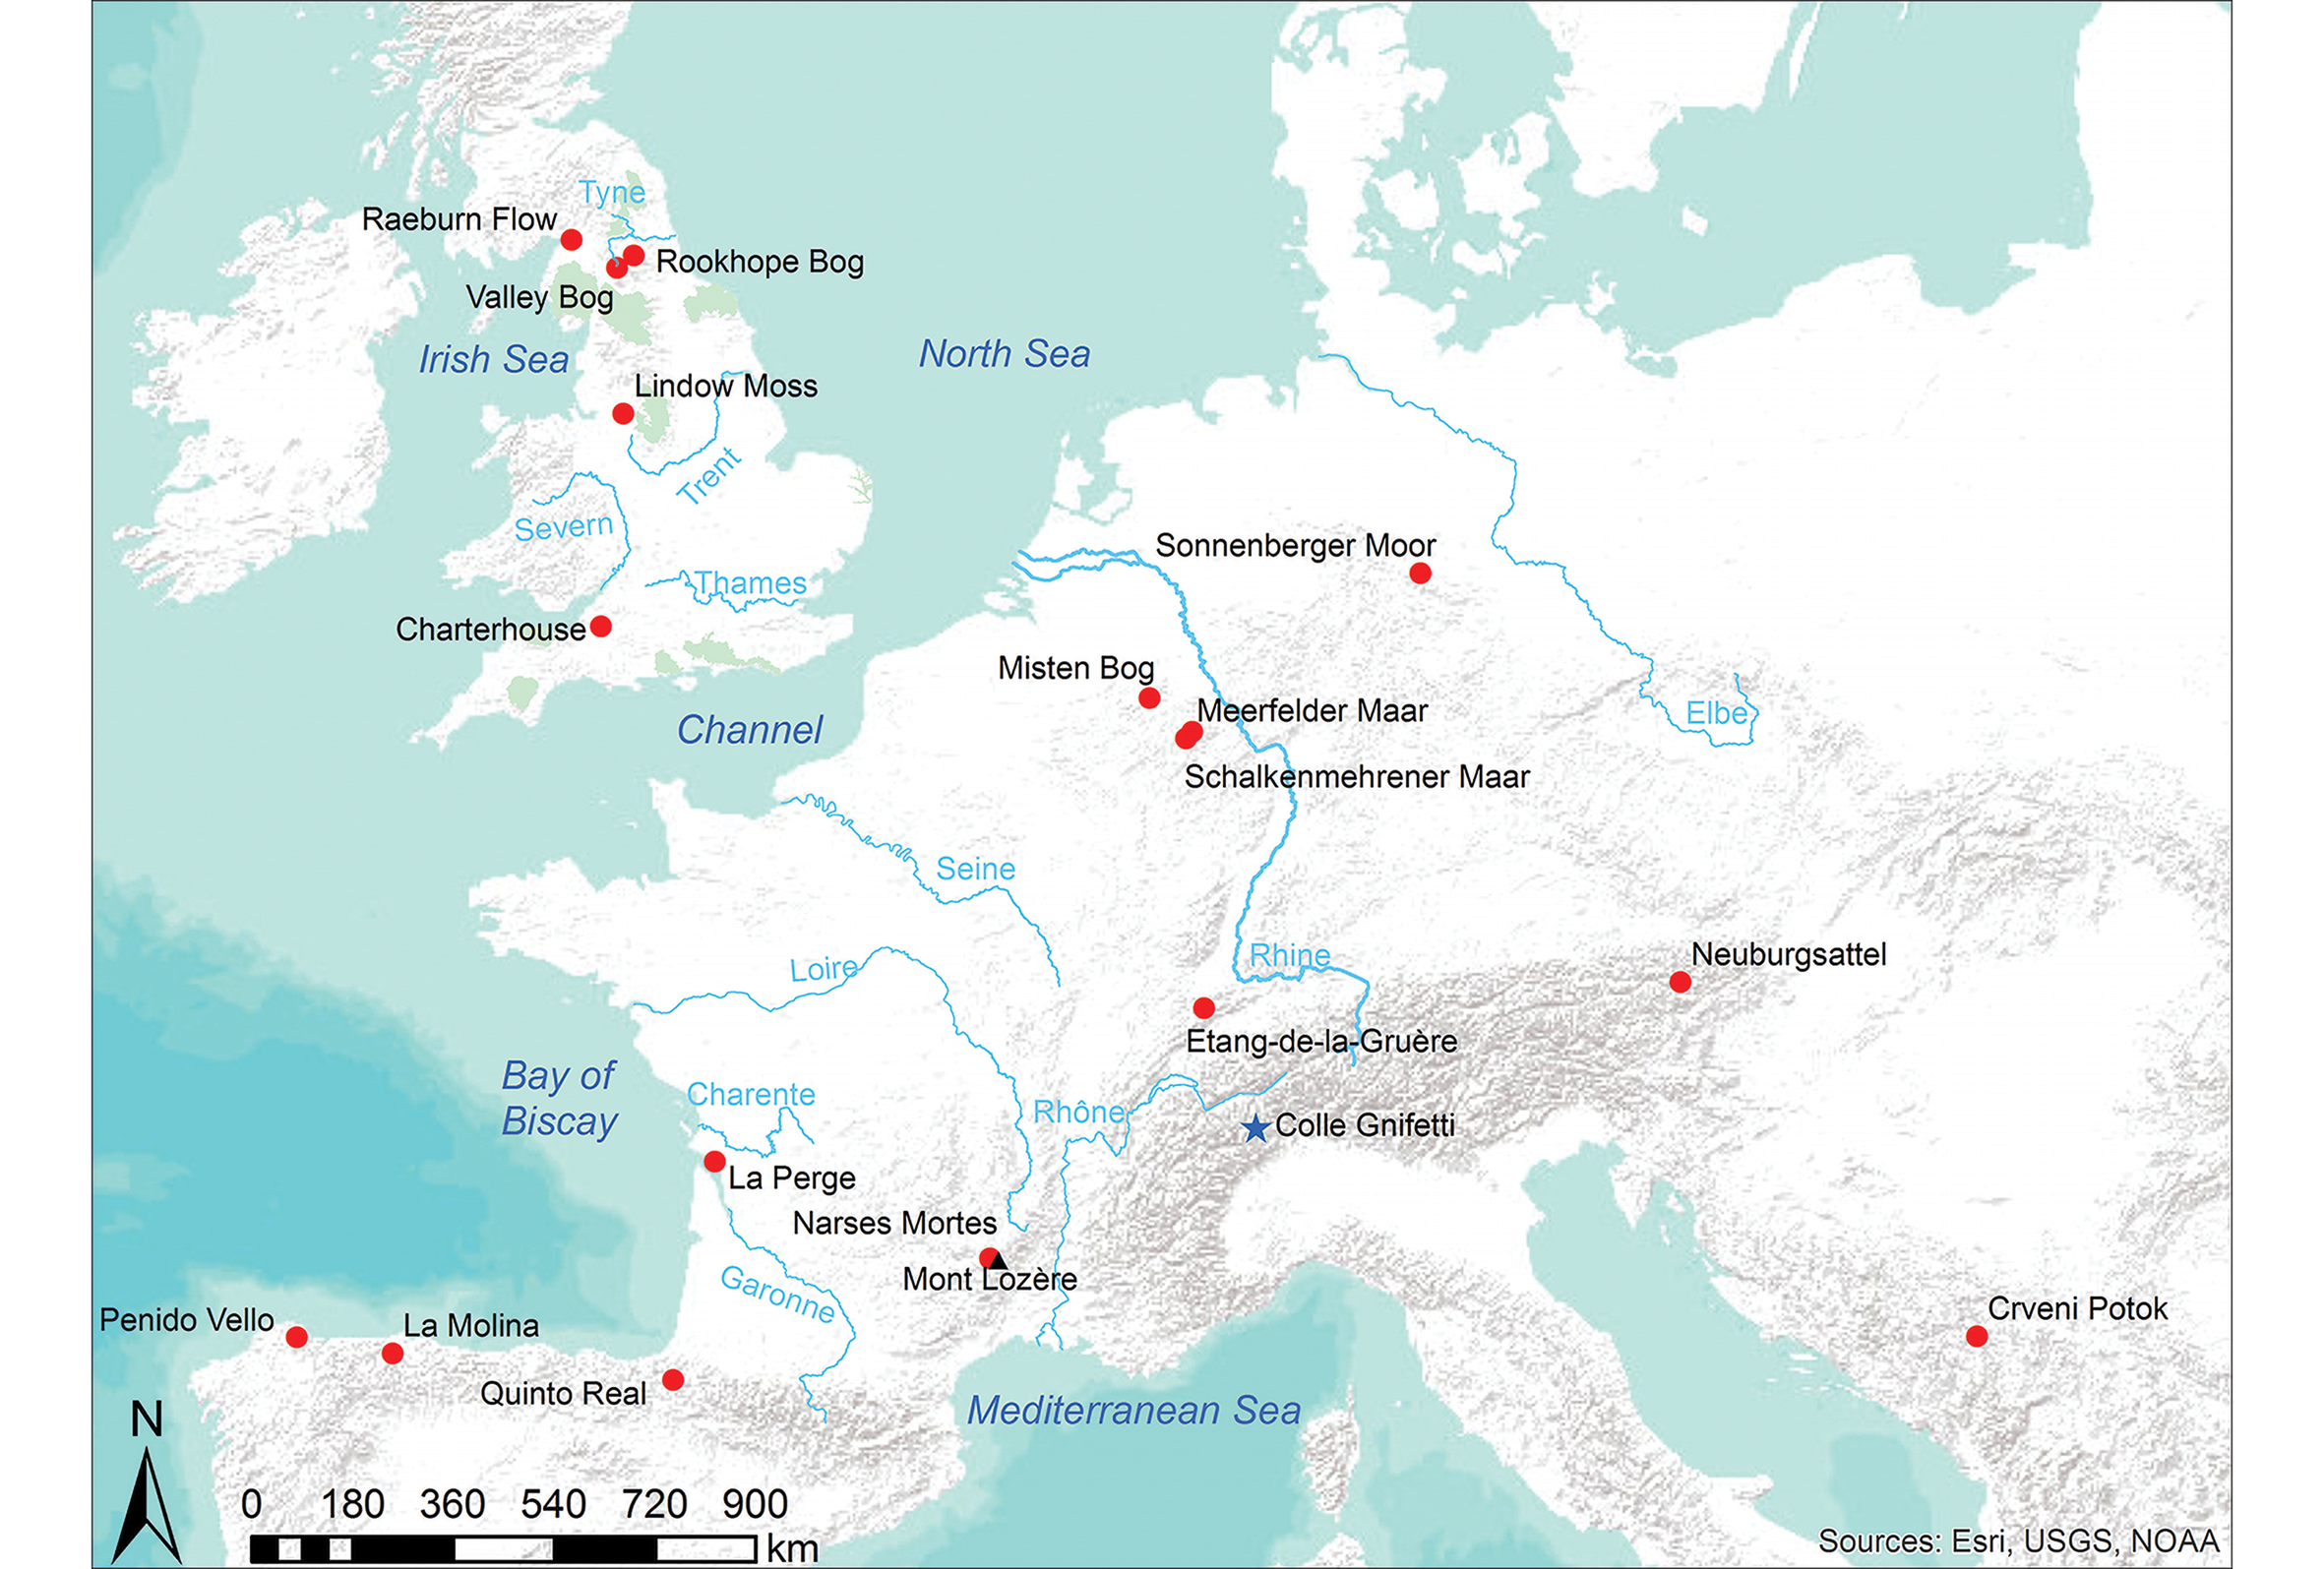
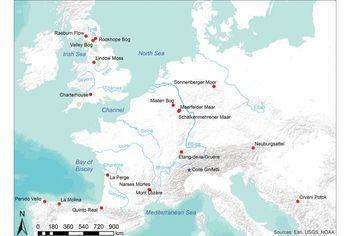
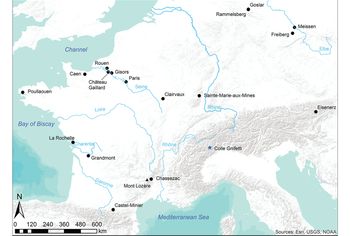
Figure 1. Location of environmental records referred to in the text (figure by S. Troadec).
The LA-ICP-MS annual-layer chronology and lead-intensity record was tied to absolute chronological markers to constrain the methodological error margin. For this study, covering the mid twelfth to early thirteenth centuries, the initial absolute-dating ties were provided by recorded major Saharan dust events (Bohleber et al. Reference Bohleber, Erhardt, Spaulding, Hoffmann, Fischer and Mayewski2018), although the most important absolute markers come from the AD 1349–1353 Black Death pandemic (More et al. Reference More2017, Reference More2018), and the eruption of the Icelandic volcano Eldgjá, in AD 939 (Oppenheimer et al. Reference Oppenheimer, Orchard, Stoffel, Newfield, Guillet, Corona, Sigl, di Cosmo and Büntgen2018). Theoretically, while there could have been a 35- to 40-year error at the point in the ice dated to 1349 by layer-counting, in practice the lead intensity plummeted to levels barely measurable precisely at the layer-counted ice dated to 1349. This independently demonstrates that there was no actual error in the annual layer-counting in the mid fourteenth century. The CG Eldgjá marker was dated by layer-counting to 945, giving a maximum error of six years from the eruption date in 939. Therefore, a six-year error margin had accumulated over the 410-year interval between 1349 and 939. Assuming an equal build-up of error, the error margin envelope encompassing this study would be 1.8 years at 1220 (±1 year), and 2.9 years (±1.5 years) at 1150.
Figure 2 shows both the LA-ICP-MS ultra-high-resolution yearly mean lead-intensity measurements (based on 100–102 measurements per year; see the online supplementary material (OSM) 1) and the lower-resolution lead concentration measurements from the discrete ICP-MS analysis, with one sample for every three to seven years. Despite the disparity in resolution, the plotted trends from the concentration data are very similar to the intensity data, although with an expected discrepancy of up to two years between the concentration measurements and the mean yearly intensity readings.
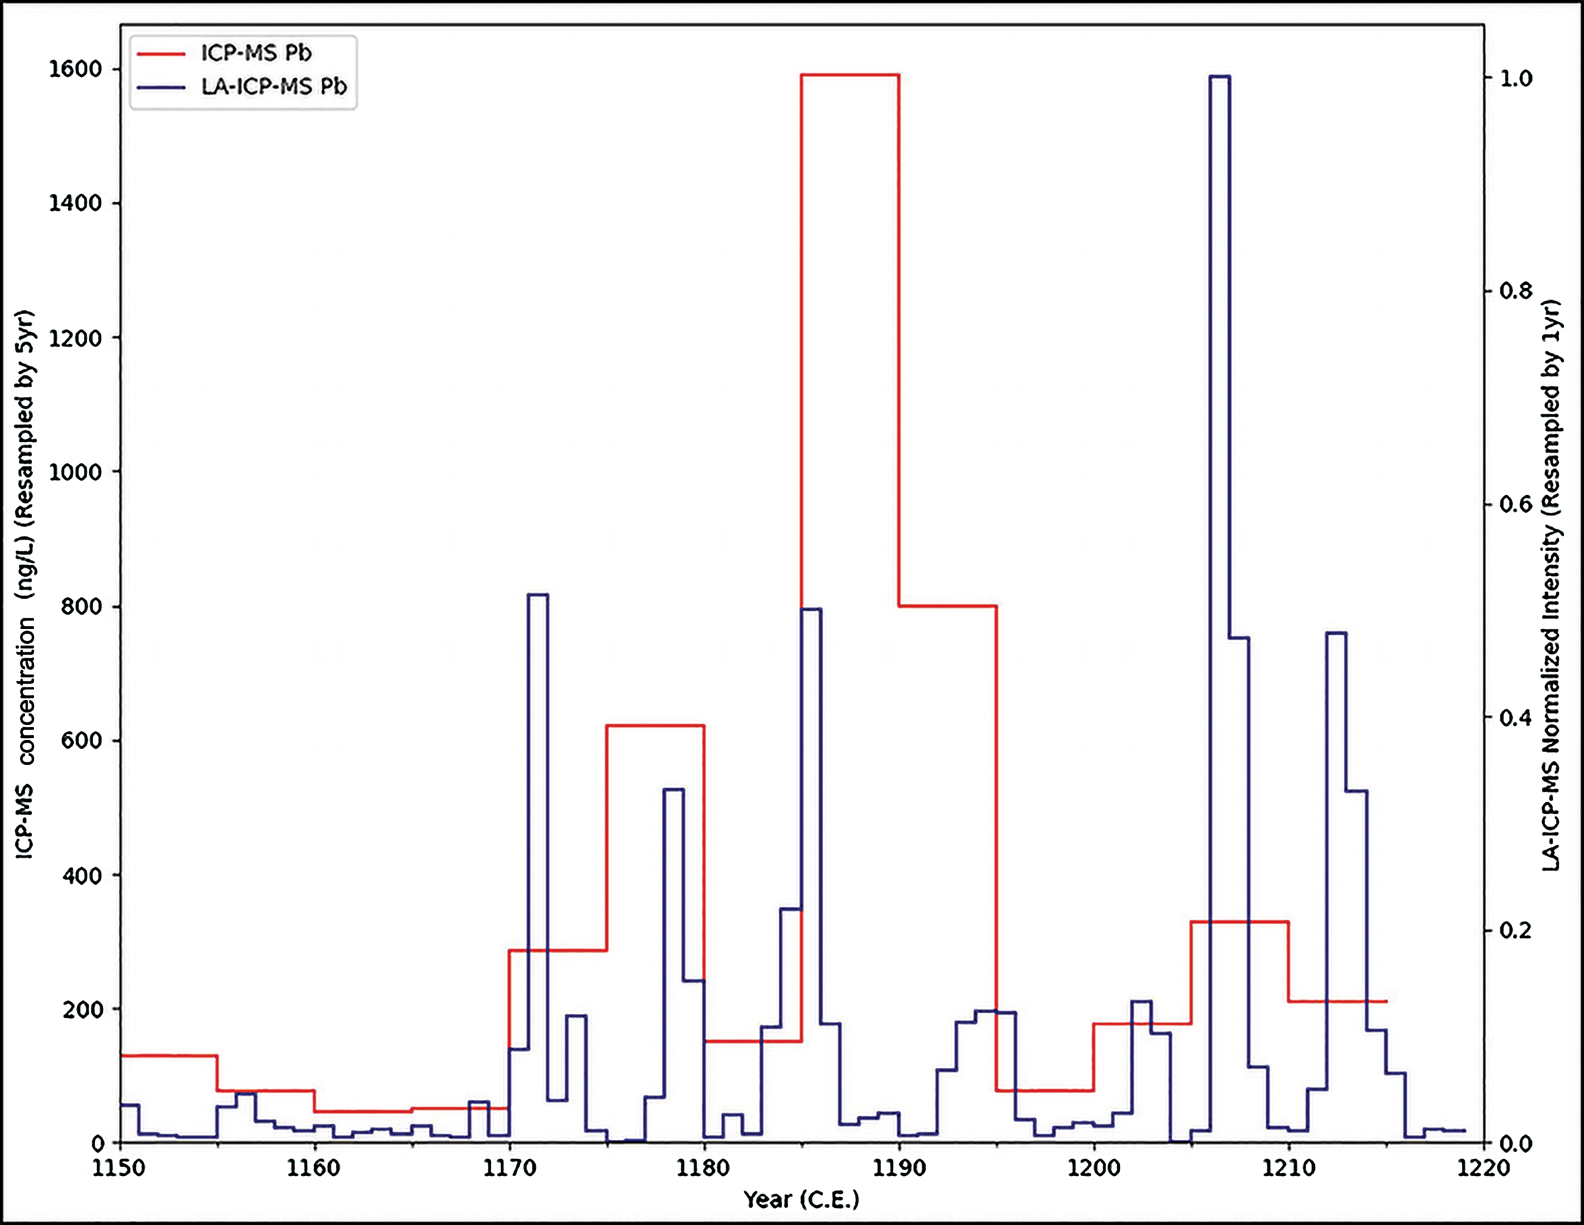
Figure 2. The Colle Gnifetti ultra-high-resolution LA-ICP-MS yearly mean lead-intensity record and high-resolution ICP-MS concentration record, AD 1150–1220 (figure by A. Kurbatov & H. Clifford).
Sourcing the origins of the CG lead pollution record between AD 1150 and 1220
The decades from c. 1150–1220 constitute the period of the highest quantifiable levels of lead pollution at CG between c. AD 150 and 1650, as identified by discrete ICP-MS measurement of lead concentration (More et al. Reference More2017: fig. 1). This peak in lead pollution c. AD 1200 was previously identified at a lower resolution in an earlier ice core from CG (Gabrieli & Barbante Reference Gabrieli and Barbante2014: 76), and in North-western and Central European peat-core records (see OSM 2). In order to exploit the new yearly lead-pollution record and go beyond existing observations of general coincidence with historic phenomena, however, we needed to identify the most probable sources of the pollution. This was achieved using textual and archaeological evidence, lower-resolution pollution records from European mining regions, and Climate Reanalyzer™ visualisation, with NOAA-CIRES climate data from 1979–2014 (Figures 1–5).
The Harz Mountains represent the mining region least likely to have contributed to the CG lead record from c. 1150–1220. Prior to early modern exploitation, the production of silver-lead concentrated in two periods in this region: from c. AD 960–1050 and c. AD 1280–1330 (Böhme Reference Böhme1978; Spufford Reference Spufford1988). The first large-scale silver-lead mining in the 960s–990s facilitated the minting of the ‘Otto-Adelheid’ pennies, with silver mainly from the Rammelsberg mine, near Goslar (Figure 3; Ehlers Reference Ehlers1997: 48–49; Kluge Reference Kluge, Schneidmüller and Weinfurter2002: 93–101). By c. 1040, these pennies were no longer struck, and Harz silver-lead production was minimal from 1050–1300 (Spufford Reference Spufford1988: 93–94). Archaeological evidence, however, suggests that copper- and iron-mining activities overall expanded in the Upper Harz, between c. 1100 and 1300 (Klappauf et al. Reference Klappauf, Bartels, Linke, Asmus and Brandt2008; Knapp et al. Reference Knapp, Nelle and Kirleis2015: 52–54). A peat core from the Sonnenberger Moor in the Upper Harz shows no significant lead pollution from c. 950–1050, but does present copper pollution—and lead as a by-product—from c. 1100–1300, reflecting that localised expansion (Kempter & Frenzel Reference Kempter and Frenzel2000: 100).
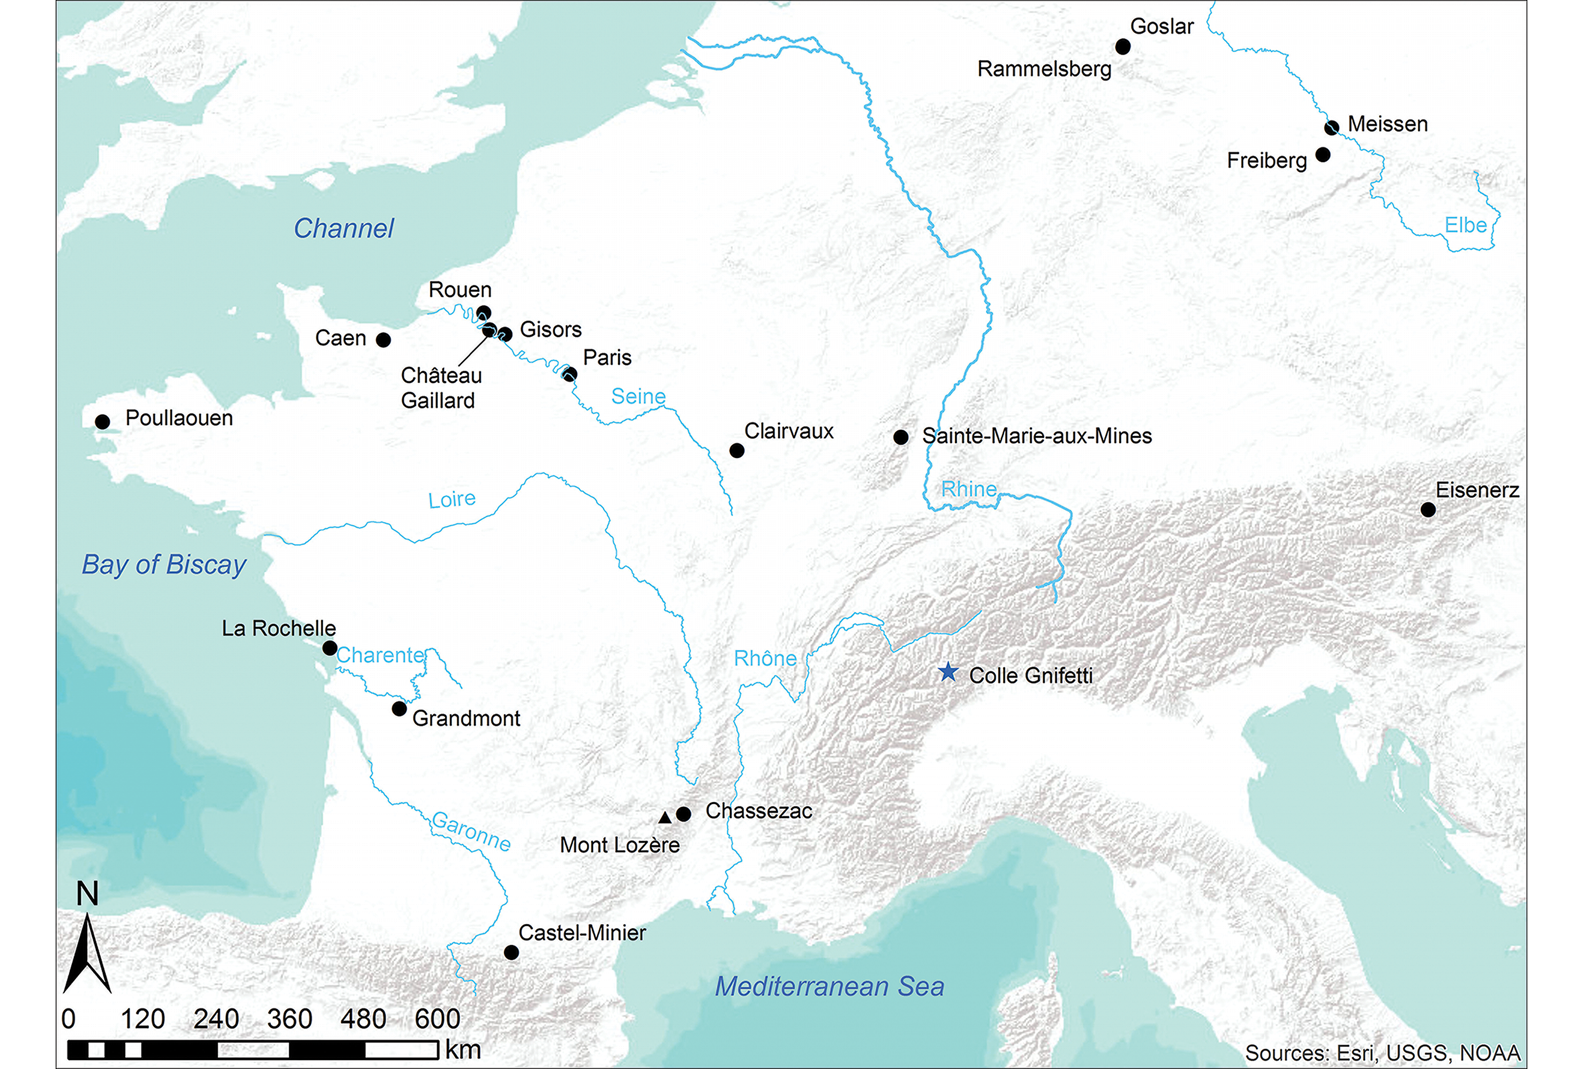
Figure 3. Location of places in continental Western Europe discussed in the text (figure by S. Troadec).
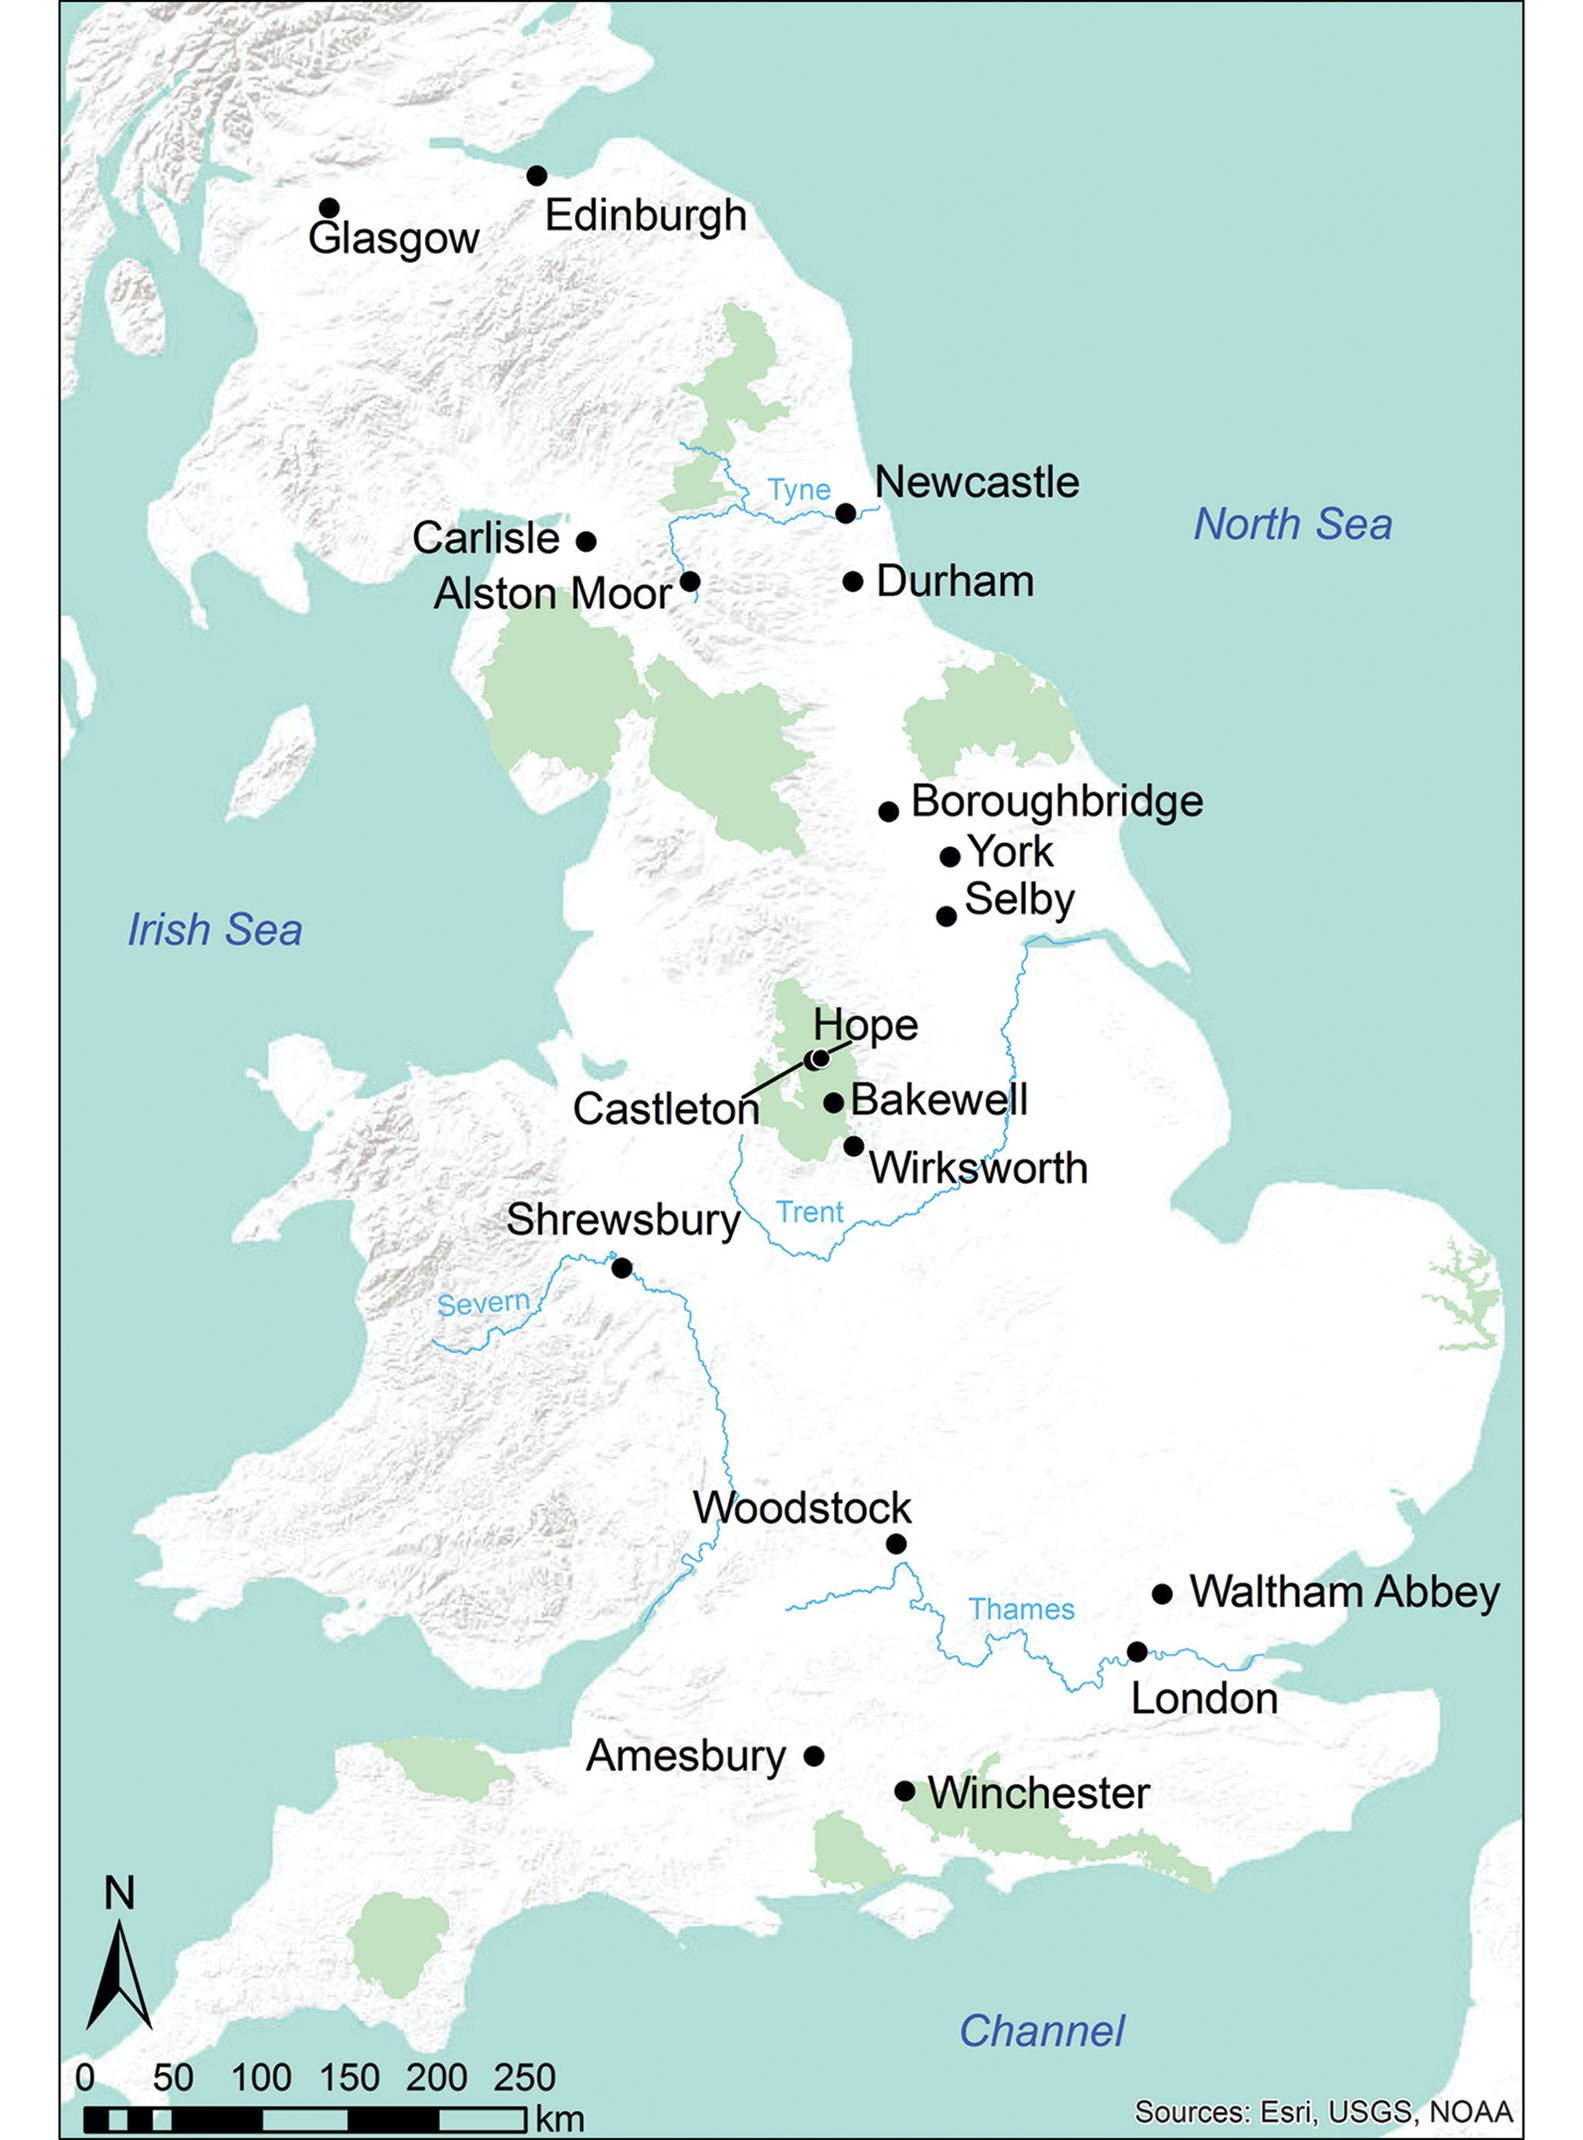
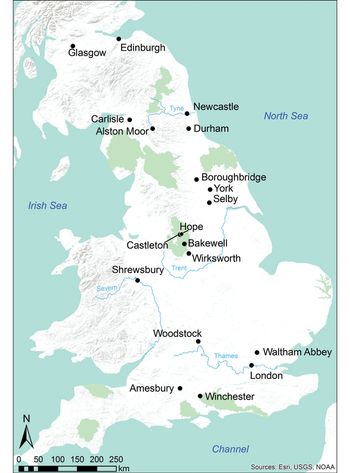
Figure 4. Location of places in Britain discussed in the text (figure by S. Troadec).
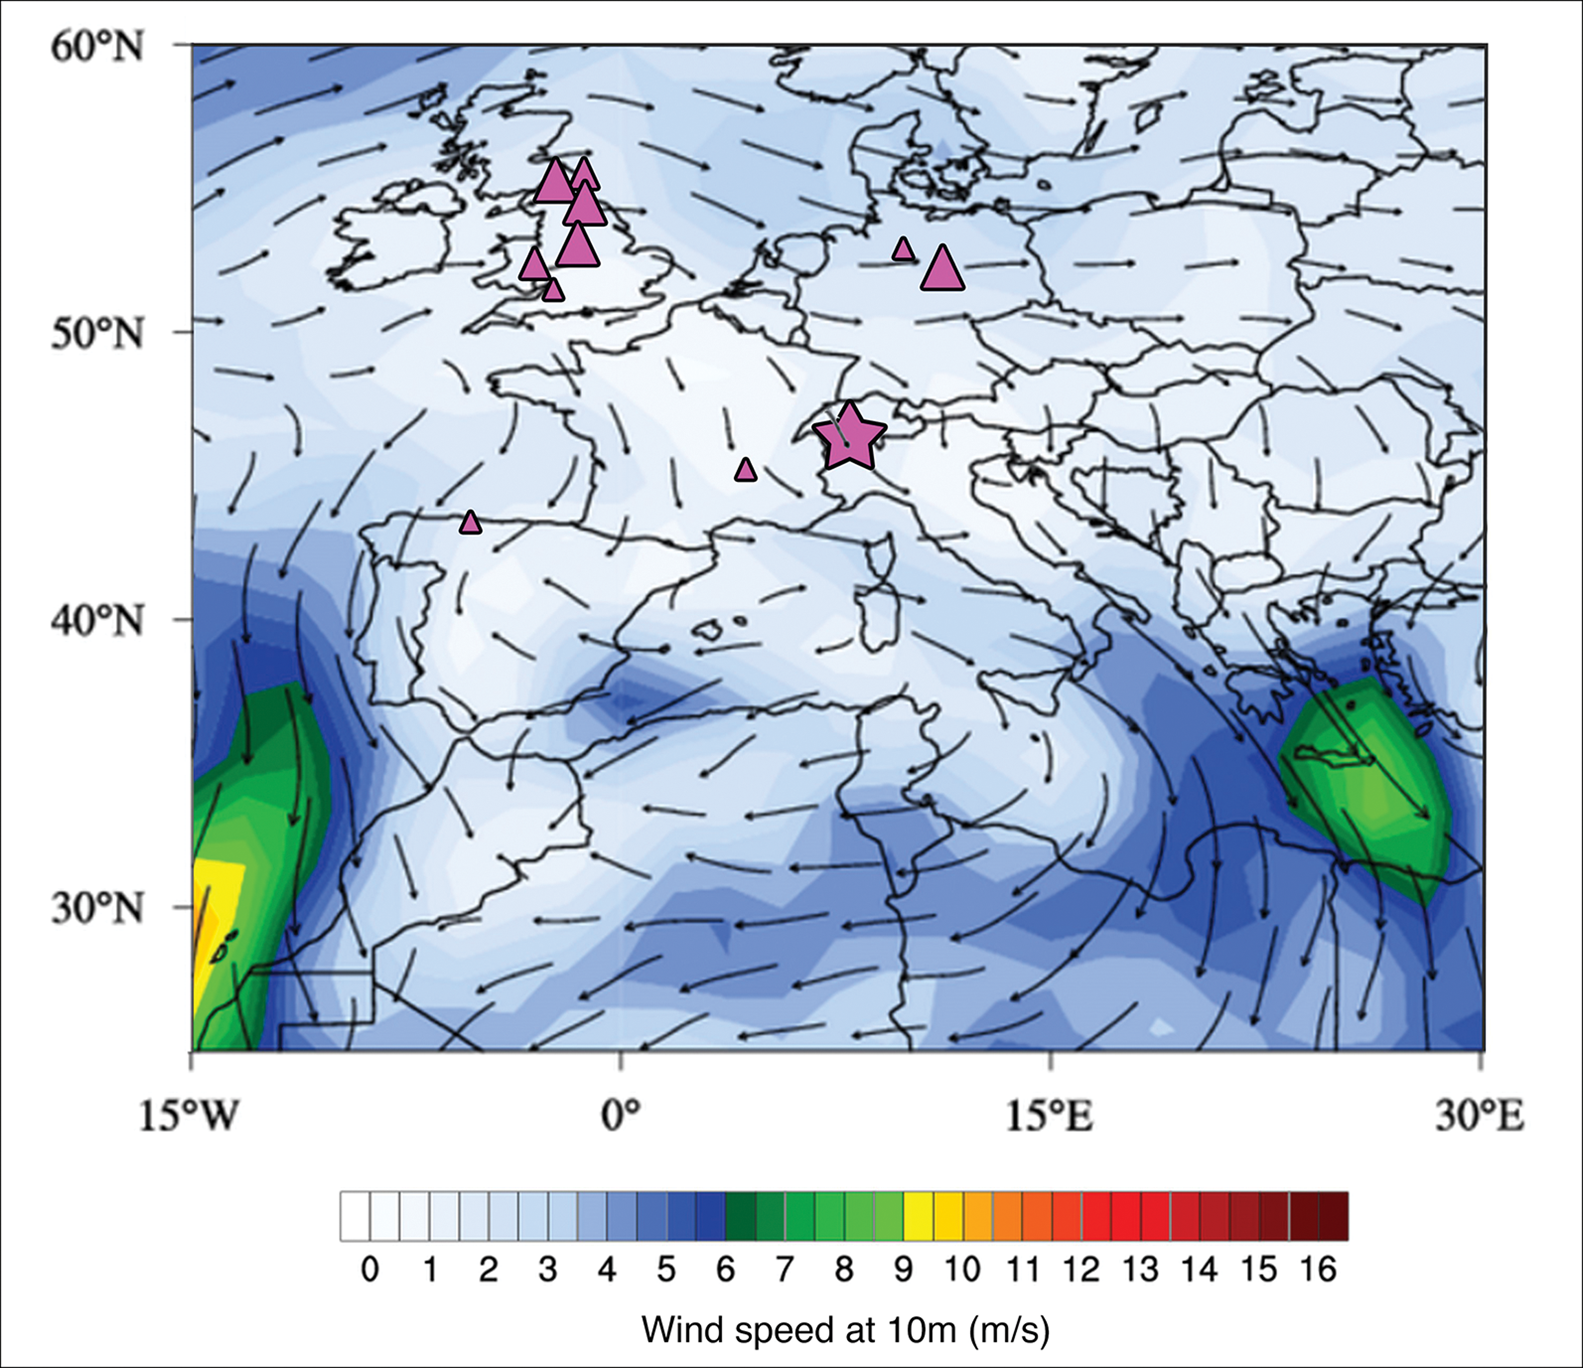
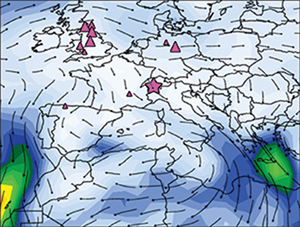
Figure 5. Climate Reanalyzer™ plot for June, July and August 1984, showing predominant directions of wind delivery to Colle Gnifetti and principal lead-producing regions, AD 1150–1220 (figure by A. More & the Climate Change Institute, University of Maine).
The largest continental European region that produced silver and lead from the mid twelfth century was the Erzgebirge (Ore Mountains) region around Freiberg, Saxony (Figure 3). Probably discovered in 1168, this ore-field was the paramount supplier of European silver until c. 1250 (Böhme Reference Böhme1978: 75; Spufford Reference Spufford1988: 112–13). Silver production in the Erzgebirge was large-scale and continuous through the first half of the thirteenth century, contrasting with reduced pollution at CG between c. 1190 and 1250 (Figure 2; More et al. Reference More2017).
The other major lead-silver-producing regions in Europe between c. 1150 and 1220 were located in Britain, and were generally administered under the label ‘mine’. By the 1150s, the most important of these were the mine of Carlisle, and the mines of the Derbyshire Peak District, administered from Castleton and Wirksworth. Others included the mine of Yorkshire, focused on Boroughbridge; the mine of Shropshire, administered from Shrewsbury; and the mines of the Bishops of Durham, in the northern Pennines (Figure 4). The production of lead is well documented in the audit records of royal taxation, known as the Pipe rolls (Great Rolls of the Pipe). These records were collated yearly by the Royal Treasury/Exchequer of the Angevin Kings of England from 1156, and in great detail from 1167 onwards (Barratt Reference Barratt, Harper-Bill and Vincent2007: 248–54; Allen Reference Allen2011). They record annual taxation owed and paid—known as ‘farm’ payments—for holding the franchises of the ‘mines’, as well as royal requisitions/purchases of lead by right of ‘pre-emption’ in ‘cart-loads’. The cart-load was a unit of account, averaging approximately one imperial ton, although its weight-measure varied slightly in different ore-fields (Latimer Reference Latimer and Church1999: 49–50).
Continuous mining into the modern era has destroyed much of the medieval evidence at British ore-fields. This has included the systematic re-smelting of medieval slag heaps, particularly in the Peak District (Barnatt et al. Reference Barnatt, Huston, Mallon, Newman, Penny and Shaw2013). Nevertheless, peat pollution records at Lindow Moss (Cheshire) and Raeburn Flow (Dumfries and Galloway) confirm that the nearby mines of Shropshire and Carlisle were producing large quantities of lead between c. 1150 and 1200, with a decline after 1200 (within their error margins) (Le Roux et al. Reference Le Roux, Weiss, Grattan, Givelet, Krachler, Cherbukin, Rausch, Kober and Shotyk2004: 504–507; Küttner et al. Reference Küttner, Mighall, de Vleeschouwer, Mauquoy, Martínez Cortizas, Foster and Krupp2014: fig 3c; see OSM 2).
Atmospheric circulation visualisation using Climate Reanalyzer™ has revealed a consistent pattern of wind delivery to the Western Alps from the north-west, especially during the summer, which coincided with the medieval lead-producing season. Previous analyses of textual and archaeological evidence for the decades AD 640–670 and 1330–1370 suggest that the pollution at CG originated mainly from western France and Britain, respectively, at those times (More et al. Reference More2017: 214–17; Loveluck et al. Reference Loveluck2018: 6–10). Figure 5 shows a Climate Reanalyzer plot for June, July and August, with the largest silver-lead-producing regions of Europe from c. 1150–1220 (triangle sizes on Figure 5 equate to the scale of production). The mines of Britain are indicated as the most probable sources of the pollution. Any lead aerosol from the ore-fields of the Harz and the Erzgebirge travelled east and south-east, to Poland from the Harz, and to Austria and the Balkans from the Erzgebirge. This long-term north-west to south-east wind direction, driven by the Iceland Low, is confirmed consistently by studies on the transport of Icelandic tephra across North-west Europe to Italy and Slovenia from the onset of the Holocene to the present; and by analysis of historic volcanic plume transport from Icelandic eruptions (see OSM 3). For this study, the possible influences of climatic- and wind-strength variations on quantities of lead aerosol delivered to CG, within its predominantly spring-to-summer record (Bohleber et al. Reference Bohleber, Erhardt, Spaulding, Hoffmann, Fischer and Mayewski2018), have been addressed by taking the mean value of the 100–102 measurements per year, between AD 1150 and 1220.
Smaller-scale lead production in southern France could also have fed the CG lead profile. The Narses Mortes peat core (Mont Lozère, Cévennes), for example, has a lead peak from c. 1156–1264 (at 95.4 per cent confidence), and nearby smelting sites have a similar date range (Baron et al. Reference Baron, Lavoie, Ploquin, Carignan, Pulido and de Beaulieu2005, Reference Baron, Carignan, Laurent and Ploquin2006). Unlike the CG record, however, this localised production did not decline from 1200–1250. Lead pollution also increased from c. AD 1000–1200 at Étang-de-la-Gruère (Jura), and origins were suggested from sources in Germany (but not the Harz), using lead isotopes (Shotyk et al. Reference Shotyk, Weiss, Appleby, Cherbukin, Frei, Gloor, Kramers, Reese and van der Knaap1998: 1637–40). Production, however, was not local; non-German sources were not considered by Shotyk et al. (Reference Shotyk, Weiss, Appleby, Cherbukin, Frei, Gloor, Kramers, Reese and van der Knaap1998), and lead isotope characteristics often overlap between ore-fields (Blichert-Toft et al. Reference Blichert-Toft, Delile, Lee, Stos-Gale, Billström, Andersen, Hannu and Albarède2016: S1). Copper and lead-silver mining/smelting sites in the Chassezac Valley (Ardèche) also date from the eleventh to thirteenth centuries, but were small in scale compared to British and Erzgebirge production; its pollution would have travelled south-east over the Mediterranean (Bailly-Maître et al. Reference Bailly-Maître, Minivielle-Larousse, Kammenthaler, Gonon and Guionova2013; see OSM 3). Contemporaneous evidence for lead-silver extraction is also absent in French regions that became major producers from the later Middle Ages, such as Sainte-Marie-aux-Mines, Vosges, and Castel-Minier, Ariège (Téreygeol Reference Téreygeol and Timbert2009: 84–85; Flament et al. Reference Flament, Mercier, Dubois and Téreygeol2019). Environmental records from other areas (e.g. Lorraine, the Eifel region, the Pyrenees or Spain), dating from 1150–1200, have yielded either no pollution, or very limited localised activity (see OSM 2; Figures 1 & 3).
A yearly history of the political economy of the Angevin Kings, AD 1167–1216
The contextual evidence all suggests that the ore-fields of Britain were the principal source of the lead pollution at CG from 1150–1220. The yearly mean LA-ICP-MS lead record from CG was therefore compared with the only other detailed yearly lead record from this period: the English Pipe rolls from 1167–1216.
Two principal proxies were selected from the Pipe rolls as probable reflections of the production of lead, and also silver in the case of the ‘mine of Carlisle’. Firstly, the ‘farm’ franchise payments in silver were quantified for the two main lead-producing regions: the ‘mine of Carlisle’ and the mines of the Derbyshire Peak District. As demands were often far beyond what franchise holders could pay, farm payments were quantified based on what was actually paid to the Treasury each year. Arrears payments for earlier years were quantified in the year that they were accounted in the rolls. The aim was to examine the pattern of farm payments against levels of pollution per year; logically, larger yearly silver payments might reflect larger-scale silver and lead production (Claughton Reference Claughton2003; Allen Reference Allen2011: 116). Secondly, the number of cart-loads of lead were quantified by year as cumulative totals sent from all the mines combined (individual farm and cart-load totals by year for different ‘mines’ are recorded in OSM 4–8; all numerical data are presented in OSM 9). These could then be compared with the CG yearly mean pollution record.
Henry II obtained the mine of Carlisle from the King of Scotland in 1157, after it had been ceded to Scotland in 1136 (Carpenter Reference Carpenter2003: 195; Mattinson & Cherry Reference Mattinson and Cherry2013). The mine's principal silver and lead source was in the northern Pennines on Alston Moor, near Nenthead, and Pipe roll evidence and surviving coinage suggest that operations expanded considerably under Henry. Opinions have differed on the importance of silver from the mine of Carlisle to overall coinage supply in later twelfth-century England, with major and lesser contributions suggested (see Claughton Reference Claughton2003; Allen Reference Allen2011). Erzgebirge silver would certainly have arrived via trade in commodities such as English wool and tin (Bartlett Reference Bartlett2000: 367–68). The Carlisle mine, however, was unquestionably the largest indigenous supplier of silver between 1158 and 1216, and a desire for increased silver extraction from larger quantities of its low-grade ore would have produced much larger quantities of both lead aerosol and metal as by-products.
The establishment of potential proxies for Peak District production is more complex, as they could be hidden under different farm payment labels. Between the 1150s and early 1200s, only lead production is recorded in the Pipe rolls. Most of the mining/smelting seems to have taken place within the Wapentake (administrative territory) of Wirksworth in the Low Peak. Farm payments for the ‘mines of Derbyshire’ were returned from 1156–1158, and for the ‘mine of the Peak’ in 1172. Cart-loads of lead from Derbyshire are listed between 1172 and 1178, again presumably from Wirksworth Wapentake, as High Peak cart-load production, administered from Castleton, was specifically differentiated (e.g. in 1188; Figure 6 & OSM 5).
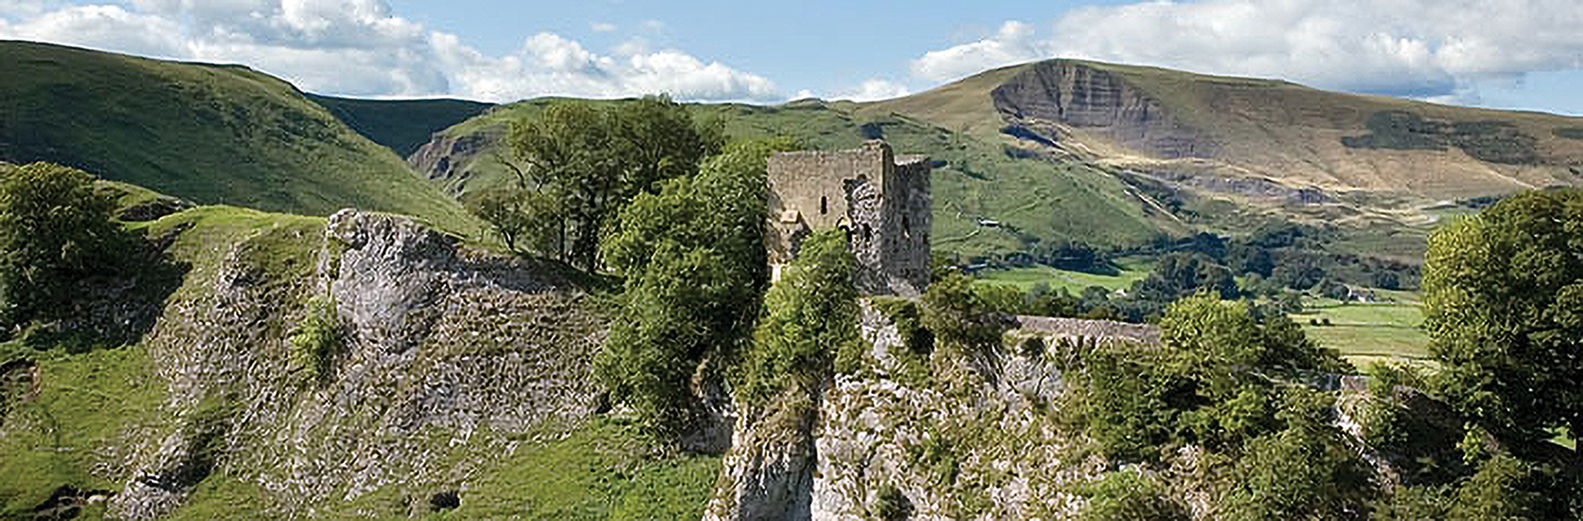
Figure 6. Peveril Castle, Castleton (Derbyshire)—the focal point of the High Peak ore-field (photograph courtesy of the Peak District National Park).
From 1169 onwards, regular farm payments were made by the land-holders of Wirksworth Wapentake (see OSM 5). According to the customary rights of lead mining in Derbyshire, administered from Wirksworth and first written down in 1288, anyone could mine for lead, but they paid every thirteenth ‘dish’ of ore to landowners/farm holders (Rieuwerts Reference Rieuwerts1988: 15). The paramount social organisation of medieval lead-mining across England was for free or tenant farmers to mine and smelt lead in the summer months, between the two harvests of winter and spring crops, with ore renders and cash payments in coin made to farm-holders (Blanchard Reference Blanchard1972). Although the latter payments were generated predominantly from trade in lead, which could create a slight delay between mining/smelting and generation of silver coin, the importance of lead-related income for peasant-farmer economies kept delays minimal (Blanchard Reference Blanchard1972: 99–101; Latimer Reference Latimer and Church1999). Given the importance of lead in Wirksworth Wapentake, it seems logical to suggest that levels of lead production may be reflected in the collective farm payments made for the Wapentake. Hence, these payments, and those of the mines of Derbyshire, the mine of the Peak, and High Peak cart-loads, were quantified together under ‘Wirksworth Wapentake’, as a proxy for Peak District production.
To attempt an overall proxy representation of lead production from 1167–1216, Figure 7 combines the yearly cart-load totals of lead from all British mines and farm payments in silver from Carlisle and Wirksworth Wapentake from 1167–1216. These data are plotted alongside the CG yearly mean lead-pollution record, and reflect the year when farm payments and cart-loads were sent to their destinations. The payments for 1182 and 1183 from Carlisle were both recorded in 1183 (see OSM 4), but have been plotted separately in their respective years. When large cart-load shipments were recorded in a single year (in lieu of farm payments for one or more years), the totals have been averaged over the years of production: in 1180–1181, for cart-loads from all British mines and for Carlisle cart-loads; and from 1208–1211 for Durham cart-loads. Indeed, production for Durham is explicitly identified in the 1211 roll (see OSM 8–9). There were no ice-core measurements for 1171, as the core was cut at that point for transport, and no Pipe rolls survive for 1213 and 1216. Mid-point proxies between values from adjacent years were therefore allocated at these points.
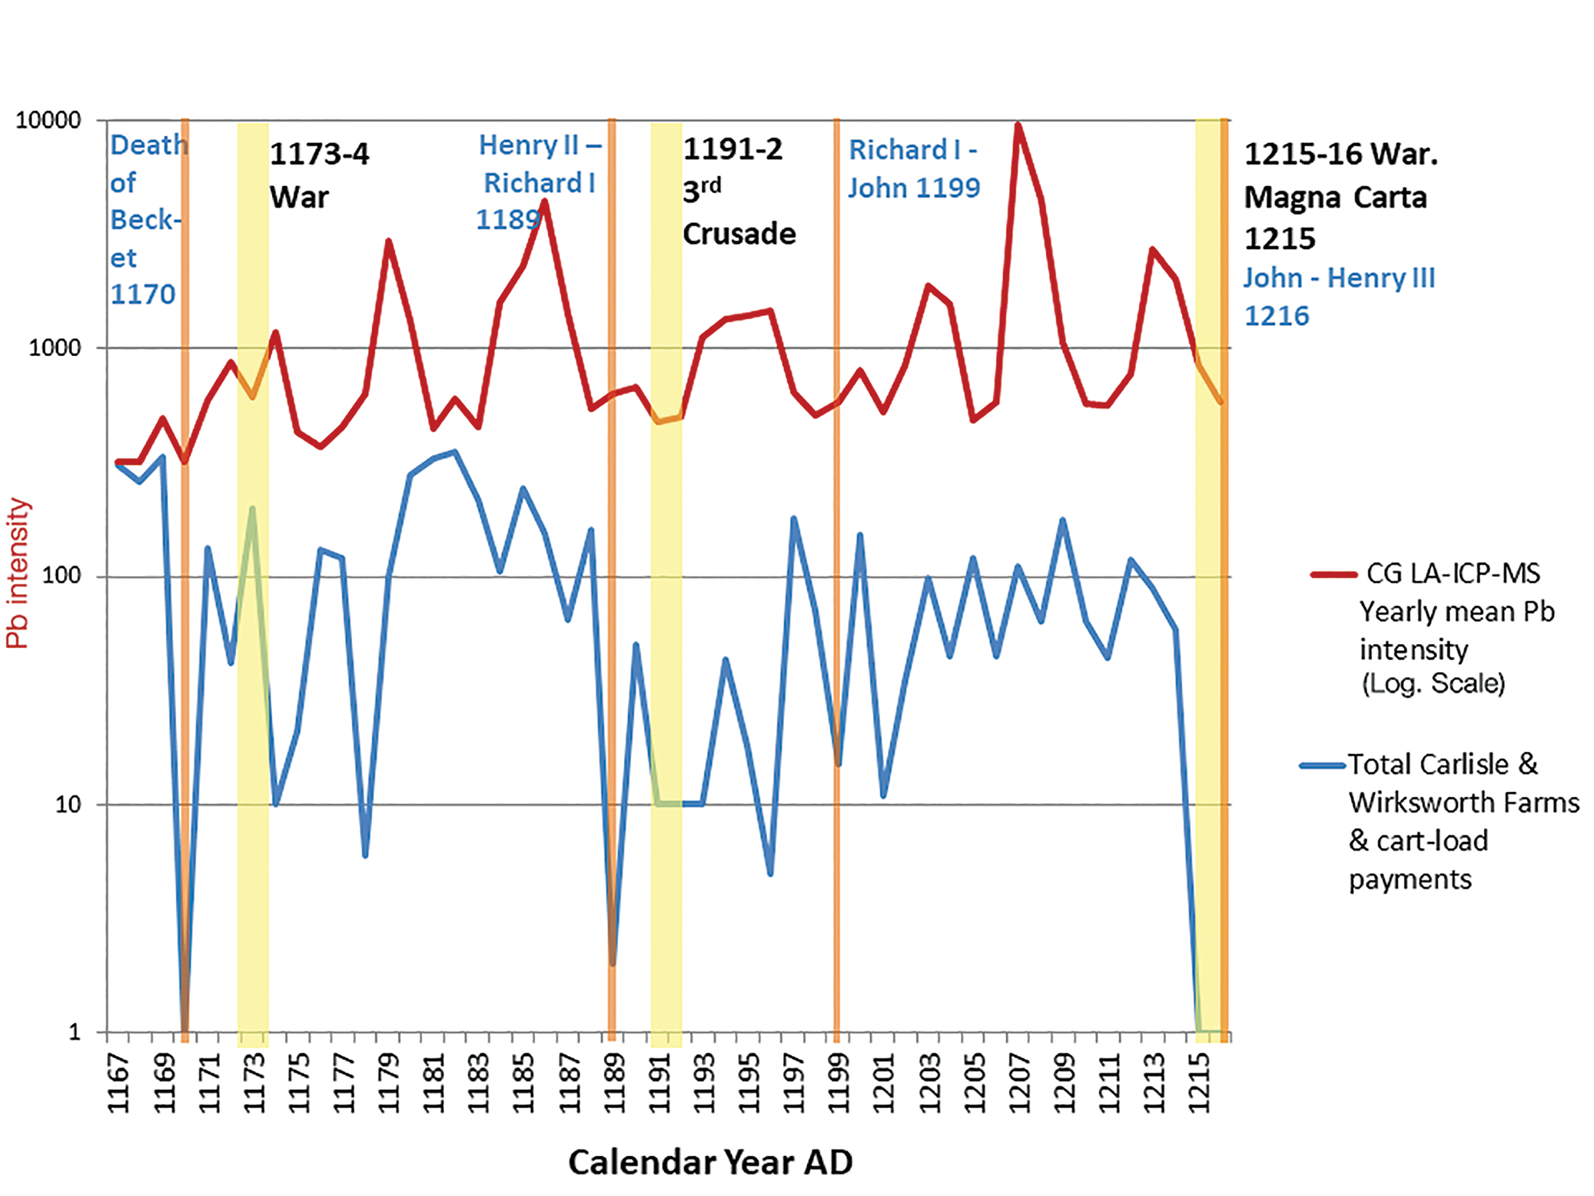
Figure 7. A proxy for British lead production, AD 1167–1216: combined totals of farm payments for the mine of Carlisle and Wirksworth Wapentake and cart-loads from all mines per year, and the Colle Gnifetti yearly lead record (figure by C. Loveluck & A. More).
Figure 8a–b shows the combined annual farm payments from Carlisle and Wirksworth and total cart-loads separately. Figure 9a–b shows the individual trends from the mine of Carlisle and Wirksworth Wapentake.
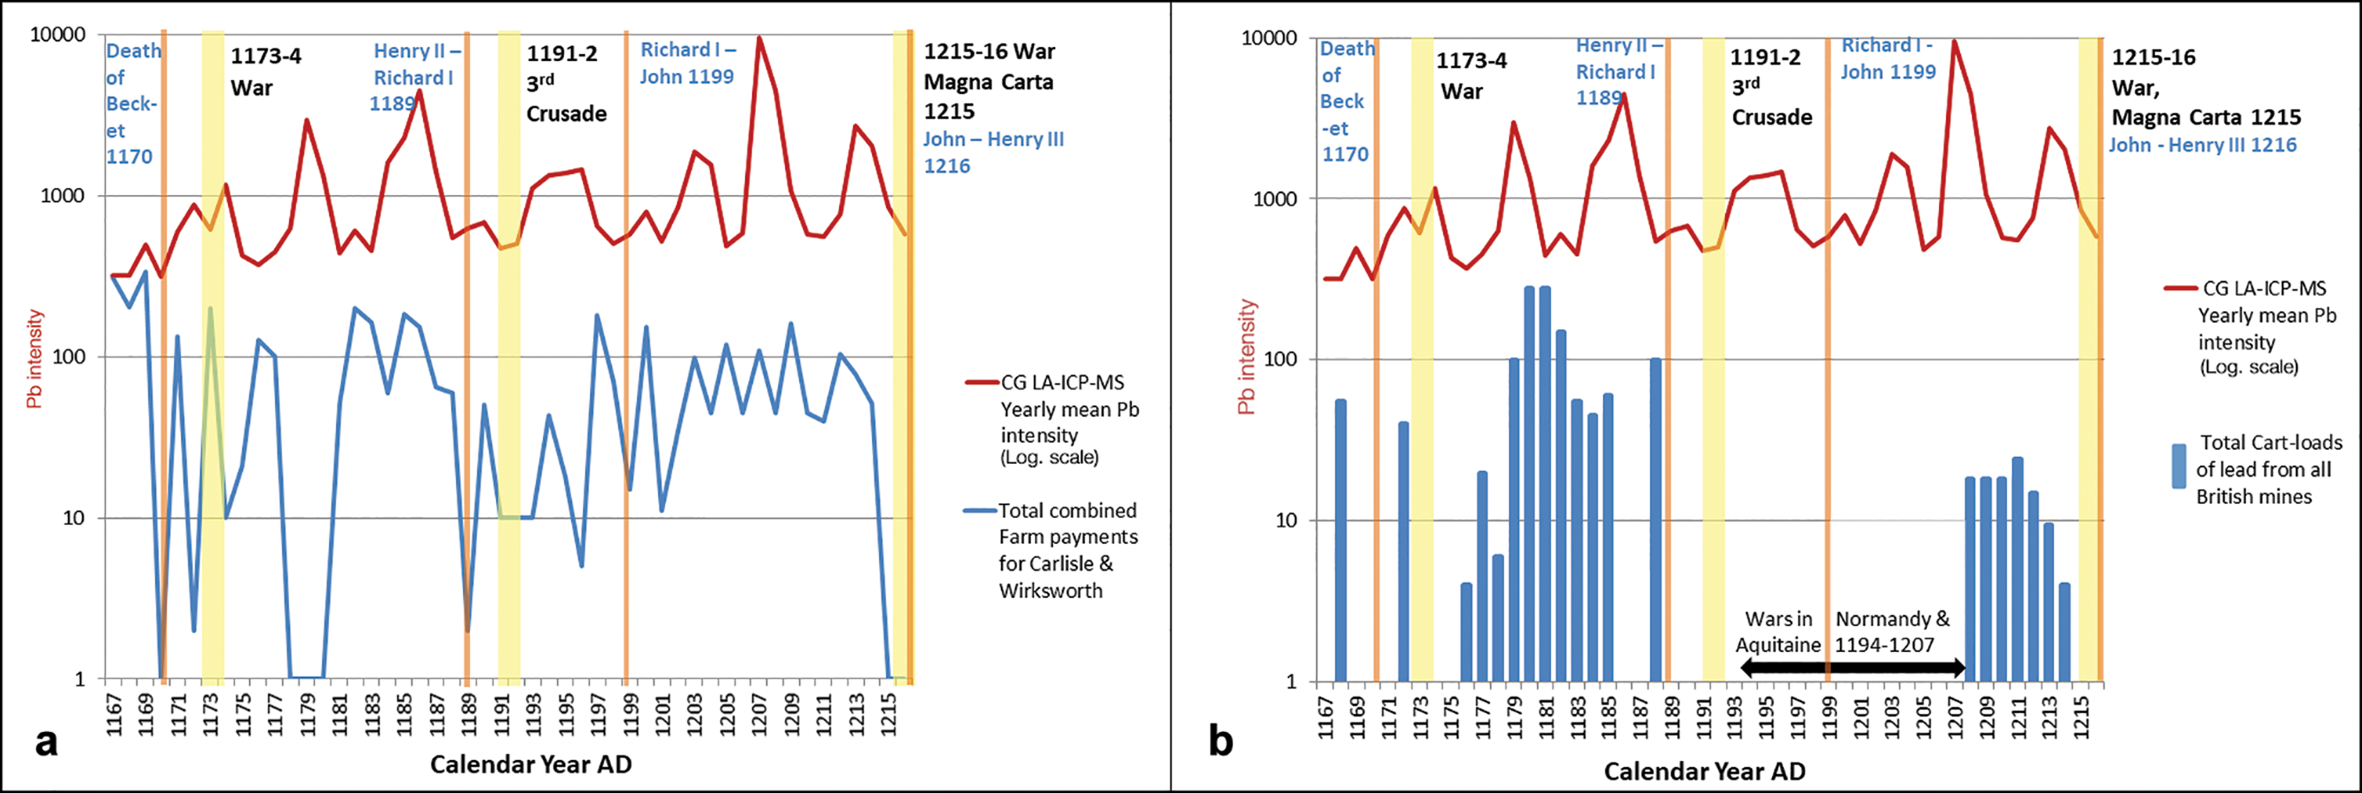
Figure 8. a) Sum of farm payments of the mine of Carlisle and Wirksworth Wapentake combined; b) total production of lead cart-loads per year, and the Colle Gnifetti yearly lead record, AD 1167–1216 (figure by C. Loveluck & A. More).
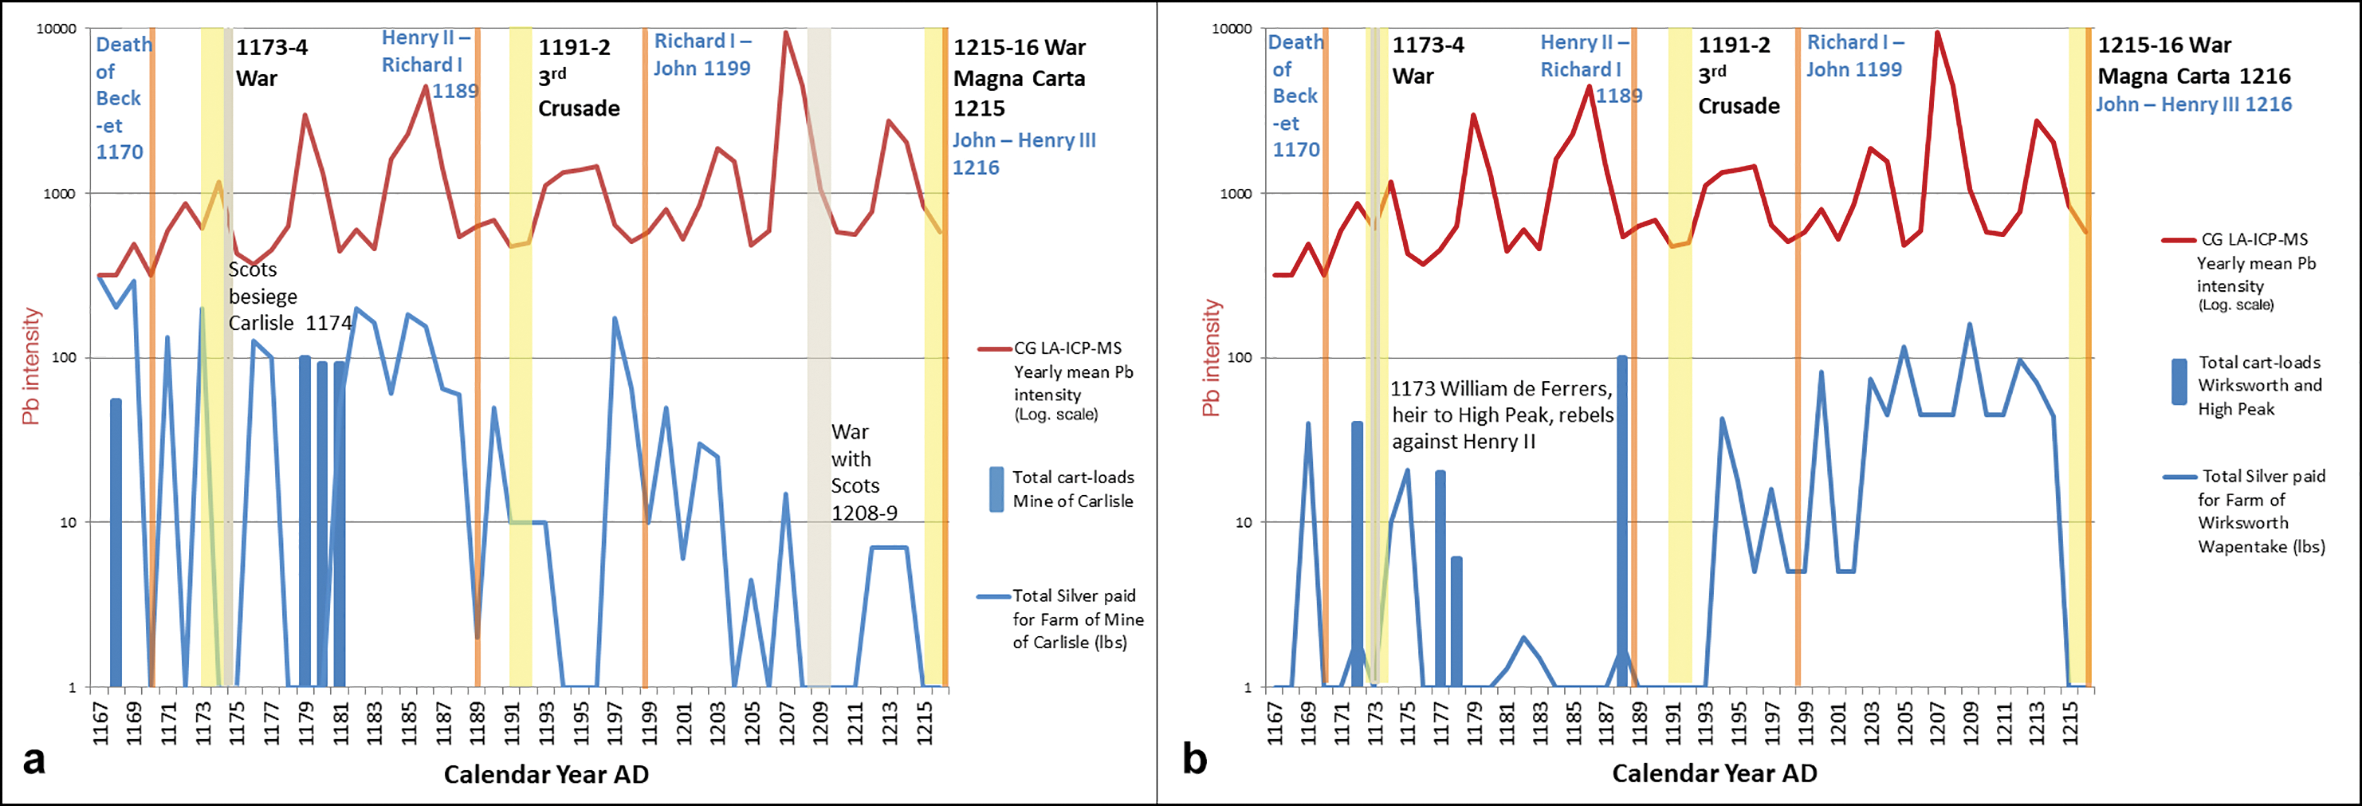
Figure 9. Farm payments and cart-loads, AD 1167–1216, from the mine of Carlisle (a) and Wirksworth Wapentake (b), alongside the Colle Gnifetti yearly lead record (figure by C. Loveluck & A. More).
Statistical correlations are inappropriate for this type of interdisciplinary study. This is because of the comparison of combined quantified totals of raw numbers from very different types of data (‘tower pounds’ of silver and ‘tons’ of lead) against mean average totals of 100–102 lead-intensity readings per year, and the occasional missing and combined records. Instead, we use a qualitative comparative approach, employed previously for comparing volcanic eruption events to records of cold episodes in textual sources (Ludlow et al. Reference Ludlow2013), and for comparing temperature and precipitation proxies from dendro-chronological data with annual historical records (Huhtamaa Reference Huhtamaa2015: 570–75). Unlike with scatter-plot correlative analysis, this comparative approach takes into account the different forms of data and the influences at work on them. It has been the standard approach for recent studies comparing ice-core pollution studies from Alpine and Greenland glaciers with historical and archaeological records (McConnell et al. Reference McConnell2019; Preunkert et al. Reference Preunkert2019). Our comparison of the similarity in rises and falls (peaks and troughs) in the CG lead record, farm payments and cart-loads on a yearly basis between AD 1167 and 1216 (see OSM 10) shows an 89 per cent match between British lead production and the CG pollution record, with individual similarities of 72 per cent with Wirksworth and 57 per cent with Carlisle (see OSM 10a).
Notably, falls in pollution coincide with major political changes in Britain (Figure 7). Troughs in lead deposition, for example, correspond to the deaths and successions of Angevin monarchs, from Henry II to Richard I the Lionheart in 1189, Richard to John in 1199, and John to Henry III in 1216. The lack of royal demand during interregna and occasional uncertainty over succession resulted in reduced production and minimal farm payments in those years. Sizable payments were made in 1190 and 1200, once the successions were secure, and these payments match increases in lead pollution. Lead deposition also fell at CG during political crises or royal absences. Examples include 1170, during Henry II's dispute with the Church, leading to the murder of Thomas Becket, Archbishop of Canterbury; 1173–1174, during civil war and conflict with Scotland (see Figure 9a–b); 1191–1192, when Richard the Lionheart was co-leading the third crusade; and 1215–1216, during the civil war when John signed Magna Carta, and the French invaded England.
The farm payments mirror the CG lead record during these political upheavals. No farm payment was made in 1170 for the mine of Carlisle, although it did pay a large sum in 1171. It also made no payments in 1174–1175, following the King of Scotlands invasion of Northumberland and the region around Carlisle in 1173 and 1174 (Figure 9a). Payments were also minimal in the years that Richard the Lionheart was away on crusade from 1191–1193, and ceased in 1215–1216, following Carlisle's annexation by the Scots (Carpenter Reference Carpenter2003). Wirksworth farm payments were also minimal from 1196–1199, when Richard was at war in Normandy; and no payments were made during the civil war and French invasion of 1215–1216 (Figure 9b).
The mine of Carlisle made larger annual farm payments during the reign of Henry II, although they had declined by the reign of John. Wirksworth payments were generally smaller until the reign of Richard (1190s), but by the reign of John, they were consistently higher than those of Carlisle. This suggests that the mine of Carlisle was the largest consistent lead and silver producer between the mid 1160s and 1190s, while the Peak District became the paramount producer by the mid 1190s. Surviving records of the Tideslow mine in the Peak District reflect this trend, with annual production levels in 1195 double those of the period from 1216–1249 (Rieuwerts Reference Rieuwerts1988: 16; Ford & Rieuwerts Reference Ford and Rieuwerts2000: 20). CG lead pollution seems to reflect the combined lead production illustrated by both sets of farm payments, certainly from 1169 onwards (Figure 8a), albeit with a closer correspondence with Wirksworth production overall. Farm payment peaks usually align directly with pollution increases, as in 1169, 1200 and 1214. During extended peaks in lead pollution, such as from 1193–1197, however, farm payment peaks were not always continuous. There was a Wirksworth farm peak in 1194–1195 and a Carlisle farm peak in 1197. For the 1207–1209 lead-pollution peak, there is a Carlisle farm peak in 1207 and a Wirksworth peak in 1209, as Carlisle payments stopped during warfare with Scotland in 1208–1209 (Figure 9a–b).
The cart-load data reflect lead requisitioned, often in lieu of farm payments, from all the mining regions from 1168 onwards. Cart-loads were frequently sent to their destinations at a moment that coincides with the end of CG lead-pollution spikes, or during a slight drop in pollution the following year (Figure 8b). This possibly reflects a time lag between mining/smelting and dispatch, due to limitations of productive capacity and transport infrastructure to meet large-scale demand. The cart-loads were ordered for major construction projects in England and France, sometimes beyond Angevin territories. Henry II, for example, sent cart-load shipments to Caen (Basse-Normandie) in 1168; to Clairvaux Abbey (Aube), from 1179–1188; to Winchester Palace (Hampshire) in 1172; to Woodstock Palace (Oxfordshire) in 1176; to Waltham Abbey (Essex) in 1181–1183; to Amesbury Abbey (Wiltshire) in 1181–1184; and to Gisors Castle (Vexin) in 1184 (see OSM 4–7). In 1176, Henry purchased lead worth 40 pounds for Grandmont Abbey (Limousin) from Carlisle. All the shipments to the Continent came from the mines of Carlisle, Yorkshire and High Peak, and were transported via the Rivers Tyne and Humber, and the North Sea, Channel and Biscay coasts to Rouen and La Rochelle (Figure 3; see OSM 4–6).
It is sometimes possible to specify the time lag between production and arrival at continental destinations. The surviving Norman Pipe rolls show that the 100 cart-loads produced at Carlisle in 1179 for Clairvaux Abbey had arrived in Rouen in 1180, for onward transport along the River Seine via Paris (Moss Reference Moss2004: 51). The 20 cart-loads sent from Yorkshire to Gisors Castle in 1184 are recorded as having arrived in Rouen in the same year (Moss Reference Moss2004: 79). The time lag between production and arrival of these shipments reflects the capacity of what could be produced and transported within one year. Although there were no cart-load shipments recorded in the reign of Richard, an unspecified quantity of lead was procured for castle construction, for example, at Château Gaillard (Eure) in 1197–1198 (Moss & Everard Reference Moss and Everard2016: 144–46). The CG pollution rise from 1194–1196, and the large farm payments from Wirksworth in 1194 and Carlisle in 1197, may reflect the production phase of the lead used in Richard's castle-building in Normandy (Figure 9a–b). Overall, however, it is notable that no cart-loads of lead are recorded as travelling from England to continental Europe during the wars of 1173–1174, 1194–1199 and 1203–1207 (Figure 8b).
The coin reforms of Henry II and John are not clearly reflected in the CG lead-pollution record, or in the lead-production proxies from the Pipe rolls. Henry's reforms in 1158–1159, 1180–1182 and 1188 (Allen Reference Allen, Harper-Bill and Vincent2007; Bolton Reference Bolton2012: 146–47) would have involved melting down old coinage and re-striking new currency, releasing lead-aerosol pollution. The 1158–1159 and 1188 reforms are not reflected at CG, while the 1180–1182 reform might have contributed to the 1180–1181 lead peak. This, however, also coincides with Henry's period of maximum acquisition of metal for construction. John conducted a re-coinage from 1205–1207 (Allen Reference Allen2011: 117), but, again, this is not clearly reflected in the CG core. All of these examples suggest that the correspondence between the CG lead record and the English Pipe rolls predominantly reflects primary metal production and the linked effects of political events.
Conclusions
The correspondence between the CG lead-pollution profile and English lead production under the Angevin kings is striking. Detailed analysis of textual, archaeological and geo-archaeological records across Europe, together with analysis of atmospheric circulation, using Climate Reanalyzer™ and tephra, confirms Britain as the principal source of the lead pollution between c. 1167 and 1216. The 89 per cent correspondence between the CG lead record and annual British lead production recorded in the Pipe rolls, including markers for royal successions, wars and major construction projects, provides further historical anchors for the LA-ICP-MS-layer-counted chronology at CG, in addition to Saharan dust events, tephra and the 1349–1353 Black Death lead record that also had a British source. The interdisciplinary results presented in this study at annual resolution are much less likely to represent chance coincidence than pollution records from peat cores, ice cores with wider radiocarbon-dating errors, or ice-core pollution records not yet subjected to detailed analysis of pollution sourcing and atmospheric circulation incorporating tephra studies (see OSM 3).
The current study provides a unique insight into the relationship of the Angevin royal government to metal production and the wider economy in Britain and western France, at a critical moment for European state formation. The impact of political events, such as warfare, the deaths and successions of monarchs and disputes between Church and State, are all reflected in the CG glacier. The results illustrate with remarkable clarity the impact of political (in)stability and transport security on specialist commodity production and movement in one of Europe's most powerful political hegemonies during the later twelfth century.
Acknowledgements
This is contribution 13 of the ‘Historical Ice Core’ project funded by Arcadia (grants AC3862 & AC4190), a charitable fund of Lisbet Rausing and Peter Baldwin. We gratefully acknowledge their support. C.P.L. would like to thank the History Department and the Initiative for the Science of the Human Past at Harvard University, Dumbarton Oaks and the University of Nottingham. All ice-core analyses were conducted at the W.M. Keck Laser Ice Facility, Climate Change Institute, funded by the W.M. Keck foundation and the National Science Foundation (PLR-1042883, PLR-1203640, PLR-1142007). Thanks are also due to Solenn Troadec (for Figures 1, 3 & 4) and the Peak District National Park Authority (for Figure 6).
Supplementary material
To view supplementary material for this article, please visit https://doi.org/10.15184/aqy.2019.202


 Open access