


Introduction
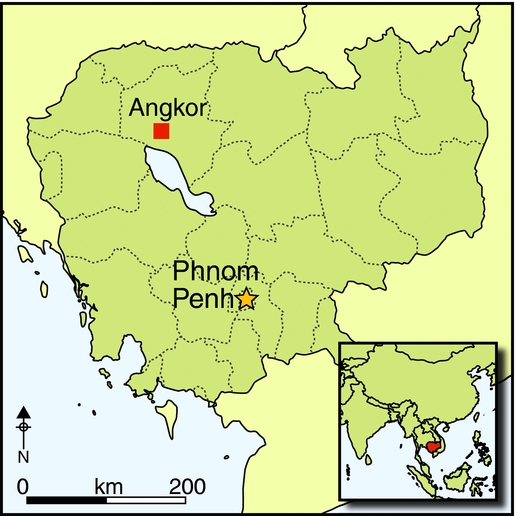
Over the previous 20 years, successive remote-sensing projects have offered crucial new insights into the archaeological landscape of medieval Angkor. Angkor is increasingly understood both as a collection of religious monuments and walled enclosures, and as a sprawling, low-density settlement complex, connected to a more densely populated urban core by a vast network of infrastructure (Pottier Reference Pottier1999; Evans Reference Evans2007; Evans et al. Reference Evans, Fletcher, Pottier, Chevance, Soutif, Suy, Sokrithy, Darith, Tina, Samnang, Cromarty, De Greef, Hanus, Bâty, Kuszinger, Shimoda and Boornazian2013b; Fletcher et al. Reference Fletcher, Evans, Pottier and Rachna2015: 1396–97) (Figure 1). The problem is that Angkorian period residential structures were largely constructed of lightweight, non-durable organic materials, and the ephemeral housing rotted away many centuries ago (Fletcher & Pottier Reference Fletcher and Pottier2002). The aerial perspective afforded by remote sensing, however, has enabled identification of fundamental elements of those lived-in spaces—ponds, occupation mounds, earthen roadways and canals—traces of which remain inscribed into the landscape. Over the last two decades, systematic and comprehensive topographical surveys have been undertaken using a range of different platforms and sensors. This work has transformed archaeological maps of the Greater Angkor area from the basic, schematic renderings common until the 1990s (Figure 2), into the richly detailed depictions of the archaeological landscape that are now a familiar sight in publications on Angkor (Pottier Reference Pottier, Dagens and Chambert-Loir2006). This work has provided an empirical basis for moving beyond culturally specific ‘sacred geographies’, rethinking the nature of enclosures and twelfth-century AD temples, and working towards a more consistent and rigorous spatio-temporal analysis of urban morphology. Perhaps most importantly, it has laid the groundwork for a renewed focus on broader human-environment interactions in medieval urban landscapes across southern Asia and beyond (Fletcher Reference Fletcher and Smith2012; Lieberman & Buckley Reference Lieberman and Buckley2012), and for comparisons with urban landscapes in other tropical forests; for example, the surveys of Caracol in Belize (Chase et al. Reference Chase, Chase, Awe, Weishampel, Iannone, Moyes, Yaeger, Brown, Shrestha and Carter2011, Reference Chase, Chase, Awe, Weishampel, Iannone, Moyes, Yaeger, Brown, Shrestha and Carter2014).

Figure 1. Overview map of Greater Angkor and its water catchment area, including sites mentioned in the text: inset top left, regional view; inset bottom left, detail of the central urban area; data courtesy of NASA-SRTM, JICA, Damian Evans and Christophe Pottier.

Figure 2. The development of archaeological maps of the area around Angkor Wat: top left, Lunet de Lajonquière 1909; top right, Trouvé and Marchal 1934–1935; centre left, l'École française d'Extrême-Orient (EFEO), Aviation Militaire and Service Géographique 1939; centre right, Boisselier Reference Boisselier1966; bottom left, Pottier Reference Pottier1999; bottom right, current analysis.
All of these maps of Angkor have, until now, suffered from one major shortcoming however: the lack of precision regarding archaeological topography obscured by dense vegetation cover. This has been a particularly vexing problem in the central monumental zone, in which the urban epicentre of medieval Angkor is now enshrouded by the protected forests of the Angkor Archaeological Park. In 2012, in an effort to remedy this situation, we initiated an airborne laser-scanning, or ‘LiDAR’, campaign with the Khmer Archaeology LiDAR Consortium over central Greater Angkor, which has allowed the virtual removal of vegetation cover and revealed the underlying spatial structure (Evans et al. Reference Evans, Fletcher and Suy2013a, Reference Evans, Fletcher, Pottier, Chevance, Soutif, Suy, Sokrithy, Darith, Tina, Samnang, Cromarty, De Greef, Hanus, Bâty, Kuszinger, Shimoda and Boornazian2013b, Reference Evans, Hanus, Fletcher and Traviglia2015). The 2012 LiDAR data of Angkor Wat provide several remarkable and surprising new insights into the temple and its surroundings. The settlement pattern can be mapped with great precision and clarity, revealing, for the first time, the spatial layout of a twelfth-century AD Khmer temple enclosure (Figure 3). This, in turn, allows preliminary analyses of population distribution and density, and modelling of the spatial and chronological trajectory of landscape engineering in and around Angkor Wat. The results cast further doubt on the traditional view of Angkor as a succession of formally planned, neatly bounded ‘temple cities’, indicating that the conventional model of urbanism in terms of compact and delimited rectilinear spaces is no longer compatible with the archaeological evidence.

Figure 3. A new interpretation of the archaeological landscape of Angkor Wat from LiDAR imagery: top, combined hillshade and digital elevation model derived from LiDAR ground returns; bottom, preliminary map of archaeological features visible in the LiDAR data (LiDAR courtesy of KALC).
Outcomes
LiDAR redefines the landscape of Angkor Wat at multiple scales, not only contextualising the temple within its urban and infrastructural context, but also clarifying various elements within the moated area and revealing micro-topographic patterns at a household scale that have never before been observed.
Vicinity of Angkor Wat
Numerous temples, oriented east-north-east, surround Angkor Wat (Figure 3), with the majority conforming, at least roughly, to the moated mound of smaller Angkorian temple sites (Stark et al. Reference Stark, Evans, Rachna, Piphal and Carter2015: 1442–44). Their orientation is different to that of Angkor Wat, with a distinct shift towards the north-east, suggesting that they date from a different period. In addition to this peripheral band of shrines, there is an extensive archaeological topography around the mountain-temple of Phnom Bakheng that extends to the south-east, wrapping around the northern and eastern sides of the moat of Angkor Wat. This topography again has a different orientation from Angkor Wat, being almost precisely cardinally aligned, and it is the third distinctive system of alignments in the area. Notable features of this system include the causeway emanating eastwards from the foot of Phnom Bakheng, and the ‘checkerboard’ pattern of occupation mounds along the northern side of Angkor Wat, partially mapped by Pottier two decades ago (Reference Pottier1999, Reference Pottier2000). This appears to be part of an older residential pattern, probably contemporary with Phnom Bakheng and therefore dating from the late ninth to early tenth centuries AD. Although the chronology remains imprecise at this point, it seems probable that the Angkor Wat complex was partially imposed upon a well-established, urban network with multiple stages of development.
The current inlet to the moat, in the north-east corner, brings water from the Siem Reap River. Archival research into the Journaux de Fouilles of l'École française d'Extrême-Orient reveals that this structure was constructed in 1916. In the past, however, Angkor Wat was associated with four inlets and one major outlet canal. The south-west outlet (often referred to as the ‘Angkor Wat Canal’) that flows to the lake has long been recognised, and was mapped in detail by Pottier (Reference Pottier1999) (Figures 2 & 3). Along the north bank are three inlet canals, one of which connects to the Angkor Thom moat. In the north-east, a canal has long been known that runs north-east to south-west; it was originally thought to flow into the Siem Reap River and date from the late twelfth century AD. A possible reading of the LiDAR data, however, is that the line of the canal crosses the Siem Reap river channel and is cut by the river (Figure 4). On the west bank of the Siem Reap River, the canal can be seen to go around the northern, western and eastern edges of Angkor Wat's eastern residential extension (see below for a discussion of this feature) and terminate near the eastern axial road, flowing into the moat of Angkor Wat. Marchal and Trouvé arrived at a similar conclusion in the 1930s, based on their survey work, and noted the existence of a possible inlet to the moat exactly at this point (Figure 4). The eastern causeway that divides the moat into northern and southern halves has been a source of uncertainty for many years (Christophe Pottier pers. comm.). A canal runs along its length that now debouches into both halves of the moat. Whether this was originally the case is unknown, but we now need to consider that the causeway canal was somehow related to the large feeder canal from the north-east. What is very striking is that the LiDAR data show both that the Siem Reap River cuts through numerous features east of Angkor Wat and also that the old canal was cut off and blocked (Figures 4 & 5). The Siem Reap River channel clearly postdates the initial layoutof Angkor Wat and its original water supply, and it cannot therefore be considered as an original feature of the arrangement of central Angkor. Instead, the river channel becomes an addition, as a major drainage canal, after the early-to-mid twelfth century AD. How much later is not immediately apparent from the LiDAR.

Figure 4. Detail of the area immediately to the east of Angkor Wat showing hydraulic features.
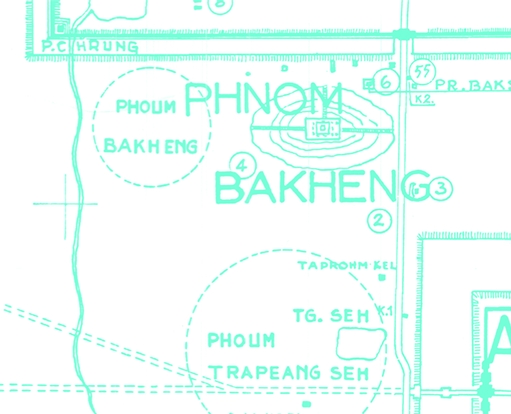
Figure 5. Detail of the area immediately to the east of Angkor Wat from the map created by Trouvé and Marchal in 1934–1935.
Grid and pond residences
Within the moated enclosure, it is now apparent that the initial indications of a pattern of ponds and occupation mounds previously analysed in the north-east corner in the 2010 field season (see Stark et al. Reference Stark, Evans, Rachna, Piphal and Carter2015: 1447–48) stretched across all four quadrants of the fourth enclosure in the original design (Figure 6). The only open space within the moat appears to flank the western causeway, where the two ‘libraries’ stand. Close to the cruciform entrance pavilion (or gopura) to the west is an area with a complex sequence of successive structures dating from the twelfth-century construction of Angkor Wat to the eighteenth and nineteenth centuries AD (see Sonnemann et al. Reference Sonnemann, O'Reilly, Rachna, Fletcher and Pottier2015: 1425 & 1429), a situation that is complicated by a network of roadways installed in the 1950s and 1960s. Otherwise, traces of the original grid are apparent almost everywhere; the initial pattern emerges even within the north-west corner, despite extensive recent modifications to the ground surface in this area. A series of causeways at Angkor Wat were already inferred from the positioning of gopura, gates and cruciform terraces. Now it is clear however that there is a smaller grid of narrower pathways forming rectangular spaces or ‘blocks’, within which is a consistent pattern of ponds. The blocks are generally square, with dimensions of 100 × 100m, with most blocks containing four occupation mounds and an excavated pond immediately to the north-east of each of those mounds. The overall pattern of blocks is far better preserved in Beng Mealea (Figure 7), another temple of approximately the same period as Angkor Wat, although the pattern of mounds and ponds within each block at Beng Mealea is more varied than at Angkor Wat.

Figure 6. Detail of the archaeological landscape inside the moat and the fourth enclosure of Angkor Wat from LiDAR imagery: top, combined hillshade and digital elevation model derived from LiDAR ground returns; bottom, preliminary map of archaeological features visible in the LiDAR data (LiDAR courtesy of KALC).

Figure 7. The patterning of space inside the moat and outer wall of the twelfth-century AD temple of Beng Mealea, visible in a combined hillshade and digital elevation model derived from LiDAR ground returns (LiDAR courtesy of KALC).
Given the remarkable consistency of this intramural grid, a calculation of the number of ponds can be made, even if parts of the pattern are obscured. This is of great significance for estimating the relative and, potentially, the absolute size of the populations that lived within the enclosures of each of the major temples of Angkor. Ta Prohm and Beng Mealea, for example, had about half as many ponds as Angkor Wat, although of more varied sizes (Evans et al. Reference Evans, Fletcher, Pottier, Chevance, Soutif, Suy, Sokrithy, Darith, Tina, Samnang, Cromarty, De Greef, Hanus, Bâty, Kuszinger, Shimoda and Boornazian2013b). Even a maximum estimate of the Ta Prohm residential population is only 1800–2000, based on its 125–130 ponds and Zhou Daguan's observation that one to three “families” (estimated at five people each) shared a pond in central Angkor (Zhou trans. Reference Zhou and Harris2007: 80). This figure is roughly equivalent to the total population of teaching staff and students associated with the shrine or some portion of its administrative staff, as detailed in the Ta Prohm inscription (Cœdès Reference Cœdès1906) and consistent with the associated statement that the work force of 12 640 people included those who live within the enclosure (Kapur & Sahai Reference Kapur and Sahai2007: 21)—in other words, it did not contain all of them, contrary to numerous comments and repetitions (see Glaize Reference Glaize1993: 183). Some estimate of the relative size of the staff of Angkor Wat can now be made, as the orderly grid of the main enclosure of Angkor Wat allows an estimate of about 250–300 ponds, representing residential facilities for more than twice as many people as in Ta Prohm—a maximum of 4500 people. If the ratio of the number of residents to the total number of staff in the enclosure remained roughly consistent throughout the twelfth century, then the total work force of Angkor Wat was more than twice that of Ta Prohm—that is to say, about 25 000 people in total. The Ta Prohm inscription also tells us that 66 625 people in an extended economic catchment were engaged in supplying the temple, i.e. an approximately 5:1 ratio between ‘suppliers’ in the countryside and ‘staff’ engaged directly in service. Again assuming a roughly consistent ratio, the inference is that Angkor Wat required a support population of more than 125 000 people. Until greater clarity can be brought to bear on the issue of exactly how many people lived on mounds next to ponds through a process of household archaeology (see Stark et al. Reference Stark, Evans, Rachna, Piphal and Carter2015: 1446–47), these figures must remain very preliminary in nature. These calculations illustrate, however, how LiDAR not only helps to clarify the tremendous scale of the Angkor Wat complex, but also reinforces the point that these temples were part of an immense economic machine.
Abutting the eastern side of the moat of Angkor Wat, there is another distinct enclosure bisected by the temple's eastern axial road, containing rows of ponds and mounds (Figures 3 & 4). The north–south dimensions of that external enclosure are almost the same as the north–south dimensions of the area enclosed by the moat, and both share the same idiosyncratic off-cardinal orientation, suggesting that the external, eastern enclosure was part of the basic design of the Angkor Wat complex. There are traces of a formal grid within the eastern external enclosure; the spatial patterning of the northern half corresponds roughly with the mound-and-pond grid inside the moated precinct, while the southern half consists of an ordered arrangement of mounds without ponds but perhaps in a ‘block’ formation. The eastern external enclosure is rather different from the layout within the moated precinct, suggesting a different function or perhaps a different residential demographic, and discussed in the paper by Stark et al. (Reference Stark, Evans, Rachna, Piphal and Carter2015: 1445 & 1450–51). As Trouvé and Marchal proposed in the 1930s (Figure 5), the eastern side of the northern half of that enclosure may be the feeder canal to the moat, turning south from its north-east to south-west course. There is more structured archaeological topography to the south but the overall pattern is obscure. In the area to the south-east of the south-east corner of the Angkor Wat moat, the early twelfth-century AD configuration has been dramatically altered by subsequent hydraulic engineering (see below).
Unique features
The most striking LiDAR-related discovery associated with Angkor Wat—perhaps within the whole 2012 LiDAR survey—is a remarkable topography immediately to the south of the moat. For want of a better term, these features are referred to as ‘rectilinear spirals’ or ‘rectilinear coils’. In the original configuration there may have been four major blocks within this ensemble, each subdivided into four minor sectors containing distinctive geometric patterns. The two most intact, in the north-east, vaguely resemble rectilinear, orthogonal coils (Figure 8). Here again, the idiosyncratic off-cardinal orientation and precise alignment with the moat strongly indicate that the overall ensemble is of early twelfth-century AD origin and contemporaneous with the main temple. The LiDAR data also make clear that the large, L-shaped canal commencing outside the south-east corner of the West Baray—designated CP807 by Pottier (Reference Pottier2000) and identified by him as later than Angkor Wat—destroyed the central part of this landscape.

Figure 8. Detail of the archaeological landscape south of the moat of Angkor Wat from LiDAR imagery: top, combined hillshade and digital elevation model derived from LiDAR ground returns; bottom, preliminary map of archaeological features visible in the LiDAR data (LiDAR courtesy of KALC).
Modern housing development is beginning to encroach on these features in both the north-west and south-east corners, and has partly obscured them (Figure 3). Nonetheless, it is possible to reconstruct the pattern of ‘spirals’, except where they have been destroyed by the CP807 canal. Generally, the features are composed of linear banks 18m in width, separated by 12m-wide channels. Several ponds of 100 × 60m appear within the pattern, including in the centre of each major sector (and therefore at the nexus of four ‘spirals’). The pattern of the northern ‘spirals’ is distinctly different from that of the southernmost block, which seems to be less ‘coil-like’ and resembles an array of smaller banks.
A comprehensive pedestrian survey of the spiral features was undertaken in the dry season of 2012–2013. The undulations indicated by the LiDAR were clearly visible on the surface. In such a heavily engineered environment it is difficult to ascertain exactly the ‘natural’ ground surface, but the difference in height between the highest point of a given bank and the lowest point of an adjacent channel is 1m, i.e. if the water in the channel was 0.5m in depth then the banks would be 0.5m in height above water level. The survey revealed that the ‘spirals’ are featureless and archaeologically sterile banks of sand (Figure 9). Even where there has been deep disturbance of the features in a roadside drainage ditch, no evidence for stone debris or ceramic material was apparent. This is highly unusual for any residential, artisanal or industrial context at Angkor, and suggests that the spirals were not used for any of these purposes.

Figure 9. Cross section of a road cutting excavated in one of the geometric banks to the south of Angkor Wat (© Roland Fletcher).
Quite how the spirals functioned is not at all clear. Although the existence of ponds suggest an association with water, which could theoretically have flowed through the system according to the natural north-east to south-west gradient of the area, the exact pattern of water distribution has yet to be clarified, akin to much else about these extraordinary structures. Most of the spirals, however, suggest a kind of closed system, in which water would not logically have flowed into, or around, the system of banks. Note also that the features in the area that are designed specifically for water flow or storage (e.g. the ponds), are far deeper than the ‘channels’ within the spirals. For the most part, although the channels would have seen a measure of internal flow during periods of heavy rainfall and initial flooding, and would have captured enough rainfall to form shallow bodies of standing water, the current evidence does not therefore seem to indicate a hydraulic system designed for the effective distribution of water. Yet an east-west canal, whose gradient could have carried water into the northernmost channel of the northern block of spirals can be seen that connects from near the south-east corner of the moat to the line of the river off to the east; the west end is obscured by a later bank. The east end is problematic as it connects to the current line of the Siem Reap River, which postdates Angkor Wat and its associated constructions. The indication is that at least one stretch of the current Siem Reap River may have been a functioning channel—perhaps an overspill channel for the north-east supply canal of Angkor Wat—well before the construction of the current Siem Reap River channel.
What can be said is that the scale, morphology and geometry of the coiled features are analogous in some respects to raised-field systems in pre-Columbian landscapes of the Americas, including systems that have been documented directly within urban contexts (Janusek & Kolata Reference Janusek and Kolata2004; Erickson Reference Erickson, Silverman and Isbell2008; Beach et al. Reference Beach, Luzzadder-Beach, Dunning, Jones, Lohse, Guderjan, Bozarth, Millspaugh and Bhattacharya2009; McKey et al. Reference McKey, Rostain, Iriarte, Glaser, Birk, Holst and Renard2010; Lombardo et al. Reference Lombardo, Canal-Beeby, Fehr and Veit2011; Renard et al. Reference Renard, Iriarte, Birk, Rostain, Glaser and McKey2012; Rojas Reference Rojas2012; Isendahl & Smith Reference Isendahl and Smith2013) and to similar fields that can be seen around Bangkok (Figure 10). One option is that they served to provide organics needed for temple ritual such as lotus (from the channels) and aromatics such as sandalwood trees (on the mounds). The raised-field proposition will have to await further investigations similar to those that have helped to clarify the nature of raised-field systems in the Americas (e.g. Turner & Harrison Reference Turner and Harrison2012). Another hypothesis, not entirely incompatible with the raised-field theory, is that the features are the remains of formal gardens, perhaps with some symbolic or ritual aspects to the patterning of space. If so, this would be one of the largest and most elaborate such designs in the world prior to the great palace gardens of eighteenth- and nineteenth-century Europe—bigger even than the palace gardens of China and the Islamic world (Carroll Reference Carroll2003).

Figure 10. Aerial view of patterned field systems in the Bang Kruai area near Bangkok, Thailand (image: Google Earth).
Worth noting also is that this feature may only have been functional for a very brief period of time, if at all. It was cut through by the huge L-shaped dyke (CP807) that connected to the West Baray, a major water storage device until the late twelfth or perhaps thirteenth century AD (Penny et al. Reference Penny, Pottier, Kummu, Fletcher, Zoppi and Somaneath2007; Day et al. Reference Day, Hodell, Brenner, Chapman, Curtis, Kenney, Kolata and Peterson2012), unequivocally supporting Pottier's (Reference Pottier2000) hypothesis that CP807 was built after the Angkor Wat period, although it does not add any further insight into the precise date of construction. Given that CP807 is aligned on Angkor Thom and therefore dates to the same period, and considering that Angkor Wat was constructed throughout the first half of the twelfth century AD, the spiral features would only have been functional for a brief period during the mid-to-late twelfth century AD, an obscure and apparently tumultuous period in the history of Angkor (Jacques & Lafond Reference Jacques and Lafond2007: 237). The spirals may never have been completed, and might never have become operational. The issue may therefore be with what the features were intended for, rather than their actual purpose.
Discussion
The LiDAR survey reveals that, in the Angkor area, the formal division of enclosed space into urban grids first occurs unambiguously at the temples of Angkor Wat and Beng Mealea (Figures 6 & 7), although we can identify a possible prototype for the grid system at the slightly earlier temple of Chau Srei Vibol (Evans et al. Reference Evans, Fletcher, Pottier, Chevance, Soutif, Suy, Sokrithy, Darith, Tina, Samnang, Cromarty, De Greef, Hanus, Bâty, Kuszinger, Shimoda and Boornazian2013b). The road-grid pattern therefore precedes, by at least half a century, the reorganisation within Angkor Thom. Furthermore, the LiDAR survey reveals that the grid pattern extends far beyond the 9km2 enclosed by the walls of Angkor Thom (Figure 11). This extended pattern beyond Angkor Thom is therefore from an earlier period because very few of the linear features in the extramural grid line up precisely with the linear features of the Jayavarman VII era inside Angkor Thom. The implication of the grid within Angkor Wat, therefore, is that this rigidly geometric patterning of space became a defining feature of the urban areas around the major temples sometime in the early twelfth century AD and is strongly associated with the reign of Suryavarman II, who was originally from the area around Phimai in present day Thailand. Was the grid pattern of Phimai a provincial Khmer settlement pattern that was introduced to the capital? Or was it a central metropolitan development that was exported to the provinces? The date of the grid in Phimai is crucial. The question of Indian influence in the layout of Angkor Thom needs to be pursued further, as the grid could have been originally a borrowing from the ‘Indian’ tradition in the early first millennium AD and then become entirely Khmer, or perhaps also had an additional phase of input from the Indian tradition in the twelfth century AD. Given that the narrow blocks of the grid within Angkor Thom also resemble the blocks in Chinese towns such as Suzhou, as can be seen in the famous Pingjiang map of AD 1229 (Skinner & Baker Reference Skinner and Baker1977; Xu Reference Xu2000), the issue becomes very complex.

Figure 11. The central urban grid of Angkor extending from Angkor Thom (top left) and Angkor Wat (bottom left) past the temples of Ta Prohm and Banteay Kdei (moated temple-sites on top right), visible in a combined hillshade and digital elevation model derived from LiDAR ground returns (LiDAR courtesy of KALC).
The results also reaffirm that LiDAR data, although limited to the surface of the landscape, provide a significant amount of chronological information, both relative (e.g. by illuminating the super-positioning of features) and absolute (by being able to link certain features logically and functionally to well-dated structures such as temples). For example, what can be inferred with a great deal of certainty is that the twelfth-century spiral features to the south of Angkor Wat originally consisted of multiple rows (probably four), one or more of which was subsequently destroyed by the construction of the feature known as CP807 that, until recently, was believed to be a late ninth-century AD ‘city wall’. The complex web of relative chronological and spatial relationships revealed by LiDAR can be anchored in time, both to absolute dates provided by inscriptions and scientific dating techniques, and also to narrow date ranges defined by art historical and architectural styles, thereby allowing us to develop more sophisticated models of the spatio-temporal development of Greater Angkor.
The other profound implication is that the Angkor Wat complex was far larger than has been envisaged during a century of investigation and research. The complex has three major components: the main moated enclosure; an eastern extension that was probably residential; and a southern extension whose form and pattern currently elude explanation. What is striking is that having recognised this overall pattern, an analogous pattern can be seen repeated, on a much larger scale some decades later, during the reign of Jayavarman VII: a central moated, enclosed area with a system of city blocks (Angkor Thom); an eastern urban extension (stretching to and beyond Ta Prohm); and a southern extension that incorporates an array of elements such as CP807 and Angkor Wat itself.
Conclusions
The 2012 LiDAR campaign unequivocally established the value of airborne laser scanning as a vital method of archaeological prospection, both locally and globally. The survey provides dramatic evidence of the ability of LiDAR to illuminate trace archaeological features across a diverse range of tropical environments, from dense forest to open rice fields. What should now seriously be envisaged throughout Southeast Asia is that vegetation must conceal significant amounts of detail in a large number of important cultural landscapes, including around monumental complexes that have been intensively studied for a century or more—a lesson we are also learning from sites such as Caracol in Central America. The lesson from Angkor Wat is that in heavily vegetated landscapes, archaeologists must be very cautious about what conclusions can be drawn in the absence of LiDAR data. Even within the remainder of the Greater Angkor area, beyond the LiDAR survey area, the conclusions must remain, for the time being, qualified. Many years of new research opportunities in Angkorian archaeology have been opened up as a result of the research planning of the 2012 campaign. In particular, given the wealth of new data on surface archaeology that is now available, the nature of Angkor Wat and its vicinity is due for a substantial reappraisal using ground-based methods. One of the great benefits of LiDAR data (and indeed remote sensing in general) in a vast cultural landscape such as Angkor is the ability to identify critically important nodes in the urban network where limited ground-based resources can be deployed to maximise the archaeological return on investment. Overall, the findings highlight the extraordinary capacity of technologies such as LiDAR to provide new insights into archaeological sites that have been the focus of intensive scholarly study for more than a century, suggesting that other conventional ideas about the spatial and temporal development of Angkor might be usefully reappraised.
Acknowledgements
Our sincere thanks go to the University of Sydney, and in particular to Martin King in Sydney and So Malay in Siem Reap; thanks are also due to the EFEO for support and assistance over many years. The authors extend their gratitude to the staff of P.T. McElhanney Indonesia for their contribution to the 2012 LiDAR acquisition, and acknowledge support and funding from the eight institutions of the Khmer Archaeology LiDAR Consortium: the APSARA National Authority, the University of Sydney, l'École française d'Extrême-Orient, Société Concessionaire d'Aéroport, the Hungarian Southeast Asian Research Institute, Japan-APSARA Safeguarding Angkor, the Archaeology and Development Foundation and the World Monuments Fund. We would like to thank Kasper Hanus for preparing preliminary images, Tim Thida for assistance in survey and mapping, and teams led by Miriam Stark and Chhay Rachna for undertaking ground verification, excavation and coring work in and around Angkor Wat. The work described here was generously supported by the Australian Research Council—ARC Discovery Grant DP 1092663, the National Geographic Research Committee, the Wenner-Gren Foundation and the Robert Christie Research Centre of the University of Sydney.


