


Introduction
Policy tools are instruments designed “to get people to do things that they […] might not have done otherwise” (Schneider & Ingram, Reference Schneider and Ingram1990: 513) and naturally play an important role in public administration. Traditionally, governments have had three types of policy tools at their disposal to influence citizens: carrots, sticks and sermons. Carrots refer to economic incentives, sticks to regulations and sermons to information (cf. Bemelmans-Videc et al., Reference Bemelmans-Videc, Rist and Vedung2011; Tummers, Reference Tummers2019). In recent years, a fourth type of policy tools has been introduced. Beginning as a concept named either asymmetric paternalism (Camerer et al., Reference Camerer, Issacharoff, Loewenstein, O'Donoghue and Rabin2003) or libertarian paternalism (Thaler & Sunstein, Reference Thaler and Sunstein2003), this fourth type of policy tool draws on findings from the behavioral sciences and is generally referred to as nudging, an umbrella term for psychologically informed techniques intended to alter people's behavior while maintaining their freedom of choice (Thaler & Sunstein, Reference Thaler and Sunstein2008). As applied to choices, some nudges are defaults, meaning that one from several choice options have been pre-set and comes into effect if no other choice is made. Nudges may also involve social norms, as in emphasizing the popularity of a particular choice over others. Alternatively, they can simply increase the decision maker's ease and convenience (Sunstein, Reference Sunstein2014).
Nudging has become popular among academics, policymakers and practitioners. It has been adopted in public administration in many countries (Whitehead et al., Reference Whitehead, Jones, Howell, Lilley and Pykett2014; OECD, 2017 Osman et al., Reference Osman, Radford, Lin, Gold, Nelson and Löfstedt2018) and has been especially embraced in the UK (Halpern, Reference Halpern2015; John, Reference John2018). In Canada, the Government of Ontario recently succeeded in increasing overdue tax payments using nudging (Robitaille et al., Reference Robitaille, House and Mazar2021). In the words of Nobel laureate Daniel Kahneman: “There is no overarching [nudge] theory. It is not big. It is interventions that cost essentially nothing and that achieve small but reliable results” (Nelson, Reference Nelson2015).
However, concerns have been raised with respect to its ethical implications, especially whether it constitutes an act of manipulation or not (Rebonato, Reference Rebonato2014). Its theoretical and empirical bases have also been questioned by some. Sugden (Reference Sugden2017) challenges the assumption of an inner economic man, whose preferences nudges would align behavior with, while Gigerenzer (Reference Gigerenzer2015) finds the nudge program based on a biased, overly negative reading of the judgment and decision making (JDM) literature.
Prior research of nudging in public administration
Previous research on nudging in public administration has taken two avenues. The first avenue compares the relative merits of nudging and traditional policy tools. Some argue that nudges are more cost-effective than carrots, sticks and sermons (Benartzi et al., Reference Benartzi, Beshears, Milkman, Sunstein, Thaler, Shankar, Tucker-Ray, Congdon and Galing2017). Others highlight how they all may complement each other, even though their underlying rationales are different (Loewenstein & Chater, Reference Loewenstein and Chater2017; but see Thaler, Reference Thaler2018).
Arguably, traditional and behavioral policy tools should be evaluated according to the same criteria, for example with respect to social and economic welfare (Weimer, Reference Weimer2020). Loewenstein and Chater (Reference Loewenstein and Chater2017) argue “that policymakers should take the concept of a ‘nudge’ not as encapsulating the role of behavioral economics in policy, but rather as a single concrete and powerful illustration of a much broader range of behaviorally informed policy tools” (p. 28).
The second research avenue investigates the support for nudging among the general public. This avenue of research has typically conducted surveys with population-representative samples in which respondents have been asked whether they endorse nudges aimed at specific policy goals, for example promoting healthier food in grocery stores and cafeterias in order to reduce obesity (Felsen et al., Reference Felsen, Castelo and Reiner2013; Hagman et al., Reference Hagman, Andersson, Västfjäll and Tinghög2015, Reference Hagman, Erlandsson, Dickert, Tinghög and Västfjäll2019; Jung & Mellers, Reference Jung and Mellers2016; Reisch & Sunstein, Reference Reisch and Sunstein2016; Petrescu et al., Reference Petrescu, Hollands, Couturier, Ng and Marteau2016; Reisch et al., Reference Reisch, Sunstein and Gwozdz2017 Sunstein et al., Reference Sunstein, Reisch and Rauber2018, Reference Sunstein, Reisch and Kaiser2019; Almqvist & Andersson, Reference Almqvist and Andersson2021).
Sunstein et al. (Reference Sunstein, Reisch and Rauber2018) argue that countries can be categorized into three groups according to their level of support for nudging: overwhelmingly pro-nudges nations (China and South Korea), principled pro-nudge nations (Australia, Brazil, Canada, France, Germany, Italy, Russia, South Africa, the UK and the US), and cautiously pro-nudge nations (Denmark, Hungary, Japan and Sweden). International differences in the public support for nudging have been suggested to depend on domestic political debates (Sunstein et al., Reference Sunstein, Reisch and Rauber2018; Loibl et al., Reference Loibl, Sunstein, Rauber and Reisch2018) and trust in public institutions (Sunstein et al., Reference Sunstein, Reisch and Kaiser2019). Besides those tentative explanations, prior research gives few reasons as to why the support for nudging differs between countries.
There are also empirical studies that have explored the individual factors that determine people's attitude towards nudging. In general, people tend to support nudges when they sympathize with their goals and identify with the choice architect (Tannenbaum et al., Reference Tannenbaum, Fox and Rogers2017). Studies have also shown that an individualistic societal view is negatively correlated with nudging support (Hagman et al., Reference Hagman, Andersson, Västfjäll and Tinghög2015; Jung & Mellers, Reference Jung and Mellers2016). Further evidence suggests that the approval of nudging is greatest among supporters of socialistic political parties, followed by liberal, and then conservative voters (Sunstein et al., Reference Sunstein, Reisch and Kaiser2019; Almqvist & Andersson, Reference Almqvist and Andersson2021).
A limitation of most prior studies on the public support of nudging is the lack of between-policy tool comparisons. Hagman et al. (Reference Hagman, Erlandsson, Dickert, Tinghög and Västfjäll2019) have, however, conducted an investigation, in which respondents’ attitudes towards nudging were studied as joint evaluations of default nudges presented with alternatives, where one of their experimental conditions featured legislation (i.e., sticks) as alternatives to the nudges. Their study showed the attitude towards nudges to be rather unsusceptible to them being compared with sticks.
Other than that the support for nudges has typically been studied in isolation rather than against other types of policy tools like taxes, subsidies, information and mandates. Such research designs do not provide survey respondents or experiment participants with alternatives to the nudges, which somewhat limits the conclusions that can be drawn from such studies.
Aims and contributions of the present article
The present article reports on evidence from a survey study aimed at comparing public attitudes towards traditional and behavioral policy tools as well as investigating some potential explanatory factors behind those attitudes. The survey is exploratory in the sense that the scarcity of previous research involving direct comparisons between nudges and alternative policy tools makes it difficult to postulate, a priori, expected outcomes of such comparisons and, thus formalized hypotheses. The article extends prior research on nudging as its design enables empirical comparisons of how the general public considers different policy tools with consistent policy goals. It differs from the previously described study by Hagman et al. (Reference Hagman, Erlandsson, Dickert, Tinghög and Västfjäll2019) in that it asks respondents for a series of separate (not joint) evaluations of a wider selection of policy tools.
The study also has many similarities with previously cited research. It relies on survey responses from a population-representative sample; a common design in research on nudging. In addition, it considers socio-demographics and ideological beliefs as determinants explaining people's attitudes towards policy tools. Besides gender, age and education, the study examines whether individualistic views explain the attitude towards nudging, as hypothesized in prior studies (Hagman et al., Reference Hagman, Andersson, Västfjäll and Tinghög2015; Jung & Mellers, Reference Jung and Mellers2016). All this while controlling for respondents’ attitudes to the respective policy goals, a known confounding factor (Tannenbaum et al., Reference Tannenbaum, Fox and Rogers2017). As an extra control question, the survey asks the respondents to rate the realism of the featuring policy tools and thus provides insights on whether their perceived realism also determines the general attitude towards them.
The article aims to make two empirical contributions. Firstly, it describes citizens’ attitude towards nudges and compares them to their attitude towards information, subsidies, taxes and mandates. As previously discussed, this design has rarely featured in prior research on nudging. Secondly, the article contributes to the few studies of socio-demographics and ideological beliefs that influence the attitude towards nudging, a gap highlighted in the literature (Loibl et al., Reference Loibl, Sunstein, Rauber and Reisch2018; Sunstein et al., Reference Sunstein, Reisch and Kaiser2019). The empirical contributions add to the public policy literature and the emerging research field of behavioral public administration. The article also makes a policy contribution, as – for any given policy goal – policymakers may consider several types of policy tools, traditional or behavioral (see also Tummers, Reference Tummers2019). Arguably, they must compare the tools not only in terms of relative effectiveness but also regarding public support. This article provides insights on how such comparisons may turn out.
Materials and methods
Participants
A Swedish marketing research company (Norstat) was instructed to distribute an online survey to its panellists. In all, 595 respondents (48% female) completed the survey. Standard exclusion criteria were applied (Meyvis & Van Osselaer Reference Meyvis and Van Osselear2018), resulting in the exclusion of 58 respondents (see the exclusion criteria in the subsection Data Quality and Reliability). Accordingly, the sample used for analyses consisted of responses from 537 (48% female) participants whose ages ranged from 18 to 70 years (M = 45.59, SD = 13.99). See Table 1 for the socio-demographics of the respondents.
Table 1. The socio-demographics of respondents (N = 537).
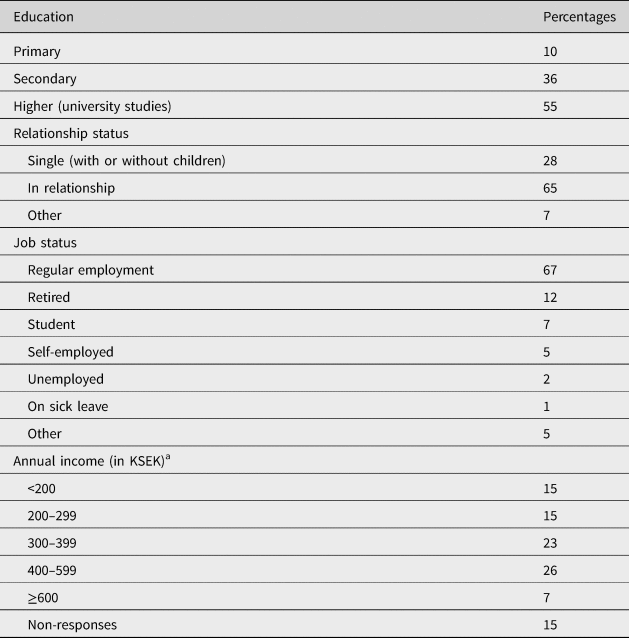
Notes: a1000 SEK ≈ 100 EUR.
Design
The questionnaire, in Swedish, was organized into nine blocks. Block 1 described the aim of the study and the expected completion time of the questionnaire. Blocks 2 through 6 were presented in a random order. All blocks had identical structures. The questionnaire prompted respondents to consider a policy goal and make a series of assessments concerning this goal, five different policy tools aimed to reach this goal, and the realism of the tools. Table 2 shows the items included in Blocks 2–6 (along with means and standard deviations, discussed in the Results section). Each block had a vignette reading “Suppose that the following argument has been put forward in the public debate”, followed by one of five specific policy goals: “For climate reasons, it would be desirable if more climate-friendly electricity sources were used” (Block 2); “For public health reasons, it would be desirable for Swedish children to eat more healthy food and less fast-food and candy” (Block 3); “For climate reasons, it would be desirable to reduce the Swedish public's airline traveling” (Block 4); “For economic and public health reasons, it would be desirable with further measures to mitigate the spread of COVID-19 in Sweden” (Block 5); and “For economic reasons, it would be desirable for Swedes to amortize their mortgages” (Block 6).
Table 2. Items in Blocks 2–6. Policy goals, policy tools and realism ratings. Means (SDs).
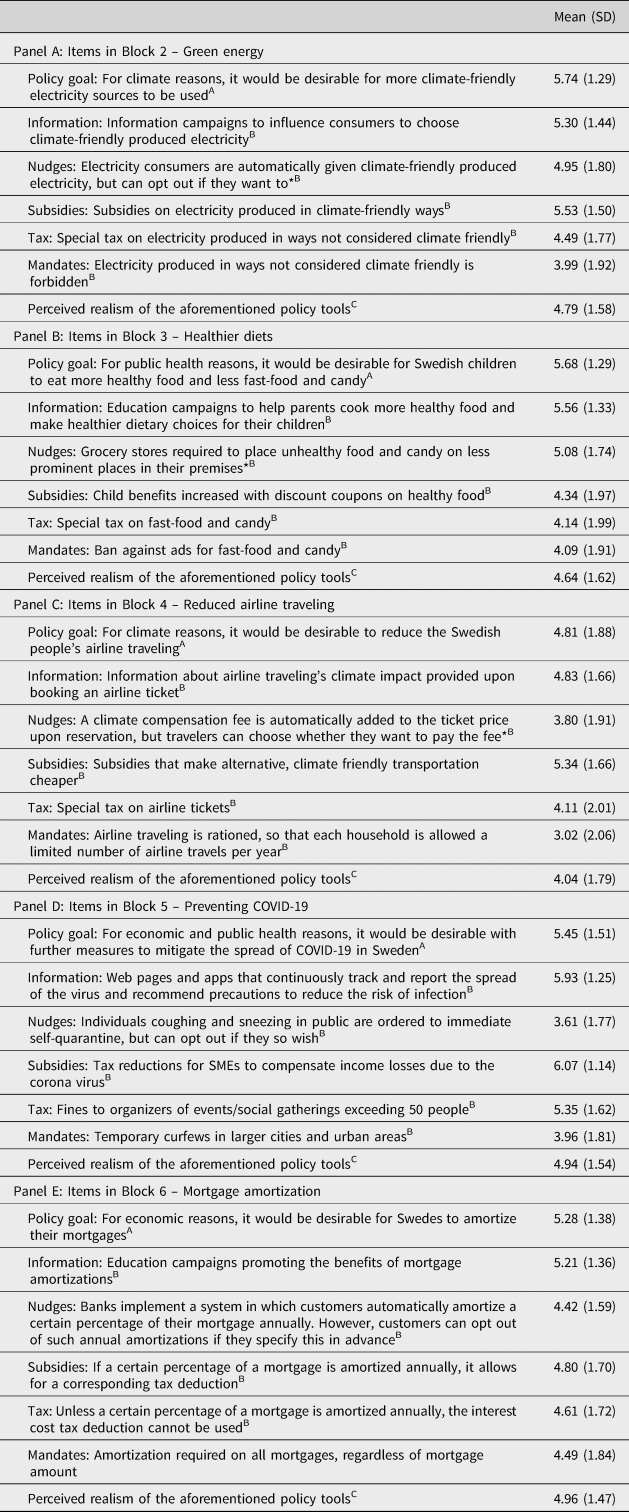
Note: Originally, the survey was in Swedish. Items with * were taken from Reisch and Sunstein (Reference Reisch and Sunstein2016). Items with A had response scale ranged from “Absolutely do not agree” (1) to “Absolutely agree” (7). Items with B had response scale ranged from “Very bad” (1) to “Very good” (7). Items with C had response scale ranged from “Very unrealistic” (1) to “Very realistic” (7).
For each policy goal, the respondents faced three questions. Firstly, they rated to what extent they agreed with the policy goal on a 7-point verbally anchored scale, ranging from “Disagree completely” (1) to “Agree completely” (7). Secondly, they were presented with five specific policy tools, one at the time, aimed to reach the described policy goal. Four tools were the traditional ways used in public administration to influence citizens, namely taxes, subsidies, information and mandates. That is, two carrots (taxes and subsidies), one sermon (information) and one stick (mandates), with taxes and subsidies representing two sides of the same coin; economic incentives. The remaining policy tools were different nudges, based on behavioral insights from the nudge literature. Specifically, three of the nudges used in the survey had featured in a prior study (Reisch & Sunstein, Reference Reisch and Sunstein2016) and were aimed at promoting the respective policy goals: healthier diets for children, green energy consumption and reduced airline traveling. Each policy tool was rated separately on a 7-point verbally anchored scale ranging from “Very bad” (1) to “Very good” (7). Thirdly, the respondents rated the policy tools’ realism on a 7-point verbally anchored response scale ranging from “Very unrealistic” (1) to “Very realistic” (7). Each block ended with a text entry allowing the respondents to add comments.
Block 7 included six items from the cultural cognition scale, measuring individualism (Kahan et al., Reference Kahan, Jenkins-Smith and Braman2011). Those items were: (1) “The government interferes far too much in our everyday lives”, (2) “It is not the government's business to try to protect people from themselves”, (3) “The government should stop telling people how to live their lives”, (4) “Sometimes the government needs to make laws that prevent people from hurting themselves”, (5) “The government should do more to advance society's goals, even if that means limiting the freedom and choices of individuals” and (6) “Government should put limits on the choices individuals can make so they don't get in the way of what's good for society”. The respondents rated to what extent they agreed with each statement on a 7-points verbally anchored scale ranging from “Absolutely not true” (1) to “Absolutely true” (7).
Block 8 asked respondents for their gender and age, to complement and double-check the information provided by the survey company. Block 9 contained five questions about the survey. Each was rated on a 5-points verbally anchored response scale ranging from “No absolutely not” (1) to “Yes, absolutely” (5). The first three questions asked whether the survey was meaningful, precisely worded and unbiased. As attention-checks (cf. Curran, Reference Curran2016), two control questions on the survey's content were also included (see the exclusion criteria under the subsection Data Quality and Reliability below). There was also a text entry, so the respondents could write additional comments.
Data screening and quality
The collected survey data were screened according to three a priori-determined exclusion criteria, resulting in 58 responses being excluded. Firstly, the 15 respondents who incorrectly answered the question whether the survey investigated opinions about public influence by the authorities were excluded. Secondly, screening was done for respondents who did not vary their responses and, thus, systematically answered all questions identically (e.g., persistently selecting the options corresponding to the scale value of 3 throughout the survey) were to be omitted. This criterion did not result in any exclusion. Thirdly, response time was used to screen out respondents who were outliers in terms of completion time. Specifically, the 19 (24) respondents who took less than 5 minutes (more than 2 h) to complete the survey were excluded.
Analyses of the responses to the questions of Block 11 indicate a survey instrument of satisfactory quality. About 87% of the respondents claimed that the survey was meaningful, and 89% and 76%, respectively, stated that the questions were clearly worded and unbiased. Out of the 56 registered text entries, 12 were positive towards the questionnaire, 6 were negative and the remaining 38 (mistypes included) were irrelevant or neutral.
Variables
The survey study was based on five different sets of variables or measurements. Firstly, agreement with the policy tool to be desirable was measured on five different 7-point scales ranging from “Disagree completely” (1) to “Agree completely” (7). Secondly, attitude towards different policy tool was measured on 25 separate 7-point scales with the endpoints “Very bad” (1) and “Very good” (7). Thirdly, realism in policy tools were evaluated on five different 7-point response scales ranging from “Very unrealistic” (1) to “Very realistic” (7). Fourthly, the propensity to have individualistic views was computed by averaging the responses to the aforementioned items of the cultural cognition scale. Note that responses to three items had to be reversed. The resulting measure had satisfactory reliability (α = 0.75) and ranged from 1 to 7, where a greater value suggests a greater degree of individualism (M = 3.83, SD = 1.05, 95% CI = 3.74, 3.92).Footnote 1 Finally, the article also explored the roles of gender, age and education in explaining attitudes to policy tools.
Results
Opinions about the policy goals
Recall that the survey featured five different policy goals: more green energy, healthier children's diets, reduced airline traveling, mitigated spread of COVID-19 and mortgage amortizations. Besides containing the wording of those goals, Table 2 reports that the mean desirability ratings of those goals varied from 4.81 (reducing airline traveling) to 5.74 (green energy). The ratings of the policy goals were positively correlated, ranging from very weak to moderate (0.07 < r < 0.50). Panel A of Figure 1 shows that the respondents viewed those policy goals to have different levels of desirability. A one-way repeated-measures ANOVA showed that the respondents rated the policy goals statistically significantly different (F (3, 2145) = 17.14, p < 0.001). To further evaluate the differences in the policy goals, ten paired sample t-tests were run. To counteract the problem with multiple comparisons, Bonferroni corrections were applied. Specifically, the alpha of 0.05 were divided by the number of policy goal comparisons (10), returning a p-value of 0.005 and a confidence interval of 99.5%. Panel B of Figure 1 describes the results of the paired sample t-tests and points to two observations. Three policy comparisons were perceived to be similarly desirable: (1) green energy vs healthier diets, (2) healthier diets vs preventing COVID-19 and (3) preventing COVID-19 vs mortgage amortizations. The remaining seven policy comparisons were found to have statistically significantly different (range of absolute M Differences = 0.64, 0.94, range of t(536) = 5.03, 12.95, p < 0.005) and small to medium effect sizes (0.17 < Cohen's d < 0.56).Footnote 2
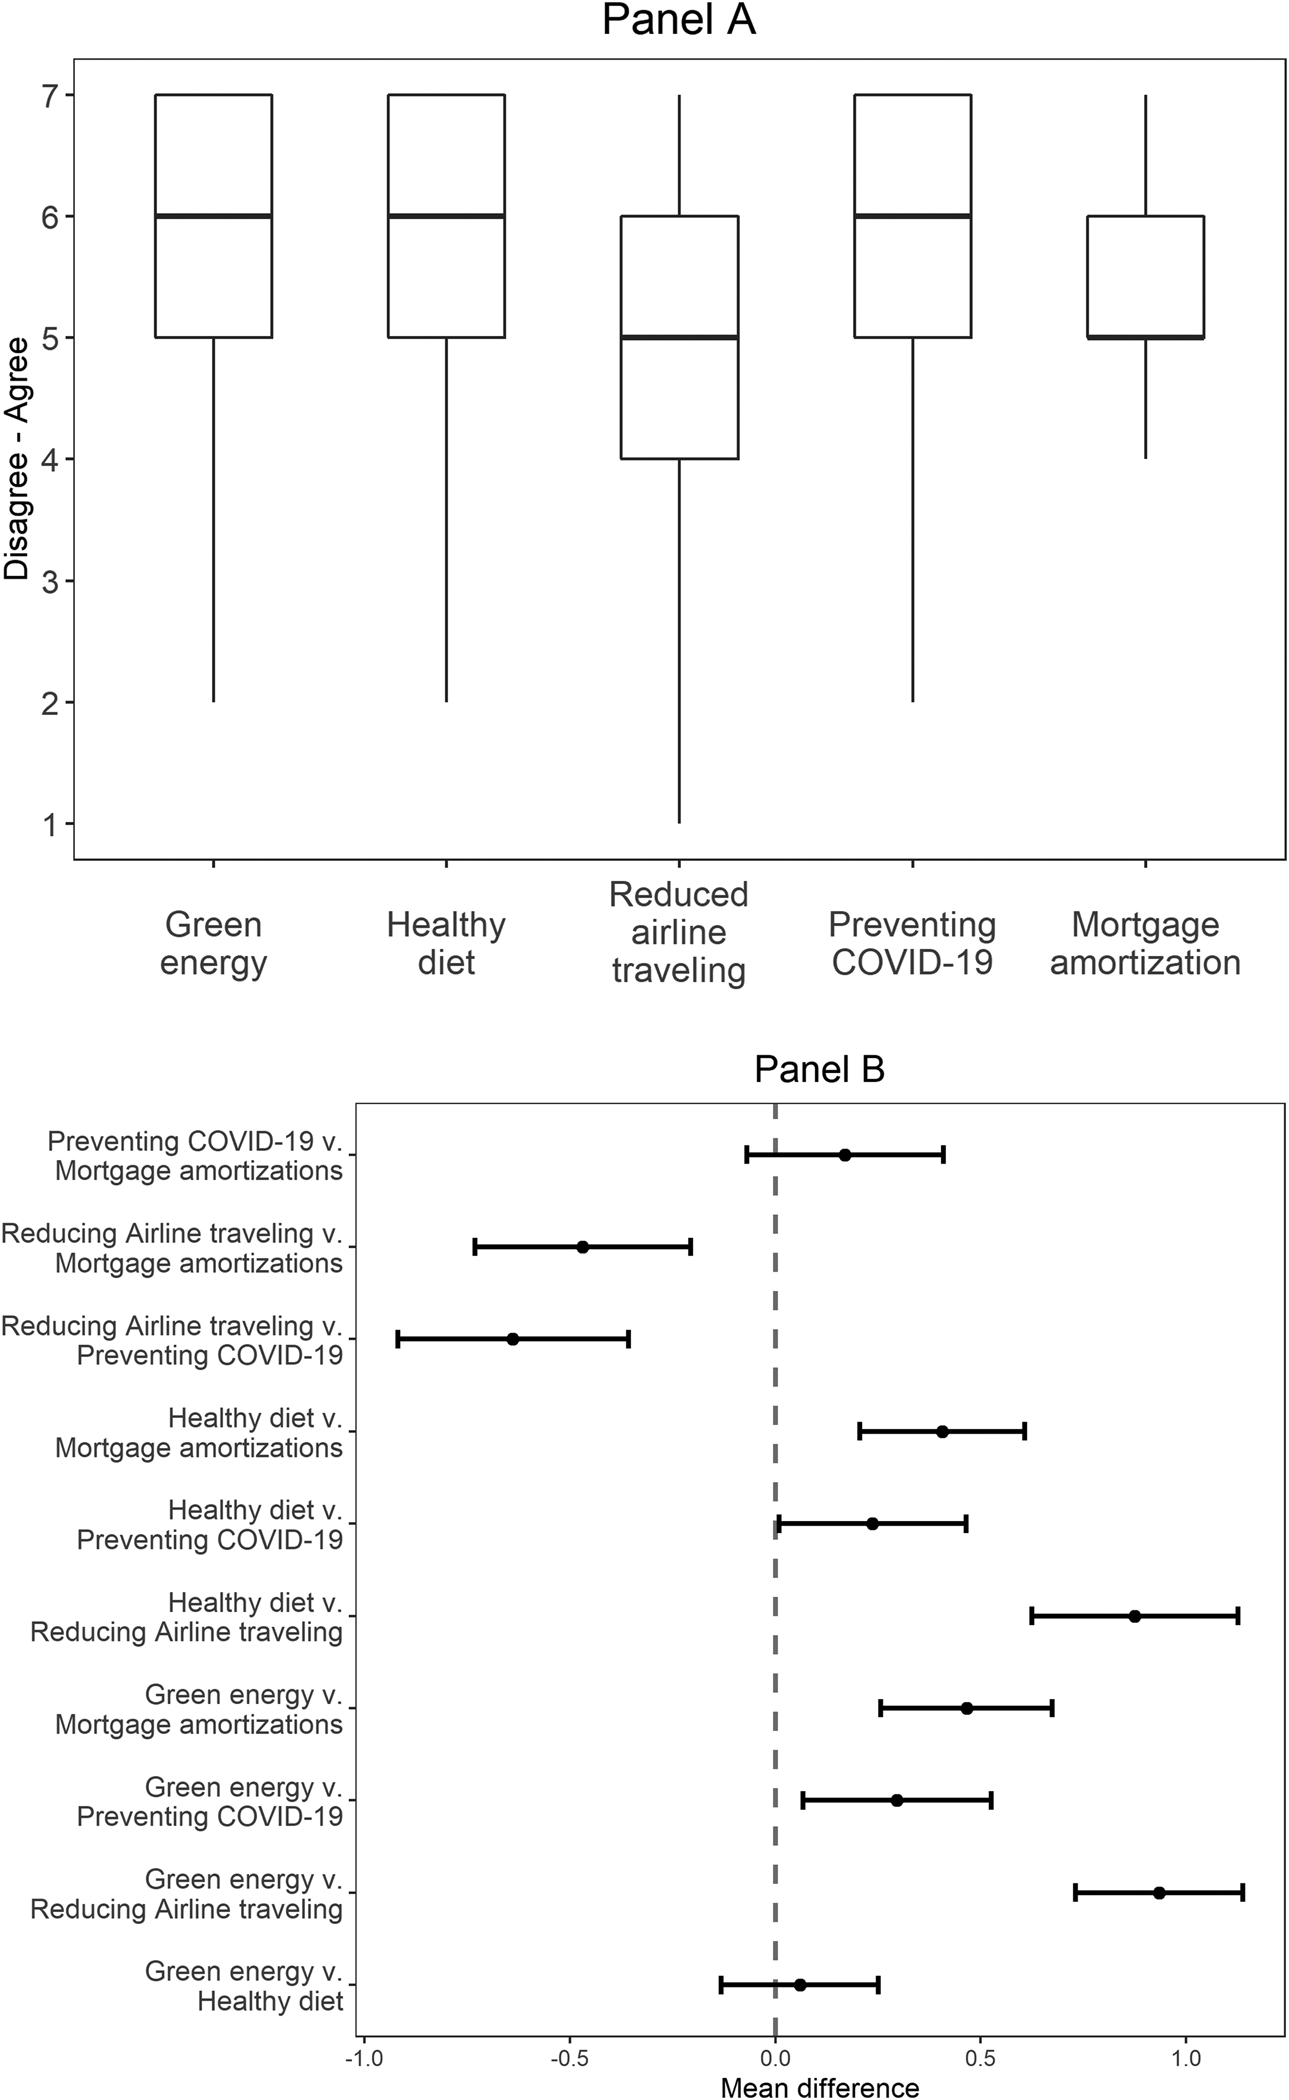
Figure 1. Distributions of the ratings concerning the five policy goals (Panel A) and 99.5% confidence intervals of mean comparisons between the five policy goals (Panel B). Each goal was rated on a scale ranging from 1 (“Absolutely do not agree”) to 7 (“Absolutely agree”). In Panel B, the confidence intervals have been Bonferroni-adjusted, for more details see text. Means with intervals that deviate from zero are significant at p < 0.005.
Attitudes towards taxes, subsidies, information, nudging and mandates
For each of the five policy goals, the respondents evaluated five hypothetical policy tools, which related to either taxes, subsidies, information, nudging or mandates. In all, the respondents rated 25 policy tools. The wordings of those and their mean ratings appear in Table 2. Analyses of how the different policy tools of the respective policy goal were perceived follow below. The analyses involve one-way repeated-measures ANOVA and a series of paired sample t-tests aimed to compare the policy tools. As described in the previous section, the t-tests were adjusted for Bonferroni corrections, inferring a p-value of 0.005 (rather than the conventional p-value of 0.05) and a confidence level of 99.5% (rather than the conventional 95% CI).
Green energy
Panel A of Table 2 presents the following ranking of the policy tools’ mean ratings (from greater to lower): (1) subsidies, (2) information, (3) nudges, (4) taxes and (5) mandates (means = 5.53, 5.30, 4.95, 4.49 and 3.99). This panel also shows that the average respondents did not find those tools unrealistic (M = 4.79). The ratings of the tools were moderately positively correlated (0.35 < r < 0.56). Panel A of Figure 2 points out that those five tools tended to be rated differently. This tendency was found to be statistically significant (F (3, 2145) = 161.20, p < 0.001). The results of the ten paired sample t-tests comparing the five policy tools are visualized in Panel C of Figure 2. It shows that the differences in the ratings of the tools were all statistically significant (range of absolute M Differences = 0.30, 1.54, range of t(536) = 3.62, 18.62, p < 0.005) as well as had relatively small and large effect sizes (0.16 < Cohen's d < 0.89).
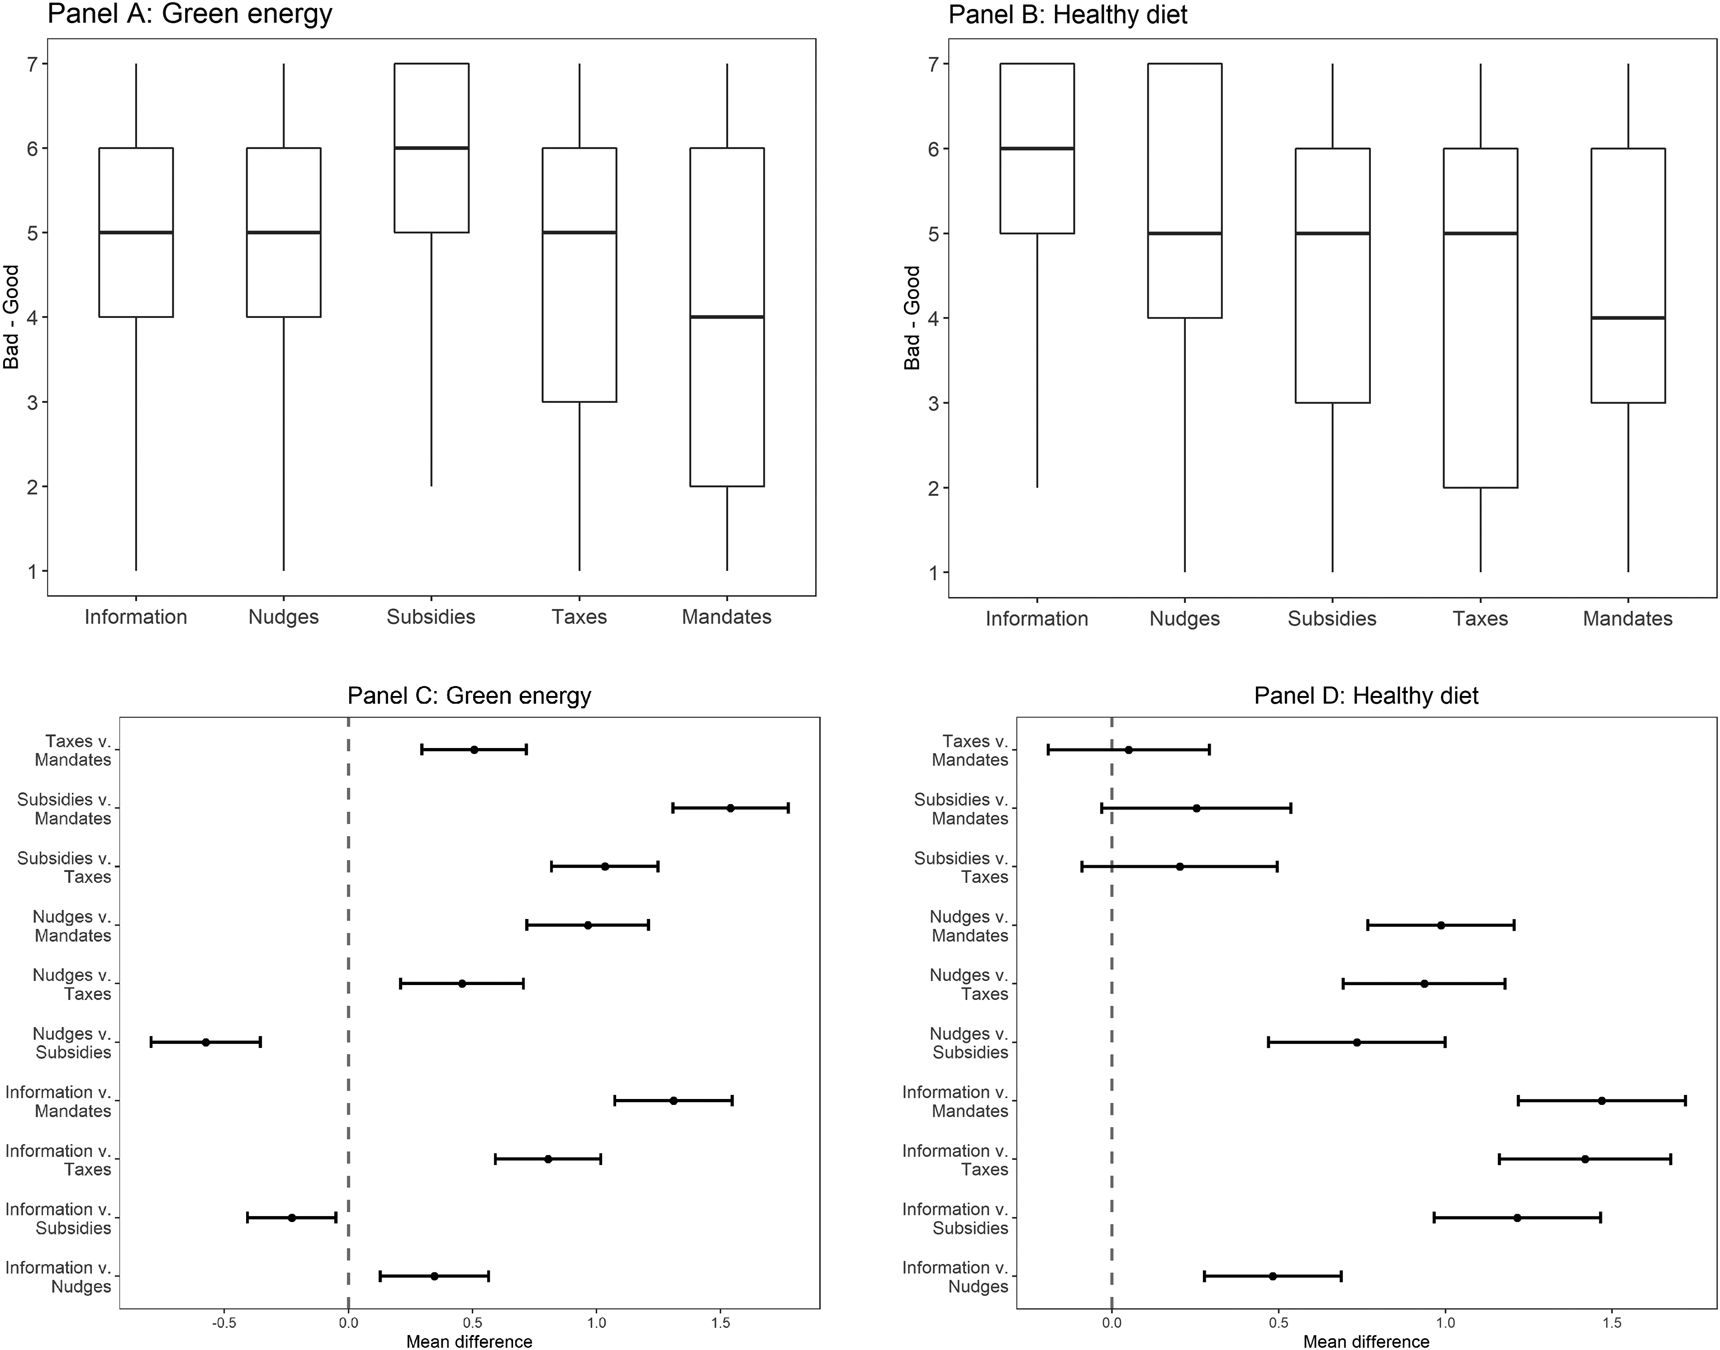
Figure 2. Distributions of the ratings for five different policy tools concerning the policy goals of green energy (Panel A) and healthy diet (Panel B) and 99.5% confidence intervals of mean comparisons between those five policy tools of the respective goals (Panels C and D). Each tool was rated on a scale ranging from 1 (“Very bad”) to 7 (“Very good”). In Panels C and D, the confidence intervals have been Bonferroni-adjusted, for more details see text. Means with intervals that deviate from zero are significant at p < 0.005.
Healthy diet
Considering the mean ratings of the five policy tools proposed for the policy goal of improving children's diets in Panel B of Table 2, one can conclude that the tools were ranked as follows: (1) information, (2) nudging, (3) subsidies, (4) tax and (5) mandates (means = 5.56, 5.08, 4.34, 4.14 and 5.08). The panel also suggests that the tools, on average, were not considered unrealistic (M = 4.64). There were positive correlations between the ratings of the policy tools (0.23 < r < 0.51). Panel B of Figure 2 shows that the distributions of how the five tools were rated seem different. An ANOVA model confirms that the ratings of the tools were statistically significantly different (F (3, 2145) = 167.71, p < 0.001). As shown by Panel D of Figure 2, three out of the ten comparisons of the policy tools did not differ with statistically significant: subsidies vs taxes, subsidies vs mandates and taxes vs mandates. The remaining comparisons of the policy tools were statistically significantly different (range of absolute M Differences = 0.48, 1.47, range of t(536) = 6.61, 16.55, p < 0.005) with small to large effect sizes (0.31 < Cohen's d < 0.89). For example, information received a greater rating than the other tools.
Reduced airline traveling
Panel C of Table 2 suggests that the five policy tools aimed to reduce airline traveling could be ranked based on their means in the following order: (1) subsidies, (2) information, (3) taxes, (4) nudges and (5) mandates (means = 5.34, 4.83, 4.11, 3.80 and 3.02). The panel also shows that the average respondent was somewhat hesitant to the realism of the tools (M = 4.04). The ratings of the policy tools were positively correlated (0.20 < r < 0.56). Panel A of Figure 3 shows differences in the distribution of the responses concerning the policy tools. They were also found to be statistically significantly different (F (3, 2145) = 250.00, p < 0.001). Panel C of Figure 3 shows that nine out of ten differences in ratings between the policy tools were statistically significant (range of absolute M Differences = 0.51, 1.54, range of t(536) = 6.86, 24.98, p < 0.005) with effect sizes ranging from small to large (0.16 < Cohen's d < 1.24). The one exception was the comparison between nudges and taxes.
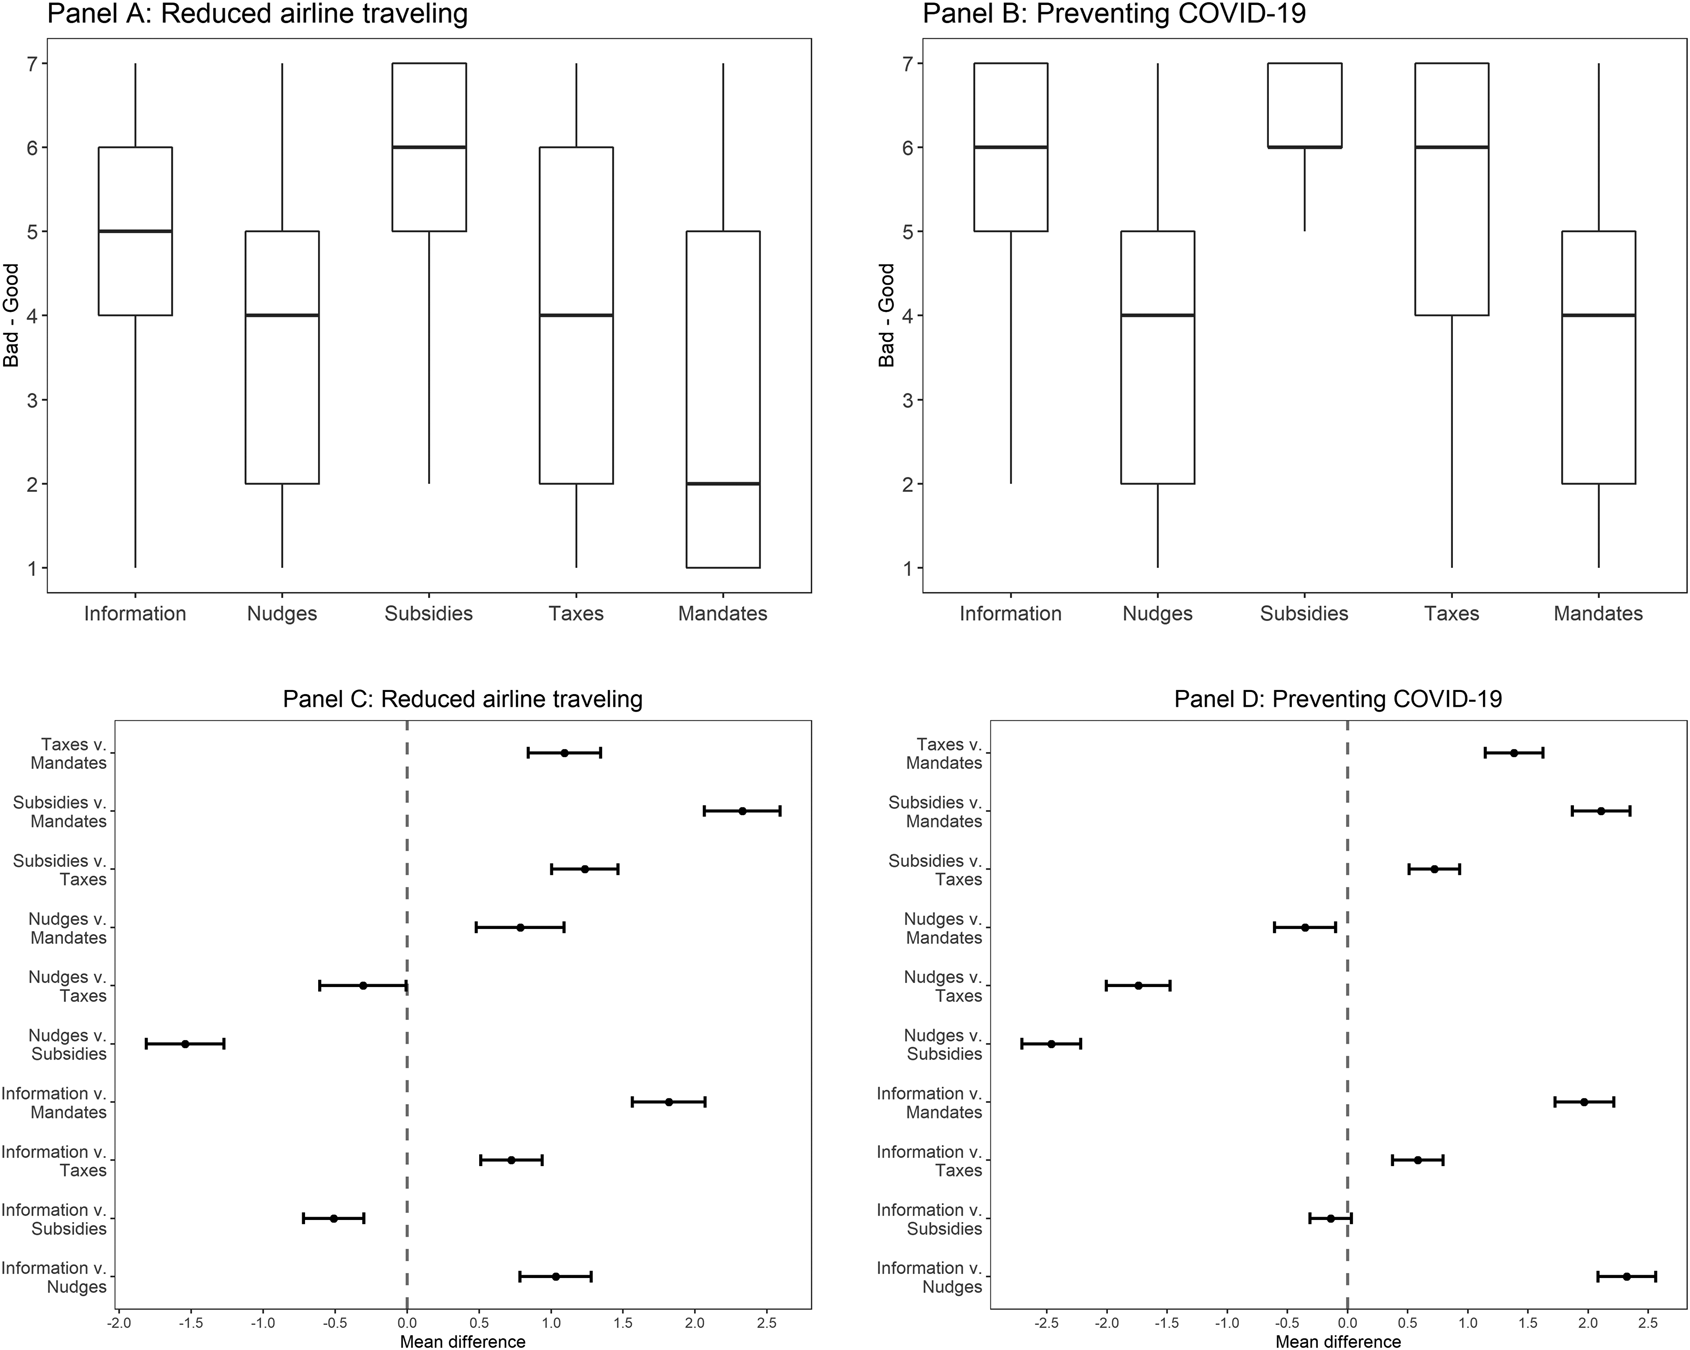
Figure 3. Distributions of the ratings for five different policy tools concerning the policy goals of reduced airline traveling (Panel A) and preventing COVID-19 (Panel B) and 99.5% confidence intervals of mean comparisons between those five policy tools of the respective goals (Panels C and D). In Panels C and D, the confidence intervals have been Bonferroni-adjusted, for more details see text. Means with intervals that deviate from zero are significant at p < 0.005.
Preventing COVID-19
Panel D of Table 2 shows the mean ratings of the five policy tools designed to mitigate the spread of COVID-19. Based on the means, the five tools could be ranked as follows: (1) subsidies, (2) information, (3) taxes, (4) mandates and (5) nudges (means = 6.07, 5.93, 5.35, 3.96 and 3.61). The panel also points out that the tools were, on average, deemed realistic (M = 4.94). The policy tools were positively but weakly correlated (0.10 < r < 0.34). As shown by Panel B of Figure 3, the response distributions of the policy tools differed. Interestingly, the dispersion of the responses on subsidies was tighter than the other tools, suggesting greater degree of agreements among the respondents. The ANOVA model showed that the differences were statistically significant (F (3, 2145) = 499.20, p < 0.001). As described by Panel D of Figure 3, nine out of ten policy comparisons were statistically significantly different (range of absolute M Differences = 0.35, 2.46, range of t(536) = 7.81, 28.37, p < 0.005) with small to large effect sizes (0.20 < Cohen's d < 1.64). The mean difference between information and subsidies was not statistically significant.
Mortgage amortization
Panel E of Table 2 reports the mean ratings of the five policy tools aimed to increase mortgage amortization. From high to low means, the tools could be ranked as follows: (1) information, (2) subsidies, (3) taxes, (4) mandates and (5) nudges (means = 5.21, 4.80, 4.61, 4.49 and 4.41). The correlations between the means were positive but often weak (0.16 < r < 0.52). Panel E of Table 2 also suggests that the tools were deemed realistic (M = 4.96). As illustrated by Panel A of Figure 4, the five tools had almost similar response distributions. Nonetheless, the ANOVA model pointed to statistically significantly different between the ratings of the policy tools (F (3, 2145) = 26.68, p < 0.001). On closer inspection, five out of ten policy tool comparisons yielded significant differences, whereas the other five tool comparisons did not, as visualized by Panel C of Figure 4. Specifically, the five significant comparisons were: information vs nudges, information vs subsidies, information vs taxes, information vs mandates and nudges vs subsidies (range of absolute M Differences = 0.31, 0.79, range of t(536) = 2.94, 10.10, p < 0.005). Their effect sizes ranged from relatively small to medium (0.18 < Cohen's d < 0.53).

Figure 4. Distributions of the ratings for five different policy tools concerning the policy goals of mortgage amortizations (Panel A), 99.5% confidence intervals of mean comparisons between those five policy tools of this policy goal (Panel C), 99.5% confidence intervals of the average ratings for each policy tool across the five policy goals (Panel B) and 99.5% confidence intervals of mean comparisons between those averages (Panel D). Each tool was rated on a scale ranging from 1 (“Very bad”) to 7 (“Very good”). In Panels B–D, the confidence intervals have been Bonferroni-adjusted, for more details see text. For Panels C and D, means with intervals that deviate from zero are significant at p < 0.005.
Additional analyses of the perceptions of the policy tools
To further analyze how the policy tools concerning information, nudges, subsidies, taxes and mandates were perceived, two additional types of analyses were performed. Firstly, the ratings for each of those five categories of policy tools were averaged across the five policy goals (0.58 < Cronbach's α < 0.71). Thus, five index variables were constructed, whereby each denoted a certain category of policy tools. Panel B of Figure 4 visualizes the means of those variables and suggests that they could be ranked based on their respective means: (1) information (M = 5.36, SD = 0.96), (2) subsidies (M = 5.22, SD = 1.16), (3) taxes (M = 4.54, SD = 1.21), (4) nudges (M = 4.37, SD = 1.08) and (5) mandates (M = 3.91, SD = 1.16). An ANOVA model confirmed that the index variables were statistically significantly different (F (3, 2145) = 432.10, p < 0.001). The results of the ten paired t-tests to evaluate the differences between the index variables are graphically described in Panel D of Figure 4. All those tests pointed to statistically significantly different (range of absolute M Differences = 0.15, 1.46, range of t(536) = 3.31, 28.08, p < 0.005). The effect sizes ranged from relatively small to large (0.15 < Cohen's d < 1.36). It should, however, be noted that two differences, which concerned taxes vs nudges and subsidies vs information, were small but significant, as shown in Panel D of Figure 4.
The second type of analysis concerned counting respondents. For each tool, the number of respondents rating it consistently positively (assigning scale points 5–7) across the five policy goals were counted. In ranked order, this procedure yielded the following numbers for information, subsidies, taxes, nudges and mandates: 191, 148, 75, 30 and 17. Information and subsidies were, thus, the most popular policy tools.Footnote 3
Summary of the analyses
In sum, all analyses point out that the hypothetical policy tools were perceived differently across the five policy goals and that nudging did not compare favorably. Considering how the five categories of policy tools were ranked with respect to their mean ratings for the respective policy goals, one draws two conclusions: Firstly, information and subsidies were preferred to a greater extent than taxes, nudges and mandates. Secondly, nudges seemed to be favored only over mandates. Those conclusions were verified by also counting the number of respondents who gave consistently positive ratings to each of the tools. Considering the average ratings across the five policy goals (i.e., the index variables), one concludes that information and subsidies were positively rated, in relative terms, while mandates and nudges were unfavorably perceived.
Determinants of the attitude towards the policy tools
Table 3 reports on 25 separate OLS regression models aimed to explain the attitude towards each specific policy tool, see Panels A–E. Building on prior research on nudging (Hagman et al., Reference Hagman, Andersson, Västfjäll and Tinghög2015; Jung & Mellers, Reference Jung and Mellers2016; Reisch & Sunstein, Reference Reisch and Sunstein2016; Tannenbaum et al., Reference Tannenbaum, Fox and Rogers2017), the predictors of the models were the socio-demographic variables gender, age, higher education (defined as university studies), as well as individualism, while controlling for agreement with the respective policy goal and the specific tools’ realism.
Table 3. Regression results for explaining attitudes towards the five different policy tools across the five different policy goals. Standardized beta coefficients.
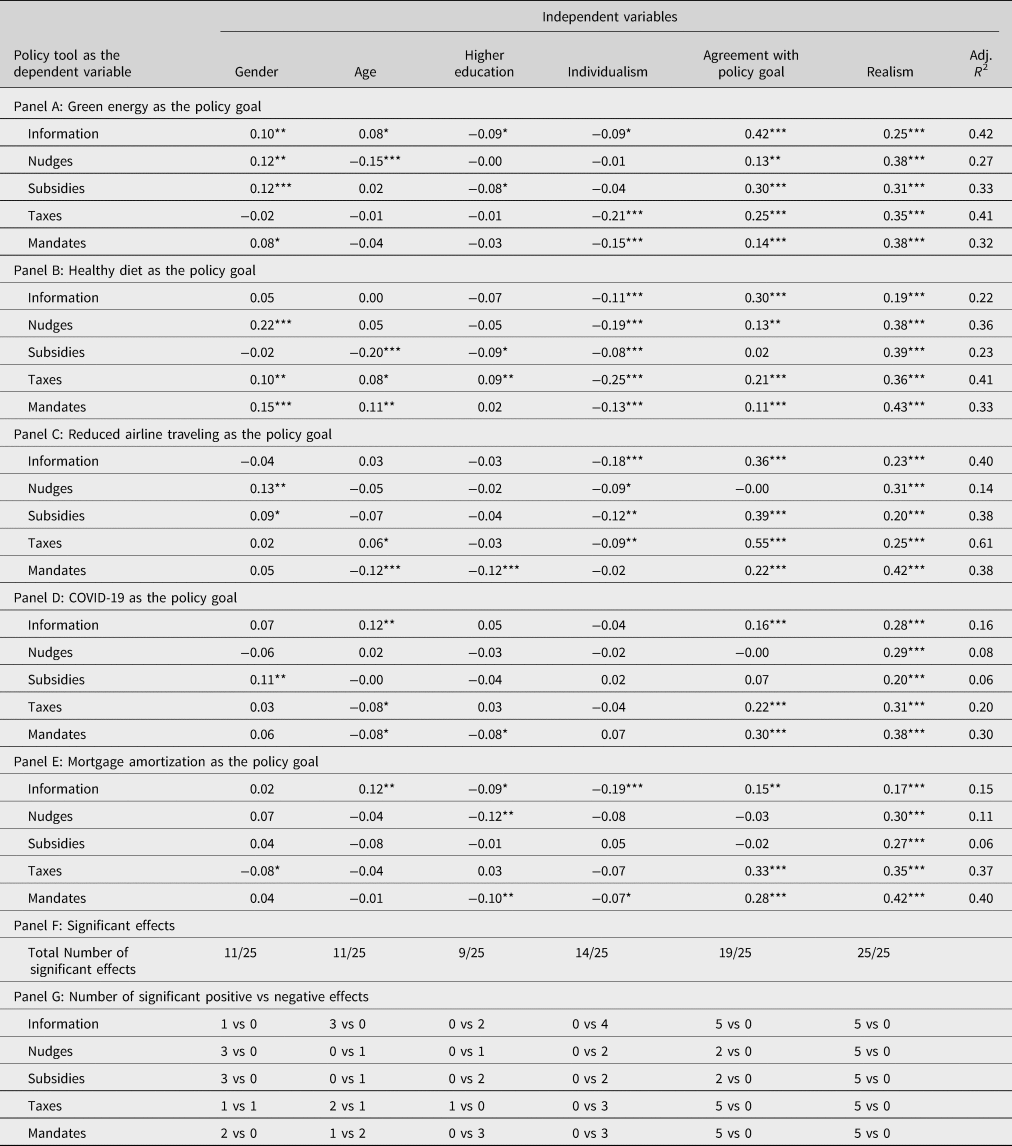
Note: Gender was coded as 0 for males and 1 for females. Higher education (i.e., university studies) was coded 1 and 0 for the other types of education. *p < 0.05, **p < 0.01, ***p < 0.001
As shown in Panel F of Table 3, gender, age and higher education were statistically significant but weak coefficients in less than half of the regression models. In 14 out of the 25 regressions, the individualism variable was significantly negatively related to attitudes towards the policy tools, indicating that individualistic views are associated with lower support for the policy tools. The control variables concerning agreement with the policy goals as well as their realism were statistically significant and positively in most regression models (19 and 25, respectively). Thus, the more desirable and realistic the respondents deemed the policy goals and policy tools to be, the greater tendency to rated them positively.
Panel G of Table 3 shows that the number of significant coefficients of gender, age and higher education varied between the different policy goals and, sometimes, also in directions. Female respondents seemed to be more positive (or less negative) towards nudges, subsidies and mandates, depending on the policy goal. Age was associated with varying views of taxes and mandates, but often positively related to information. In general, respondents with higher education tended to be more negative towards the policy tools, especially for mandates. Regarding the individualism variable, the significant effects were consistently negative, see Panel G. In comparison with gender, age and higher education, the individualism variable emerged to be a statistically significant more consistent predictor across the specific policy tools, χ 2(1, N = 100) = 4.6, p = 0.032). Regarding the significant coefficients for agreement with policy goal and perceived realism of policy tools, they were all positive.
Comparisons between participants endorsing and rejecting the policy goals
The regression models of Table 3 suggest positive relationships between goal agreement and attitudes towards different policy tools. To further evaluate those relationships, the following analyses were conducted.Footnote 4 For each goal, participants who endorsed it (i.e., responded 5–7 on the scale) were classified as goal-accepters, whereas participants who disagreed (i.e., responded 1–3 on the scale) were categorized as goal-dismissers. As reported by Table 4, the numbers of goal-accepters differed depending upon policy goal and ranged from 360 (reduced airline traveling) to 474 (healthy diet), observations that are consistent with the boxplots of Figures 2–4. For the goal-dismissers, the corresponding range was 29–119, whereby the goal of green energy was opposed by the fewest number. Within each group and for each policy goal, comparisons were made with respect to the mean attitudes towards the five different policy tools, see Table 4.
Table 4. Attitudes to policy tools by participants endorsing and opposing the respective policy goal.
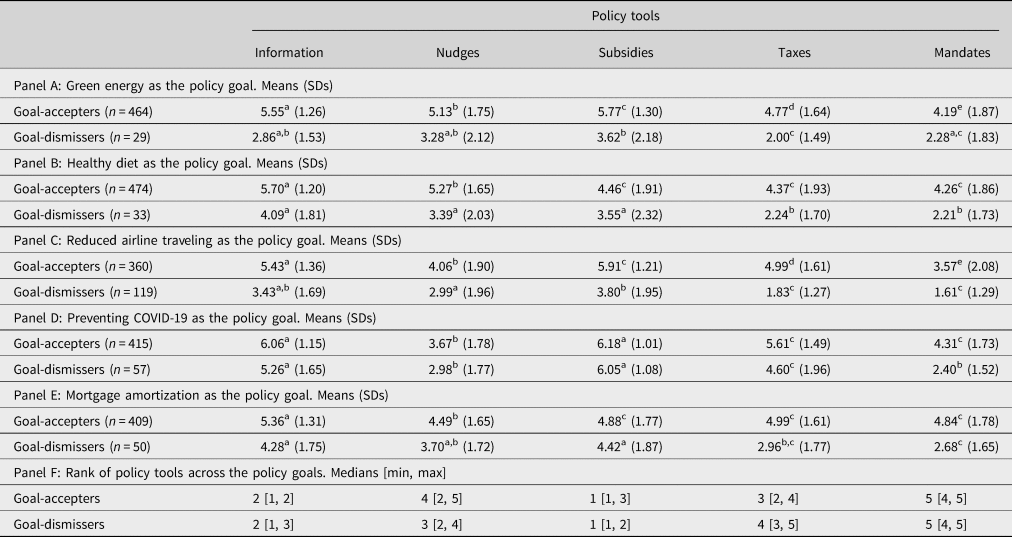
Note: Goal-accepters were defined as the participants answering 5 to 7 on a 7-point scale measuring degree of agreement with a policy goal. Goal-dismissers were those responding 1 to 3 on this scale. Means that do not share a superscript in the same row are statistically significantly different at p < 0.005, as indicated by t-tests (adjusted for Bonferroni-correction). For example, in Panel A, the goal-dismissers rated subsidies similarly as information, but statistically significantly greater than mandates. In Panel F, median has been calculated across the ranks that a tool had for each policy goal, while the numbers in the brackets show the best and the worse rank that a tool received when compared with the other tools within a policy goal.
Panel A suggests that the tools aimed to stimulate green energy could be ranked based on the mean attitudes of the goal-accepters as follows: (1) subsidies, (2) information, (3) nudges, (4) taxes and (5) mandates. This ranking is consistent with that of the total sample. For the goal-dismissers, the corresponding order was a bit different: (1) subsidies, (2) nudges, (3) information, (4) mandates and (5) taxes. Thus, the goal-dismissers favored nudges over information and mandates over taxes, respectively. Mean attitudes towards to the tools of the goal-accepters were statistically different (range of absolute M Differences = 0.36, 1.58, range of t(463) = 3.80, 17.58, p < 0.005, range of Cohen's d = 0.17, 0.97), an observation consistent with the total sample. For the goal-dismissers, the pattern was different. With four exceptions, their mean attitudes towards the tools were mostly statistically similar (range of absolute M Differences = 0.86, 1.62, range of t(28) = 3.19, 4.20, p < 0.005, range of Cohen's d = 0.57, 0.85). The four exceptions were: (1) information vs subsidies, (2) information vs taxes, (3) nudges vs taxes and (4) subsidies vs taxes. The goal-accepters perceived the tools to be more realistic than the goal-dismissers (Ms = 5.04 vs 2.82, SDs = 1.45 vs 1.69, t(30.63) = 6.89, p < 0.005, Cohen's d = 1.51).
Panel B suggests that the goal-accepters considered the policy tools designed for healthy diet similarly to that of the total sample. In other words, the tools were identically ranked, namely in the following sequences: (1) information, (2) nudges, (3) subsidies, (4) taxes and (5) mandates. Regarding the goal-dismissers, they seemed to prefer subsidies before nudges, meaning that the ranking was: (1) information, (2) subsidies, (3) nudges, (4) taxes and (5) mandates. Expect for three comparisons, the attitudes towards the tools of the goal-accepters were statistically different (range of absolute M Differences = 0.44, 1.44, range of t(473) = 5.75, 15.16, p < 0.005, range of Cohen's d = 0.30, 0.92). In line with what has been previously reported for the total sample, the exceptions were: (1) subsidies vs taxes, (2) subsidies vs mandates and (3) taxes vs mandates. For the goal-dismissers, attitudes towards the tools were statistically significant for six comparisons (range of absolute M Differences = 1.15, 1.85, range of t(32) = 3.09, 6.12, p < 0.005, range of Cohen's d = 0.61, 1.05). The four exceptions concerned the following comparisons: (1) information vs nudges, (2) information vs subsidies, (3) nudges vs subsidies and (4) taxes vs mandates. The goal-accepters perceived the tools to be more realistic than the goal-dismissers (Ms = 4.82 vs 3.12, SDs = 1.52 vs 1.83, t(35.14) = 4.92, p < 0.005, Cohen's d = 1.04).
When it comes to the goal of reduced airline traveling, the mean attitudes to the policy tools held by the goal-accepters had identical ranking as the total sample, namely: (1) subsidies, (2) information, (3) taxes, (4) nudges and (5) mandates. See Panel C of Table 4. The goal-dismissers preferred nudges before taxes, leading to the following ranking of the tools: (1) subsidies, (2) information, (3) nudges, (4) taxes and (5) mandates. For the goal-accepters, all mean comparisons between the tools were statistically significant (range of absolute M Differences = 0.44, 2.34, range of t(359) = 5.24, 20.43, p < 0.005, range of Cohen's d = 0.25, 1.35). For the goal-dismissers, seven out of the ten mean comparisons were statistically significantly different (range of absolute M Differences = 0.81, 2.34, range of t(118) = 3.69, 11.08, p < 0.005, range of Cohen's d = 0.41, 1.31). The three exceptions were: information vs nudges, information vs subsidies and subsidies vs mandates. As regards perceived realism of the tools, the goal-accepters had significantly greater ratings than the goal-dismissers (Ms = 4.70 vs 2.35, SDs = 1.54 vs 1.49, t(208.45) = 14.89, p < 0.005, Cohen's d = 1.55).
Panel D shows how the goal-accepters and goal-dismissers rated the tools aimed to prevent the spread of COVID-19. For the goal-accepters, the mean ratings of the tools had identical ranking as that of the total sample, namely: (1) subsidies, (2) information, (3) taxes, (4) mandates and (5) nudges. For the goal-dismissers, the corresponding ranking was somewhat different in that nudges were favored over mandates. Thus, the tools were sorted based on their means in this order: (1) subsidies, (2) information, (3) taxes, (4) nudges and (5) mandates. For the goal-accepters, there were nine statistically significant mean comparisons, which are consistent with what were observed for the total sample (range of absolute M Differences = 0.45, 2.39, range of t(414) = 5.41, 25.09, p < 0.005, range of Cohen's d = 0.33, 1.57). The exception was attitudes towards information and subsidies. For the goal-dismissers, eight mean comparisons were statistically significant (range of absolute M Differences = 0.58, 3.65, range of t(56) = 2.15, 15.41, p < 0.005, range of Cohen's d = 0.35, 2.76). The two exceptions concerned: information vs taxes and nudges vs mandates. The goal-accepters considered the tools to be more realistic than the goal-dismissers (Ms = 5.17 vs 3.65, SDs = 1.48 vs 1.49, t(71.91) = 7.20, p < 0.005, Cohen's d = 1.02).
The comparisons regarding the policy goal designed to stimulate mortgage amortization appear in Panel E of Table 4. Based on the respective means of the goal-accepters, the tools could be sorted as follows: (1) information, (2) taxes, (3) subsidies, (4) mandates and (5) nudges. For the goal-dismissers, the corresponding ranking was: (1) subsidies, (2) information, (3) nudges, (4) taxes and (5) mandates. Thus, the tool rankings of those two groups differed a bit from the ranking based on the complete sample. Firstly, the goal-accepters were more positive towards to taxes than subsidies. Secondly, the goal-dismissers favored subsidies over information and nudges over taxes as well as mandates, respectively. As regards mean comparisons, there were seven statistically significant ones concerning the goal-accepters (range of absolute M Differences = 0.37, 0.87, range of t(414) = 3.89, 9.32, p < 0.005, range of Cohen's d = 0.02, 0.33). The exceptions were: subsidies vs taxes, subsidies vs mandates and taxes vs mandates. For the goal-dismissers, the following comparisons between attitudes towards the tools were statistically significantly different: information vs taxes, information vs mandates, nudges vs mandates, subsidies vs taxes and subsidies vs mandates (range of absolute M Differences = 1.02, 1.74, range of t(49) = 4.00, 5.76, p < 0.005, range of Cohen's d = 0.33, 0.98). As regards realism of the tools, the goal-accepters had statistically significant greater scores than the goal-dismissers (Ms = 5.28 vs 3.76, SDs = 1.36 vs 1.69, t(57.03) = 6.14, p < 0.005, Cohen's d = 1.09).
Panel F of Table 4 shows that subsidies and information were ranked as the two most popular tools across the five policy tools for both groups. Mandates were seen as unpopular. Across the five goals, the goal-accepters seemed to have a more positive attitude towards taxes than nudges, while the pattern was reverse for the goal-dismissers. In sum, the rankings of the policy tools based on mean attitudes of the goal-accepters were like that of the total sample. The corresponding rankings of the goal-dismissers were somewhat different.
Conclusions and discussion
In recent years, scholars in the public policy and public administration literatures have increasingly turned their attention to psychology and behavioral economics (cf. Grimmelikhuijsen et al., Reference Grimmelikhuijsen, Jilke, Leth Olsen and Tummers2017). A topic that has received particular attention is nudging or, specifically, the use of insights from behavioral research to design new policy tools that influence citizens’ behavior without violating their freedom of choice (Thaler & Sunstein, Reference Thaler and Sunstein2003, Reference Thaler and Sunstein2008). The trend has been paralleled by a continued strong interest for nudging within the JDM literature and among policy makers and practitioners. There is an ongoing, interdisciplinary debate on how nudges may complement traditional public policy tools (Loewenstein & Chater, Reference Loewenstein and Chater2017; Tummers, Reference Tummers2019). This article adds to this debate by reporting on empirical findings from a survey investigating and comparing attitudes towards different types of policy tools among a population-representative sample of the Swedish general public.
The article shows that information and subsidies were generally preferred to taxes, mandates and nudges.Footnote 5 This conclusion also holds when consideration was taken to whether there was agreement or disagreement with the policy goal. In addition, those participants who endorsed a policy goal tended to favor taxes over nudges, while the opposite tendency was observed for the participants opposing a goal. Both groups were negative towards mandates. Previous research suggests that Sweden is a so-called cautiously pro-nudge nation (Almqvist & Andersson, Reference Almqvist and Andersson2021). The present article indicates that is also the case when the public support for nudging was measured using a between-policy tool design. The article suggests that more empirical studies on the public support for nudging could benefit from including alternative policy tools as benchmarks rather than studying it in isolation.
The article also sheds light on the determinants of the attitudes towards different policy tools. For most of the examined policy tools across policy goals, the attitude towards them could partly be explained by some combination of the factors gender, age, higher education, individualism, agreement with the policy goal and the perceived realism of the policy tools, with the last three factors most important. Consistent with prior studies (Hagman et al., Reference Hagman, Andersson, Västfjäll and Tinghög2015; Jung & Mellers, Reference Jung and Mellers2016), the attitude towards nudging was found to be significantly related to individualism. Similar relationships were found for the traditional policy tools. The respondents’ attitudes towards the specific tools aimed at mitigating the spread of COVID-19 were, however, less sensitive to differences in individualism than were the other specific tools, regardless of their policy goals. To us, this echoes a finding in previous research on nudging, namely that not all policy goals are controversial or politicized, but may become so depending on the policy debate (Loibl et al., Reference Loibl, Sunstein, Rauber and Reisch2018). This as the Swedish Government's handling of COVID-19 had not yet been particularly politicized at the time of data collection.
Agreement with the policy goal was one of the strongest determinants of attitudes towards the policy tools. This observation is not surprising. It is also consistent with previous evidence that people tend to support nudges whose purposes they like (Tannenbaum et al., Reference Tannenbaum, Fox and Rogers2017). The findings of the present article also suggest that respondents who endorsed a policy goal tended to be more positive towards the tools designed to solve this goal than those who disagreed with the goal. Furthermore, agreement with the policy goal predicted attitudes towards the policy goals differently across policy goals and tools. For taxes, information and mandates, this predictor was statistically significant for all policy goals. For subsidies and nudges, the predictor was only statistically significant for two of the five policy goals. It is not evident why policy goal agreement did not predict attitudes to subsidies and nudges for the other goals. The distributions of those measures did not seem systematically different from the others (except for subsidies concerning the goal of mitigating COVID-19, see Figure 2).
Perceived realism in policy tools was found to be the most important predictor of the attitudes towards policy tools and emerged consistently significant in all regression models. Further comparisons showed that the participants who endorsed a policy goal tended to judge the tools to be more realistic than those who disagreed with the goal. There could, of course, be an overlap between liking (disliking) a certain policy tool and finding it more (less) realistic. This overlap was, perhaps, accentuated, as respondents judged the realism of the policy tools in connection to rating each of those tools. When assessing the realism, the respondents could, tentatively, have used a kind of heuristic, which was based on to what extent they liked the policy tools (e.g., if the tools were rated positively, then they also must be regarded to be realistic).Footnote 6 This speculation may connect to research on affect heuristic, which assumes that people are guided by their (positive or negative) feelings towards objects, phenomena and choices when making judgments and decisions (e.g., see Västfjäll & Slovic, Reference Västfjäll, Slovic, Robinson, Watkins and Harmon-Jones2013). This strand of research could be useful for future studies investigating how people perceive (risks and benefits with) different policy tools.
The findings reported in this article may have implications for public administration. Tummers (Reference Tummers2019) argues that policymakers must evaluate the relative effectiveness of traditional tools and nudges against their respective public support. Hence, a key question for public management scholars and policy makers could be to weigh social and economic welfare (Weimer, Reference Weimer2020) as well as cost-effectiveness (Benartzi et al., Reference Benartzi, Beshears, Milkman, Sunstein, Thaler, Shankar, Tucker-Ray, Congdon and Galing2017) of policy tools against their public support. The article provides some empirical findings of what determines such support. For instance, if the public agrees with a certain policy goal, chances are it will also endorse certain tools used to reach this goal.
There are limitations to the work presented in this article. All surveys on the public support for nudges and other policy tools are sensitive to the specific examples used. Different selections of policy tools and policy goals might have yielded different results. Indeed, there is probably no one operationalization that in and of itself captures the public support for nudging or, for that matter, the traditional policy tools. Rather, we argue that the tools are bound to differ in popularity depending on which policy goals the tools aim for and how the tools are presented. Public support for taxes is sensitive to framing effects (cf. McCaffery & Baron, Reference McCaffery and Baron2004) so it is reasonable to assume the same applies to nudges as well as other policy tools. It should be noted that the survey respondents of this article deemed the included policy tools to be realistic. Another limitation relates to the findings being based on Swedish respondents, which may call for cautious generalizations of these results internationally. In addition, the employed research design featured separate, and not joint, evaluations of policy tools. It is possible that joint evaluations, for example following Hagman et al. (Reference Hagman, Erlandsson, Dickert, Tinghög and Västfjäll2019), could have affected the results. A promising design in future research could be to combine joint and separate evaluations in the same study.
Acknowledgements
We wish to thank the editor and two anonymous reviewers for their helpful comments on how to improve our manuscript. In addition, we have gratefully benefited from insightful feedback from our colleagues at the Stockholm School of Economics; Henry Montgomery at the Department of Psychology, Stockholm University; Håkan Nilsson at the Department of Psychology, Uppsala University; and Daniel Västfjäll, Department of Behavioural Sciences & Learning, Linköping University.
Funding statement
This research was supported by the grant from Handelsbankens Forskningsstiftelser (Project no. P13-0219).
Conflict of interest statement
The authors declare that there is no conflict of interest.


 Open access