


The ethical conduct of public servants has been a subject of public and scholarly scrutiny since the earliest discussions of public administration (Confucius, 475−221 BC; Plato, The Republic; Weber, Reference Weber1947; Hegel, Reference Hegel2005 [Reference Hegel1820]). Citizens want their public servants to be honest, incorruptible and have high moral standards (Neo et al., Reference Neo, Grimmelikhuijsen and Tummers2023). However, innumerous high-profile scandals have been related to the public sector such as the Watergate Scandal in the United States, the Partygate in the United Kingdom and the Sponsorgate Scandal in Canada. At lower governmental levels, matters of cheating, fraud, corruption, abuse of power, scandals and so forth have often reached newspapers and tabloids (De Vries, Reference De Vries2002). Corruption and dishonesty in the public sector – both petty (e.g. fraudulent claims) and large-scale (such as corruption and embezzlement) – are very costly. These costs include increased rule monitoring and enforcement, depletion of common resources and the breakdown of trust and cooperation (Cialdini et al., Reference Cialdini, Petrova and Goldstein2004). In the public sector, dishonesty and corruption are detrimental to public trust (Gillanders and Neselevska, Reference Gillanders and Neselevska2018) and have important implications on the quality of governance.
One reason why corruption is persistent pertains to corruption perception (Treisman, Reference Treisman2000; Corbacho et al., Reference Corbacho, Gingerich, Oliveros and Ruiz-Vega2016) – the more people perceive corruption to be prevalent, the likelier they are to engage in corruption. The constant media exposure of public sector corruption can lead to a bias in perception about the extent of corruption in a society (Masters and Graycar, Reference Masters and Graycar2015). Over time, such biases may contribute to the development of the stereotype that bureaucrats are corrupt (Arendt and Marquart, Reference Arendt and Marquart2015).
Stereotyping can influence our behaviors. Rose and Peiffer (Reference Rose and Peiffer2016) showed that across 76 countries, when people perceive their country’s public servants to be corrupt, they are more likely to pay bribes. But it remains unknown how public servants themselves respond when exposed to information that is consistent with the stereotype that bureaucrats are corrupt. This article aims to address this research gap by focusing on two important elements of corruption: dishonest behaviors and intention to engage in corruption (Weisel and Shalvi, Reference Weisel and Shalvi2015; Zhao et al., Reference Zhao, Zhang and Xu2019). Specifically, I ask the following research question:
Does providing public servants with information consistent with the stereotype that public servants are corrupt affect their honesty and intention to engage in corruption?
Theoretical framework
Public sector honesty and corruption
Individuals may vary in how they respond to corruption. From the perspective of person–situation interaction, not all people react in the same way within a given situation. While many factors can motivate corruption, researchers have found individual dishonesty to play a role in corruption. For example, Brassiolo et al. (Reference Brassiolo, Estrada, Fajardo and Vargas2021) found that dishonest individuals are attracted to graft opportunities which led to actual graft. Graft is also higher among individuals who have lower baseline of integrity. Zhao et al. (Reference Zhao, Zhang and Xu2019) similarly found that when confronted with self-interested opportunities, individuals who scored low on the honesty–humility personality trait were more likely to disengage moral standards and rationalize their corrupt behaviors. Dishonesty involves cheating and lack of probity. It also reflects an inability to refrain from opportunistic behavior (Cohn et al., Reference Cohn, André Marechal, Tannenbaum and Zünd2019). Corruption involves the misuse of public resources or power for private gain (Dickel and Graeff, Reference Dickel and Graeff2018; Gillanders and Neselevska, Reference Gillanders and Neselevska2018). Thus, anybody may be dishonest, but only individuals holding a position of power, such as public servants, can be corrupt.
In the context of public sector, research suggests that honesty among public servants may deviate from that of the general society. Hanna and Wang (Reference Hanna and Wang2017) and Banerjee et al. (Reference Banerjee, Baul and Rosenblat2015) found a strong relationship between public sector job preference and cheating in a dice roll game and corruption game among Indian university students. In relating honesty to public sector corruption, researchers have further found that individual-level dishonesty among public employees is strongly positively associated with country-level corruption (Gächter and Schulz, Reference Gächter and Schulz2016; Olsen et al., Reference Olsen, Hjorth, Harmon and Barfort2019).
However, more recent evidence suggests a more complex view regarding dishonesty in the public sector. While Hanna and Wang (Reference Hanna and Wang2017) and Banerjee et al. (Reference Banerjee, Baul and Rosenblat2015) show a strong positive correlation between dishonesty and selection into public sector, other studies have yielded varied results. Barfort et al. (Reference Barfort, Harmon, Hjorth and Olsen2019) and Gans-Morse et al. (Reference Gans-Morse, Kalgin, Klimenko, Vorobyev and Yakovlev2021) conducted similar experiments in Denmark and Russia and found that aspiring public servants cheated less and were less willing to bribe than their private sector counterparts. Sulitzeanu-Kenan et al. (Reference Sulitzeanu-Kenan, Tepe and Yair2021) used data from field experiments in 40 countries, where experimenters gave a lost wallet and their email address to workers at the reception counter in various buildings. They investigated whether the worker would return the wallet by contacting the email address. They found no public–private sector difference in return rates.
Instead, they found that public sector honesty is determined by the societal culture and public sector culture of a country which in turn predicted country-level corruption. Societal and public sector culture refers to the set of ideas, attitudes, beliefs and norms governing a society and the public sector of a given society. Societies and public institutions may have cultures that can either emphasize or understate the honesty norm, encouraging or discouraging its citizens or public employees to behave honestly. Dishonest and corrupt behaviors can, thus, be understood as functions of individuals perception and responses to these norms.
Just as the perception of honesty norms can influence honesty, scholars have argued that perception may function in similar ways to produce corruption. Corruption perception – the extent to which individuals perceive corruption to be widespread (Corbacho et al., Reference Corbacho, Gingerich, Oliveros and Ruiz-Vega2016) – can foster distrust and normalize bribery (Čábelková and Hanousek, Reference Čábelková and Hanousek2004). People may also assume that detection is less likely when corruption is prevalent (Mauro, Reference Mauro2002; Barfort et al., Reference Barfort, Harmon, Hjorth and Olsen2015). Therefore, in believing that many others in society and their own organization are corrupted, officials themselves lose the fear of being punished for engaging in corrupt behaviors.
Yet, sound empirical evidence on how corruption perception within the public sector can encourage dishonesty or corruption is lacking. Simply comparing the prevalence of dishonesty among public servants and private sector workers can be misleading. Studies such as that conducted by Banerjee et al. (Reference Banerjee, Baul and Rosenblat2015), Hanna and Wang (Reference Hanna and Wang2017) and Barfort et al. (Reference Barfort, Harmon, Hjorth and Olsen2019) have shown that it is difficult to disentangle cultural and selection effects. Professional groups often vary along many unobservable dimensions and across different countries. For example, differences in honesty could be related to differences in financial situations across professions (Gorodnichenko and Peter, Reference Gorodnichenko and Peter2007). Failing to account for such differences could result in spurious correlations.
To systematically test theoretical propositions, it is important to conduct experiments that manipulate corruption perceptions. The literature on stereotyping can provide a viable way to achieve this. In this article, I focus on two variables important to corruption: dishonest behaviors and intention to engage in corruption. I also focus solely on public employees. There are two other reasons for doing this. First, corruption in the public sector is more influential and detrimental to others in society as it threatens equitable access and delivery of public services. Second, in this manner, I avoid confounding effects of culture and selection. In the following section, I describe several mechanisms of how stereotyping can reinforce corruption perception.
Stereotyping public sector corruption and corruption perception
Most people hear about corruption through second-hand accounts from the mass media and conversations. When a group is repeatedly paired with specific attributes, they contribute to the development of biased memory traces called stereotypes. Stereotypes are overgeneralized beliefs about the characteristics, attributes and behaviors of certain groups of people (Hilton and Von Hippel, Reference Hilton and Von Hippel1996). They can be reactivated and strengthened by subsequent exposure in the media or conversations (Arendt and Marquart, Reference Arendt and Marquart2015). These channels of information thus underlie the formation and dissemination of many resilient stereotypes about public officials, including that of a corrupt bureaucrat (Čábelková and Hanousek, Reference Čábelková and Hanousek2004).
Stereotypes can affect individual perceptions of societal norms related to corruption in multiple ways. First, when stereotypes are strong, people may be more biased to believe that these stereotypes accurately reflect reality and all members within the stereotyped group, regardless of whether they are true (Madon, Reference Madon1997). As such, stereotypes may strengthen the perception that corruption is prevalent, subsequently encouraging people to engage in corruption.
Second, Tirole (Reference Tirole1996) proposed that the collective reputation of a group could explain the persistence of corruption through time or generations of bureaucrats. Stereotypes of a group can be seen as part of the collective reputation of the group that is at least partially inherited from early generation group members. Stereotypes that are built on the reputation and behaviors of previous generations of bureaucrats shape the public’s expectation and behaviors of current bureaucrats. Reputation that is compromised by the existence of negative stereotypes may take generations to undo. Bureaucrats have little incentive to be honest if the public is convinced that they are corrupt because they do not believe that their individual action will significantly alter the reputation of the group.
Third, according to Van de Walle (Reference Van de2004), stereotypes of public servants can become social norms and lead to behaviors consistent with the stereotype due to societal expectations. These stereotypes can become normalized over time through repeated exposure, making behaviors associated with the stereotypes acceptable. Individuals may also engage in proactive defensive strategies, such as intentionally failing and attributing it to external sources rather than their own dispositional characteristics. For example, when reminded of the stereotype of a corrupt bureaucrat, a public servant may blame societal expectations for their inability to resist corruption instead of acknowledging their own lack of integrity.
In short, the socio-cognitive processes involved in stereotyping could increase corruption perception which ultimately reinforces dishonesty and corruption within the public sector. In this study, I experimentally manipulate public servants’ perception of corruption by providing public servants with stereotype information that bureaucrats are corrupt. Following the theoretical rationale outlined before, I assume that exposure to such information will lead public servants to update their beliefs that the public sector is more dishonest, thereby increasing corruption perception.
Hypothesis 1: Providing public servants with stereotype information will strengthen their belief in the stereotype that public servants are, in general, corrupt.
Hypothesis 2: Providing public servants with stereotype information will increase dishonest behavior and intentions to engage in corruption.
Empirical studies
This article asks: ‘Does stereotyping public servants as corrupt affect their honesty and intention to engage in corruption?’ One common strategy to measure the causal effects of stereotyping on behavior is to utilize priming techniques (Cohn et al., Reference Cohn, André and Chal2016). However, priming research has been the target of considerable criticism due to failed replications of several prominent priming studies, ambiguity of proposed mechanism and the ethical issues surrounding priming participants in which participants’ behaviors are manipulated without their awareness and consent or the use of deception (Cohn et al., Reference Cohn, André and Chal2016). Therefore, priming is avoided by investigating whether people update their beliefs based on factual stereotype information and whether these updates influence actual behavior and intention (Haaland et al., Reference Haaland, Roth and Wohlfart2020). This method also allows us to adhere to a no-deception ethical standard where participants are fully aware of the content they are engaging with, aligning with ethical principles of informed consent and autonomy.
To test the hypotheses, I conducted three survey experiments – a pilot experiment to test the manipulations and two experiments to test the main hypotheses with regards to dishonest behavior (Study 1) and intention to engage in corruption (Study 2). For all studies, I recruited public servants from all Anglo-Saxon countries using online panel providers such as Prolific and Amazon Mechanical Turk. This approach was driven primarily by sample size requirements but also had a theoretical basis. Admittedly, these countries exhibit some administrative differences, but they share key characteristics, including a highly pluralistic society and a contractual administrative tradition that emphasizes a management-oriented approach combined with a service mindset in citizen interactions (Peters, Reference Peters2021).
This research is important for two reasons. First, among many other variables, researchers found a strong relationship between individual dishonesty and corruption on the macro-level. Olsen et al. (Reference Olsen, Hjorth, Harmon and Barfort2019) found that across 10 countries, country-level indicators of corruption are strongly positively correlated with behavioral dishonesty among prospective public employees. They argued that the strong relationship could indicate that a powerful feedback mechanism is at play between microlevel variables such as individual-level dishonesty and macrolevel variables such as social norms.
While informative, the study has assumed individual differences in dishonesty to be a functionally unchanging trait. Such assumption raises questions about the potential of using such trait as actionable targets for policy changes and interventions (Bleidorn et al., Reference Bleidorn, Hill, Back, Denissen, Hennecke, Hopwood and Jokela2019). Instead, knowing how people process stereotype information provides insight into malleability of individual corruption perception. This provides us with an informed understanding of what and how to intervene when forming intervention policies.
Second, the understanding of how corruption perception leads to corruption is crucial due to their ubiquitous use by institutions and academics in measuring corrupt activity. Popular corruption perception measures include the Transparency International Corruption Index (CPI) and the World Bank Governance Indicators are often used to assess governance within countries, despite being criticized for the lack of transparency in their construction, the use of vague questions and experts to represent population perceptions (Kaufmann et al., Reference Kaufmann, Kraay and Mastruzzi2005; Olken, Reference Olken2009; Pinková and Jusko, Reference Pinková and Jusko2021). Perhaps most pertinent to this study is the subjective scales problem inherent to such indices (Knack, Reference Knack2006; Andersson and Heywood, Reference Andersson and Heywood2009). Respondents typically evaluate the level of corruption on subjective scales. Without means to control or manipulate perception, it is unclear whether respondents are evaluating the number of corruption cases, their importance, the extent of the damage created or something else. The control afforded in experiments allow possible determinants of corruption that are difficult to measure in the field such as social norms or corruption perception to be directly manipulated, to identify causal effects (Banuri and Eckel, Reference Banuri and Eckel2012). A direct contribution of a better understanding of the causal relationship between corruption perception and corruption is that it allows us to assess the effectiveness of policies targeted at changing perception to reduce corrupt behaviors.
However, conducting experiments in the study of corruption is hard because corruption is a clandestine activity, it is often hidden from view, making empirical data difficult to observe (Banuri and Eckel, Reference Banuri and Eckel2012). This paper focuses on dishonesty and intention to engage in corruption. Honesty and corruption are indeed different constructs, but they are highly related. Studies among students have shown that likelihood of bribe is conditional upon the beliefs about the honesty of others (Zhang, Reference Zhang2015) and that individual-level dishonesty is strongly positively correlated to country-level corruption (Olsen et al., Reference Olsen, Hjorth, Harmon and Barfort2019). These findings suggest that behavioral dishonesty is a strong predictor of corruption. But more importantly, measuring behavioral dishonesty allows at least one component of corrupt behavior to be directly observed in an experimental setting.
In short, there is both a theoretical gap and a methodological lacuna in our understanding of how the perception that public servants are corrupted motivates dishonesty and corruption in the public sector. To address this gap, I conducted three preregistered survey experiments among 1,356 public servants where I experimentally manipulated corruption perception by giving participants information consistent with the stereotype that public servants are corrupted. Subsequently, I test whether the information will affect public servants’ beliefs, their honesty and intention to engage in corruption in a die roll task and a vignette questionnaire.
The main research contributions are twofold. First, by leaning on research in stereotyping, this study provides a means to experimentally manipulate corruption perception to establish causal relationship between corruption perception and intentions and behaviors on the microlevel. This study provides a methodological expansion in the study of corruption on the microlevel beyond relying on country-level indices such as the CPI and aggregate dataset (Goel and Nelson, Reference Goel and Nelson2007; Dong et al., Reference Dong, Dulleck and Torgler2012; López-Valcárcel et al., Reference López-Valcárcel, Jiménez and Perdiguero2017). Second, I avoid conventional priming techniques that still dominate behavioral research, especially in stereotyping research (Wheeler and Petty, Reference Wheeler and Petty2001; Tsamadi et al., Reference Tsamadi, Falbén, Persson, Golubickis, Caughey, Sahin and Macrae2020) by using an information provision experiment (Haaland et al., Reference Haaland, Roth and Wohlfart2020) to examine whether people’s ability to update their beliefs after being exposed to stereotype information is part of the causal mechanism of dishonest behaviors and corrupt intention.
I preregistered the studies on the Open Science Framework (OSF) (https://osf.io/pehau/?view_only=04ac237a134c4086b233c0ffcd6eff46; https://osf.io/nga6p/?view_only=5968d96467cb40b499e4e06186c664d6 and https://osf.io/m38pt/?view_only=6720f78487c14438b243900c13b4f234), and the data, analyses and supplementary materials are available online at https://osf.io/5qrth/?view_only=818ba6b727e047ebbc16019b52fd618a. Ethical approval for the study and its procedures was obtained through the ethical committee of the Faculty of Law, Economics, and Governance of Utrecht University, the Netherlands.
Pilot study: effect of stereotype information on strength of belief in the stereotype
Among a sample of 274 Anglo-Saxon public servants, the pilot study examines whether providing public servants with information consistent with the corrupt bureaucrat stereotype will strengthen their belief in the stereotype and whether this effect varies by individuals’ ability to update their beliefs about corruptibility in the public sector. Participants are considered public employees through the selection filter provided in Prolific and if they indicated that they are currently employed in the public sector.
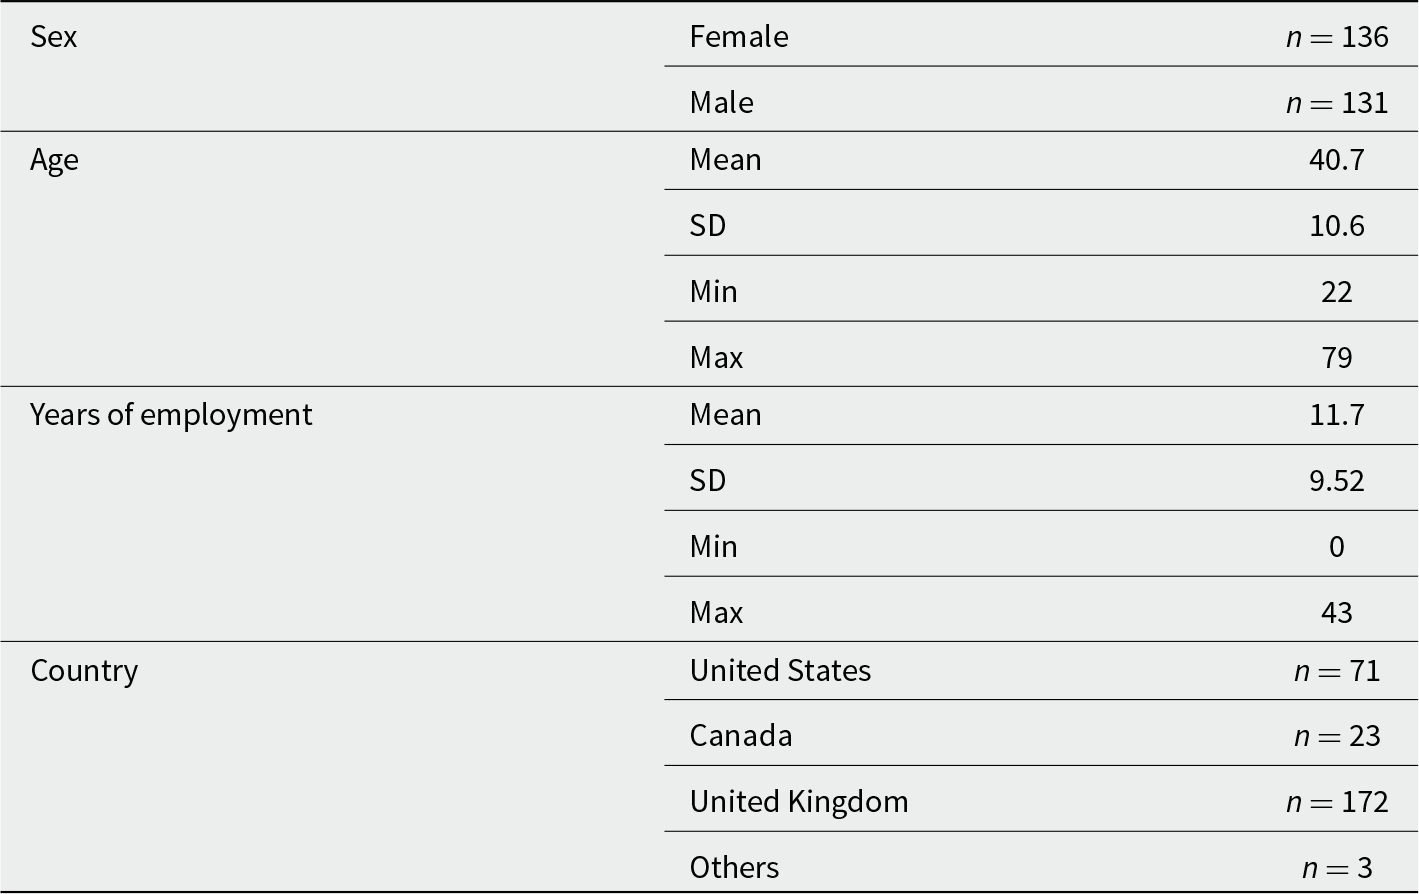
I used the G*Power program for the calculation of power, based on a medium effect size of 0.5 (Cohen’s d). Due to scant prior research, I chose a moderate effect size because I wanted a strong manipulation. This led us to an estimation of 215 participants with a power of 0.9 and accounting for a 25% attrition rate. Participants were excluded if they failed two or all of three attention checks. The attention checks can be found in Appendix 1, whereas a list of exclusions can be found at: https://osf.io/5qrth/?view_only=818ba6b727e047ebbc16019b52fd618a. Table 1 shows the sample descriptive of the final 269 Anglo-Saxon public servants who participated in the study in terms of sex, age and years of employment in the public sector.
Sample descriptive of pilot study
Experimental design
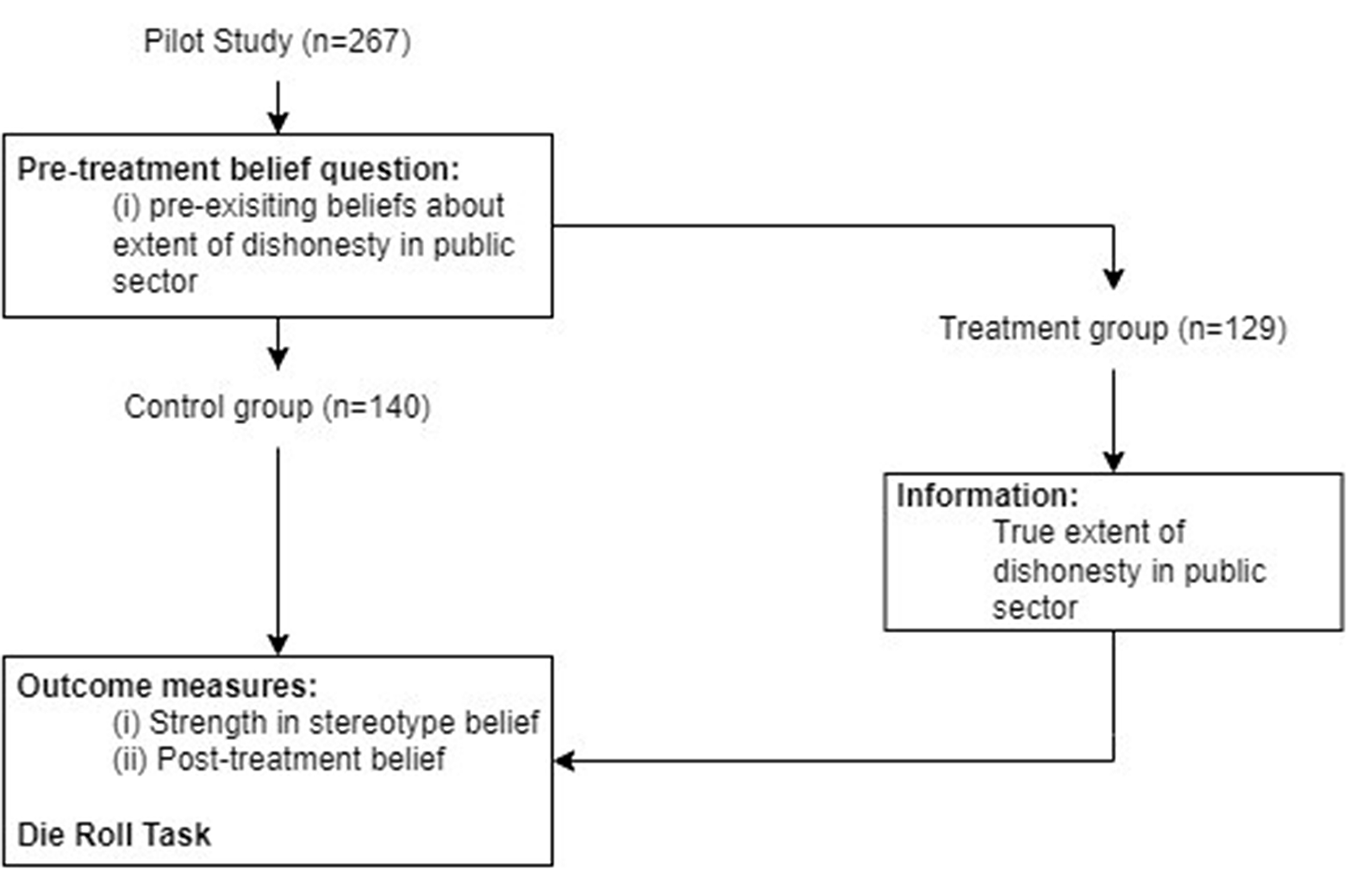
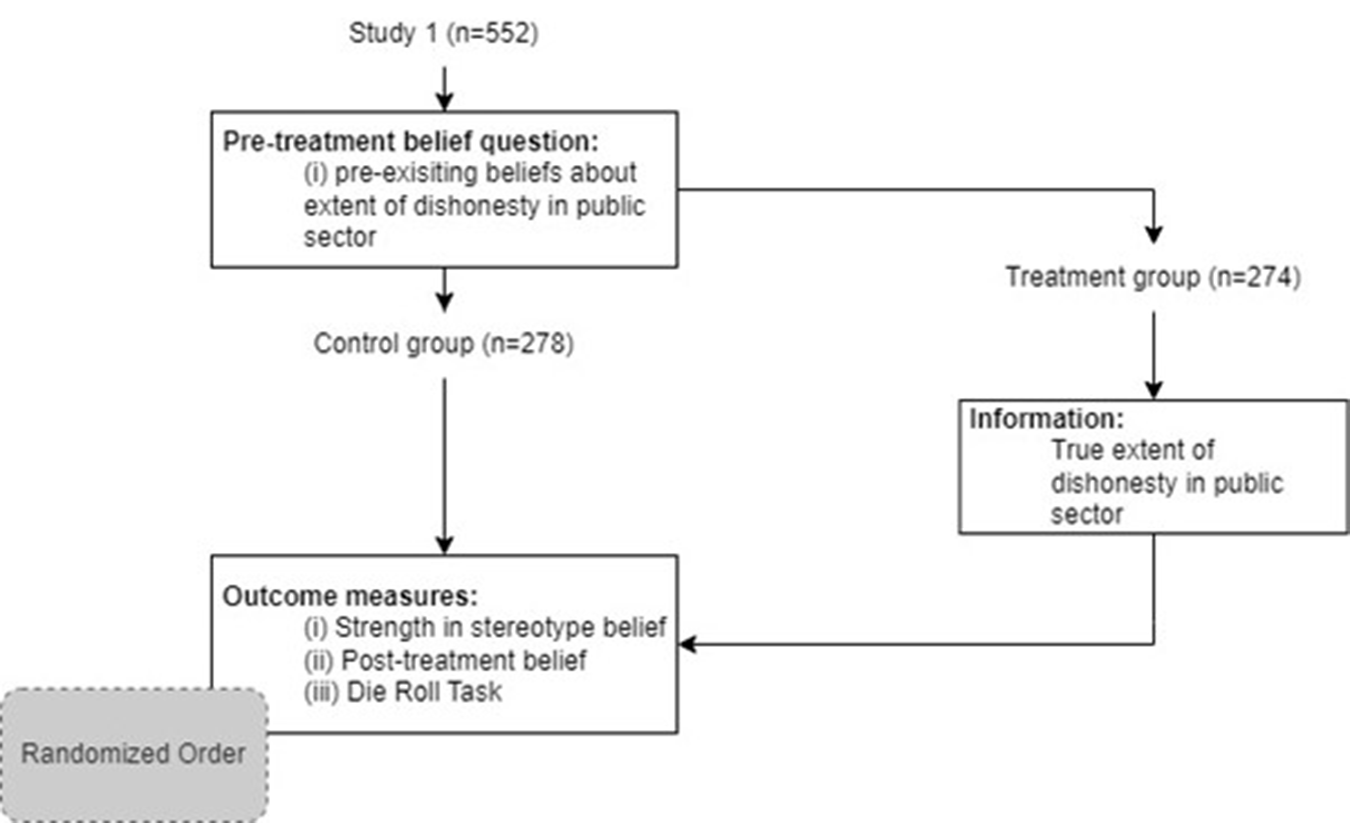
The structure of the pilot is as follows (Figure 1): I first measured participants’ preexisting beliefs about the extent of dishonesty among aspiring public servants (pretreatment belief). I then randomly exposed half of the participants to the information treatment. Subsequently, I measured participants’ belief in the stereotype that public servants are corrupt and posttreatment beliefs about dishonesty in the public sector to see if participants updated their beliefs. Additionally, I tested the die roll task that would be used in subsequent experiments.
Overview of survey flow for the pilot study.
Measures
Pretreatment beliefs. I relied on a study by Olsen et al. (Reference Olsen, Hjorth, Harmon and Barfort2019) that examined cheating behavior among prospective public servants in 10 different countries to measure participants’ preexisting beliefs about dishonesty in the public sector context.
In this study, public administration students were asked to guess a die roll in private, and their results showed that participants cheated in about 58.1% of the rounds. To measure beliefs about dishonesty in the public sector, I asked participants how much they thought aspiring public servants cheated in the game and gave a reward of US$0.50 for answers within 2 percentage points of the researchers’ findings. This incentivized approach has been shown to increase the accuracy of survey responses and revealed participants’ actual beliefs instead of their own judgment, thereby circumventing social desirability concerns (Prior et al., Reference Prior, Sood and Khanna2015; Köbis et al., Reference Köbis, Troost, Brandt and Soraperra2019).
Information treatment. Participants were randomly assigned into a treatment or control condition. I informed participants in the treatment group about the actual rate of cheating by aspiring public servants in the die roll task, i.e., they lied 58% of the time. In contrast, control participants did not receive any information and proceeded directly from the belief elicitation to the outcome questions.
Posttreatment belief. To measure whether participants updated their beliefs about dishonesty in the public sector in response to the research evidence, I relied on a second experimental study that studied honesty in the public sector by Sulitzeanu-Kenan et al. (Reference Sulitzeanu-Kenan, Tepe and Yair2021).
In this study, the researchers investigated public sector honesty using a dataset of honest behavior among public and private sector workers across 40 countries, gathered in a field experiment by Cohn et al. (Reference Cohn, André Marechal, Tannenbaum and Zünd2019). In the experiment, researchers handed wallets to workers in public and private sector office buildings claiming that they are lost. For each wallet, the researchers recorded whether the workers attempted to contact the owner by email to return it.
Like the measure for pretreatment belief, I asked participants to estimate the percentage of public servants they believe attempted to return the wallets. I similarly incentivized participants’ responses for accuracy.
Manipulation check. To measure of the strength of belief in stereotype, participants were asked to rate, on a scale of 1–5, the extent to which they believe public servants, in general, are corrupt.
The full survey can be found in Appendix 1.
Results
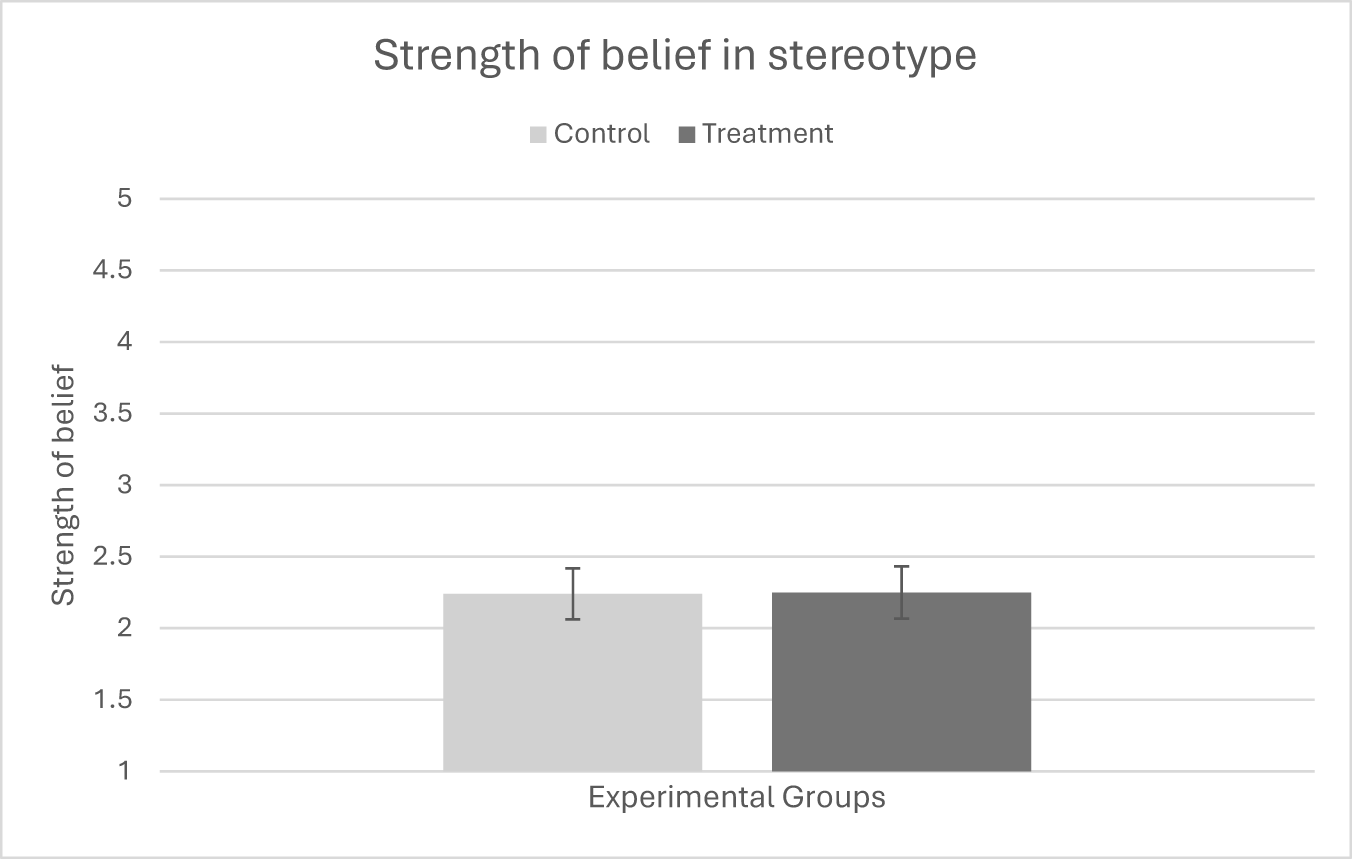
As preregistered, I conducted a two-sample t-test to see if participants’ belief in the stereotype that public sector workers are corrupt is different between the treatment and control condition. The analysis revealed that the strength of belief in the stereotype is not statistically different between the two groups (t(260.74) = 0.08, p = 0.94, M control = 2.24, SDcontrol = 1.06; M treatment = 2.25, SDtreatment = 1.04).This shows that providing participants with stereotype information was insufficient to change their beliefs in the stereotype itself.
I checked if participants who reported a larger update in their beliefs regarding corruptibility in the public sector would have stronger beliefs in the stereotype by an ordinary least squares (OLS) regression. Contrary to expectations, results showed that participants’ belief in the stereotype is not associated with the difference between their pre- and posttreatment beliefs (R 2 = 0.00, F(3, 259) = 0.91, p = 0.44).
The results of the two tests are shown in Figure 2 and Table 2. The full descriptive results of the OLS regression model with preregistered controls are found in Appendix 3.
Mean scores of strength of belief in the stereotype that bureaucrats are corrupt between control and treatment participants. Each condition shows the 95% error bars. Strength of stereotype strength was scored on a 1–5 Likert scale (completely disagree to completely agree).
OLS regression results of the null model where strength in stereotype belief is predicted by treatment condition and difference between pre- and posttreatment beliefs
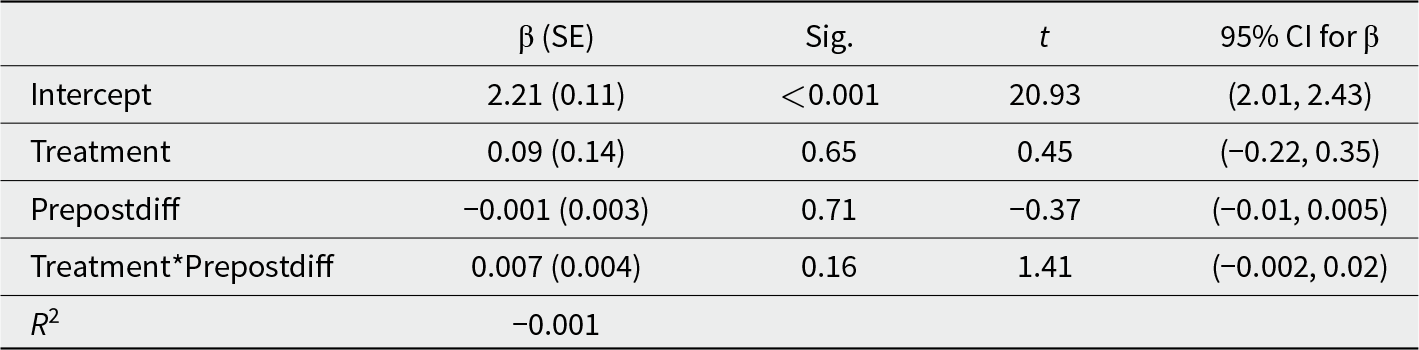
Note: Prepostdiff is the variable indicating difference between participants’ pre- and posttreatment beliefs.
Overall, the results do not support my hypothesis that providing public servants with stereotype information will increase their belief in the stereotype itself (Hypothesis 1). A larger update in beliefs following treatment also did not result in stronger belief in the stereotype.
Study 1: Effect of stereotype-consistent information on strength of belief in the stereotype and dishonest behavior
The main purpose of Study 1 is to study how participants respond behaviorally to stereotype information that was recalibrated based on the findings in the pilot. Therefore, Study 1 replicated the design of the pilot to test the main hypotheses with a few alterations:
First, in the pilot, I measured pretreatment belief of dishonesty in the public sector by asking participants to estimate the percentage frequency of cheating for aspiring public servants in the die roll task, i.e., how much do they cheat. I then provided participants in the treatment condition with the information that they cheated 58.1% of the time. This measure is inconsistent with the measure used for the posttreatment belief which required participants to estimate the percentage of public servants they believe were dishonest, i.e., how many of them cheated. This may have compromised the comparability of the two measures.
Therefore, in Study 1, I asked participants to estimate the percentage of aspiring public servants that have cheated instead of their rate of cheating. Participants in the treatment condition will receive the true information that more than 80% of aspiring public servants have cheated in the die roll task. To reinforce the consistency of the information with the stereotype, I also informed participants that the researchers also found people’s behavior in the game to reflect real world corruption. Therefore, a high rate of dishonesty among aspiring public servants could reflect actual public sector corruption. Participants in the control group did not receive any information and proceeded directly to the outcome questions.
Second, the order effects of presentation of study materials were unaccounted for in the pilot. In the pilot, I tested whether the materials for the die roll task would work as intended. Participants in the pilot performed the die roll task before responding to the set of questionnaires containing the measure for belief in the stereotype and posttreatment belief. This may have affected participants’ reports of their belief in the stereotype. For example, participants may claim that all public servants are corrupt to justify their cheating. In Study 1, I resolve this by randomizing the order of presentation of the questionnaire and die roll task. Third, I used a 7-point Likert scale to measure stereotype belief, instead of a 5-point scale to offer participants more response options (Joshi et al., Reference Joshi, Kale, Chandel and Pal2015).
As in the pilot, I expect that providing participants with stereotype information will strengthen their belief in the stereotype and that the effects will be larger for participants who have larger positive difference between pretreatment and posttreatment beliefs. With regards to the behavior, I expect that the information will increase dishonest behaviors, especially for those with strong belief in the stereotype.
I measured dishonest behavior using a simplified dice game adapted from Olsen et al. (Reference Olsen, Hjorth, Harmon and Barfort2019) and other studies (Hanna and Wang, Reference Hanna and Wang2017; Barfort et al., Reference Barfort, Harmon, Hjorth and Olsen2019). To prevent fatigue, participants played a total of 5 rounds instead of 40. In each round, they guessed a number from 1 to 6 before rolling the die, earning a point worth US$0.10 for each correct guess. Participants also receive a US$0.50 flat fee for participating in the survey, which took less than 5 min to complete.
The die roll game was truly private; participants’ initial guesses were not recorded, allowing participants to misreport the actual outcomes without detection. Such privacy is key to the design, as it mirrors real-life moral ambiguity.
To measure participants’ dishonest behavior, I calculated the percentage of total correct matches in five rounds. A full honesty benchmark is 16.7%. A number higher than that would indicate that the sample contains cheating. To account for luck, I applied a simple linear transformation to the win rate to arrive at an unbiased estimate of how often each individual has cheated (Barfort et al., Reference Barfort, Harmon, Hjorth and Olsen2019), also known as the cheat rate.
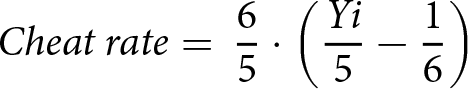 \begin{equation*}Cheat\,rate = \,\frac{6}{5} \cdot \left( {\frac{{Yi}}{5} - \frac{1}{6}} \right)\end{equation*}
where Yi is the number of correct guesses for subject i.
Figure 3 provides an overview of the experimental design of Study 1. The full survey can be found in Appendix 4.
Overview of survey flow for Study 1.
Sample
Study 1 was conducted among a sample of 552 Anglo-Saxon public servants recruited through Prolific. A power calculation with G*Power was performed based small effect size of 0.05 which is typical of stereotype research (Flore and Wicherts, Reference Flore and Wicherts2015). This led us to an estimation of 530 participants with a power of 0.95 and accounting for a 25% attrition rate. Participants were recruited through Prolific. Participants had to successfully pass two out of three attention checks to be included in the study. The attention checks can be found in Appendix 4, whereas a list of exclusions can be found at: https://osf.io/5qrth/?view_only=818ba6b727e047ebbc16019b52fd618a. Table 3 below shows the sample descriptive of the final 552 Anglo-Saxon public servants who participated in the study in terms of sex, age and years of employment in the public sector.
Sample descriptive of Study 1

Results
As preregistered, I conducted a two-sample t-test to see if participants’ belief in the stereotype and rate of cheating in the die roll task is different between the treatment and control condition. Results showed that treatment significantly increased participants’ strength of belief in the stereotype (t(528.63) = −3.16, p = 0.002, d = 0.27, M control = 2.60, SDcontrol = 1.22; M treatment = 2.96, SDtreatment = 1.48). This result was further confirmed with OLS regression analyses in which treatment is a significant predictor of strength of belief in the stereotype (R 2 = 0.02, F(1, 550) = 10.02, p = 0.02).
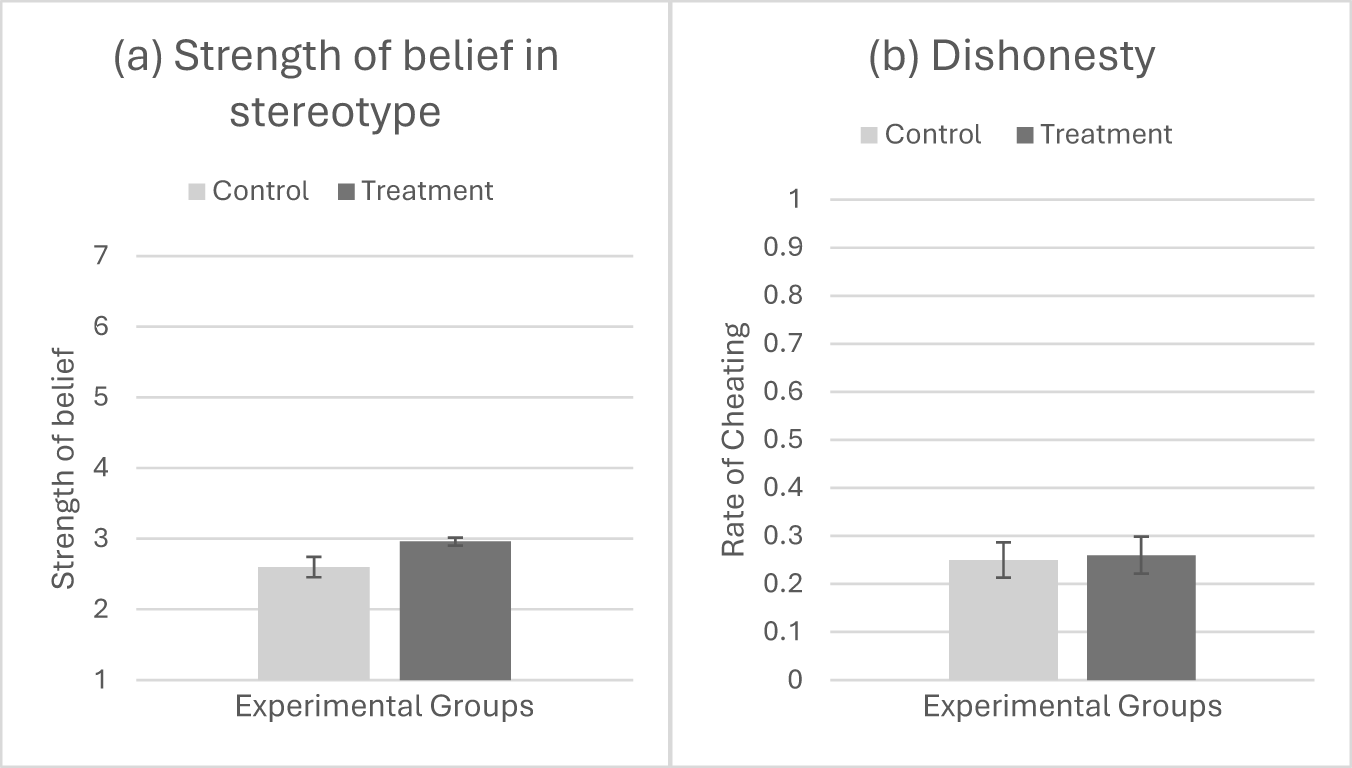
In terms of dishonest behavior, a two-sample t-test analysis showed that participants’ cheat rate is not statistically different between the two groups (t(548.43) = −0.28, p = 0.78, M control = 0.25, SDcontrol = 0.31; M treatment = 0.26, SDtreatment = 0.32). OLS regression analyses revealed the same results (R 2 = 0.002, F(1, 550) = 0.08, p = 0.78). The results are shown in Figure 4. Appendix 6 reports the results of the full models with preregistered controls included.
(a) Mean scores of strength of belief in the stereotype that bureaucrats are corrupt and (b) rate of cheating in the dice game between control and treatment participants. Each condition shows the 95% error bars. Strength of stereotype strength was scored on a 1–7 Likert scale (completely disagree to completely agree). Cheat rate ranges from 0 to 1 where 1 indicates maximum cheating of 100% in all trials.
I further predicted that this effect would be stronger for participants who updated their pre- and posttreatment beliefs more. Table 4 shows the results of the regression analyses. Participants’ belief in the stereotype is positively associated with the difference between their pre- and post-treatment beliefs for participants in the treatment condition (R 2 = 0.03, F(3, 548) = 7.63, p = 5.25e−5). Each percentage point in a difference increases the strength of belief in the stereotype by 0.01. The results remained significant even after controlling for all preregistered control variables (age, sex, length of employment and order presentation). Results showed a significant main effect for update in belief, however, the interaction between update and belief and treatment is insignificant (R 2 = 0.003, F(3, 548) = 1.57, p = 0.20). In other words, belief update influences participants’ rate of cheating in the same way across conditions.
OLS regression results of the null model where strength in stereotype belief and rate of cheating is predicted by treatment condition and difference between pre- and posttreatment beliefs
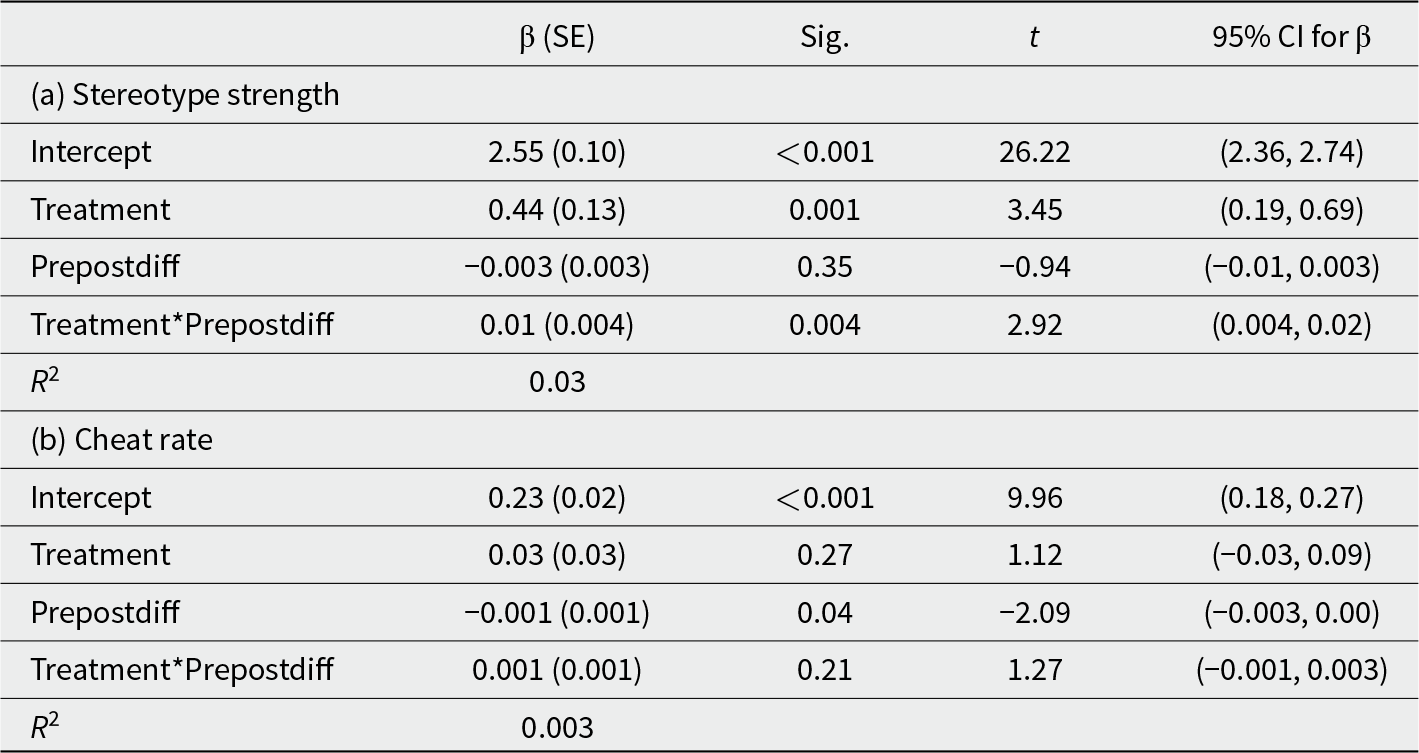
Prepostdiff is the variable indicating difference between participants’ pre- and posttreatment beliefs.
A full description of the results of the analyses with control variables can be found in Appendix 7.
In conclusion, Study 1 found that providing participants with stereotype information strengthened their belief in the stereotype (Hypothesis 1) but was insufficient to affect change in participants’ cheating behavior (Hypothesis 2). I also found that participants who corrected their beliefs upward after reading the information strengthened their belief in the stereotype but not their cheating behavior.
Study 2: Effect of stereotype-congruent information on strength of belief in the stereotype and corrupt intentions
To improve ecological validity of the findings of the pilot and Study 1, I tested the main hypotheses in a context more similar to events occurring in public sector reality in Study 2. Additionally, I sought to elicit stronger beliefs by strengthening the manipulation. Therefore, I replicated the design and materials of Study 1 with two specific alterations:
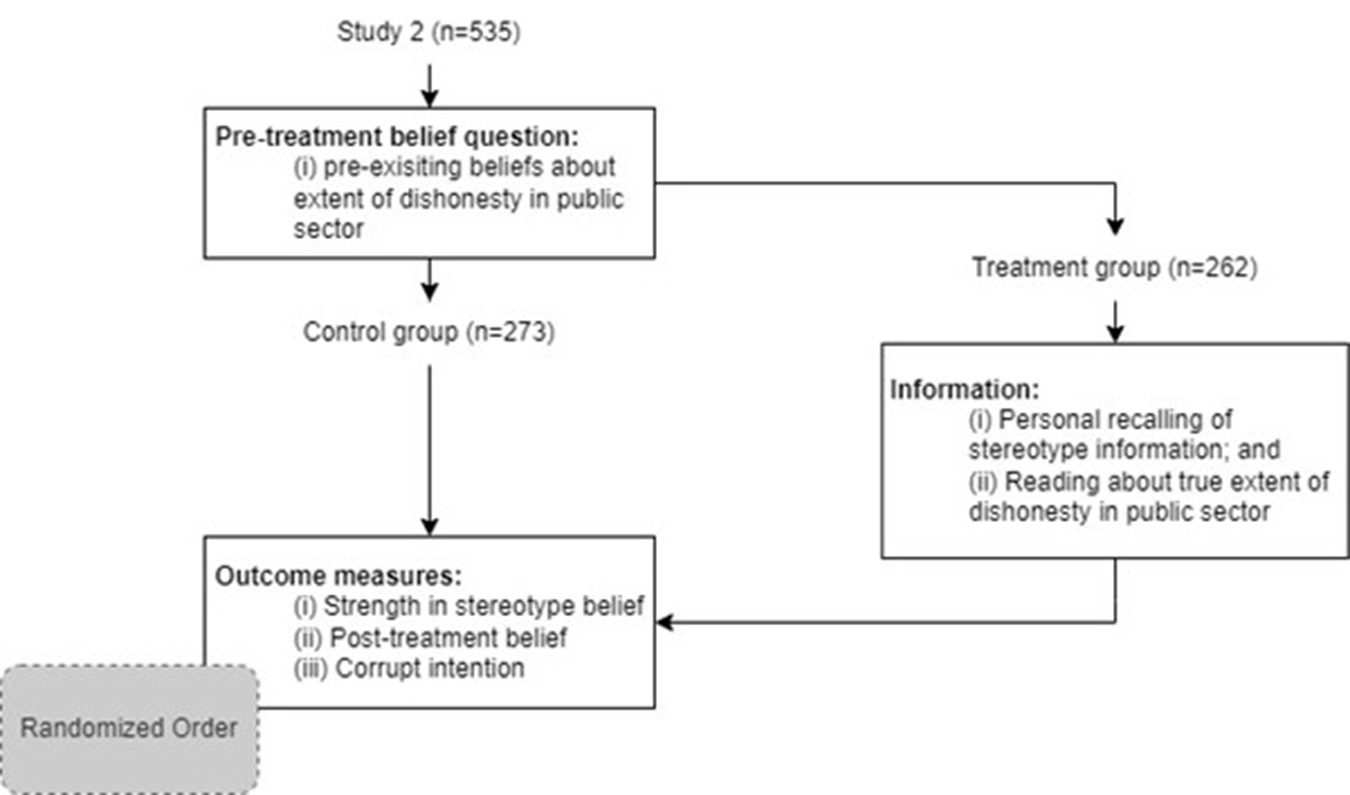
As in Study 1, all participants read about the study by Olsen et al. (Reference Olsen, Hjorth, Harmon and Barfort2019) and estimate the percentage of aspiring public servants that cheated. Participants in the treatment condition of Study 1 were given stereotype information immediately after the estimation. In Study 2, I strengthened the manipulation by having participants recall information of corrupt behaviors in the public sector in addition to providing them with the stereotype information through a writing task. Specifically, participants described examples of how public servants in their country could be corrupt whereas control participants described their favorite TV shows instead.
Studies have shown that people are prone to interpret evidence congruent with their attitude as stronger than attitudinally incongruent evidence (Munro and Ditto, Reference Munro and Ditto1997). Anchoring the question in personal memories of corruption allows access to participants’ cognitive attachment to corruption in the public sector and better understanding of the phenomenon (Jung, Reference Jung2020). Therefore, by giving participants the stereotype information after the writing task, they may perceive the information as more credible.
Second, to increase ecological validity, instead of using the die roll task, I measured public servants’ intentions to engage in corruption by using a vignette that describes a fictitious work-related situation with moral elements associated with it. Specifically, they report their corrupt intentions with regards to committing fraudulent expenses claims. Using a hypothetical scenario through the presentation of a vignette to measure the dependent variable enables researchers to minimize the contextual information while making the evaluative process of decision-making more realistic to visualize the morally questionable situation (Jung, Reference Jung2020).
I adapted the measures used in Jung (Reference Jung2020) to reflect a public sector context. Participants read about a scenario where a manager of a ministry had to decide whether to violate organizational travel reimbursement policy by falsely reporting the amount of travel expense than is prescribed in the organizational policy. The participants then reported how likely were they to claim the false expense (on a scale of 1–7 ranging from ‘very unlikely’ to ‘very likely’).
Additionally, I also measured participants’ tolerance of the behavior (‘To what extent do you think it is acceptable to claim the transportation expense as a taxi claim?’); perceived prevalence of the behavior (‘How often do you think claiming false expenses happen in public sector organizations of your country?’) and the perceived corruptibility of the behavior (‘To what extent do you think the general public in your country would agree that claiming false expenses is an act of corruption?’).
The vignette was modified to reflect a rule bending situation with elements of dishonesty associated with it that can happen in any public organization. In addition, corruption is defined as the abuse of public power for private benefit (Dickel and Graeff, Reference Dickel and Graeff2018; Gillanders and Neselevska, Reference Gillanders and Neselevska2018). The vignette required participants to decide if they would abuse public funds for private purposes to prevent a personal loss. Accordingly, participants perceive that claiming false expenses is highly prevalent (36.4% claimed that it happens more than 70% of the time) and 93.08% of participants at least somewhat agreed that this is commonly considered as an act of corruption. I also framed the vignette and subsequent questions in terms of a third-person perspective to minimize social desirability bias (Dickel and Graeff, Reference Dickel and Graeff2018).
Figure 5 provides an overview of the study design. The full survey can be found in Appendix 8.
Overview of survey flow for Study 2.
Sample
A sample of 541 Anglo-Saxon public servants were recruited through Prolific. Participants who had previously participated in the pilot study and Study 1 were not allowed to participate. Given the previous findings, I based the power calculation on small effect size of 0.05, with a power of 0.95 and accounting for a 25% attrition rate. This led to an estimation of 530 participants. Similar exclusion criteria based on attention checks were used. Additionally, I excluded participants for bad data quality collected through the writing tasks used in the study. A list of exclusions can be found at: https://osf.io/5qrth/?view_only=818ba6b727e047ebbc16019b52fd618a.
Table 5 shows the sample descriptive of the final 535 Anglo-Saxon public servants who participated in the study in terms of sex, age and years of employment in the public sector.
Sample descriptive of Study 2

Results
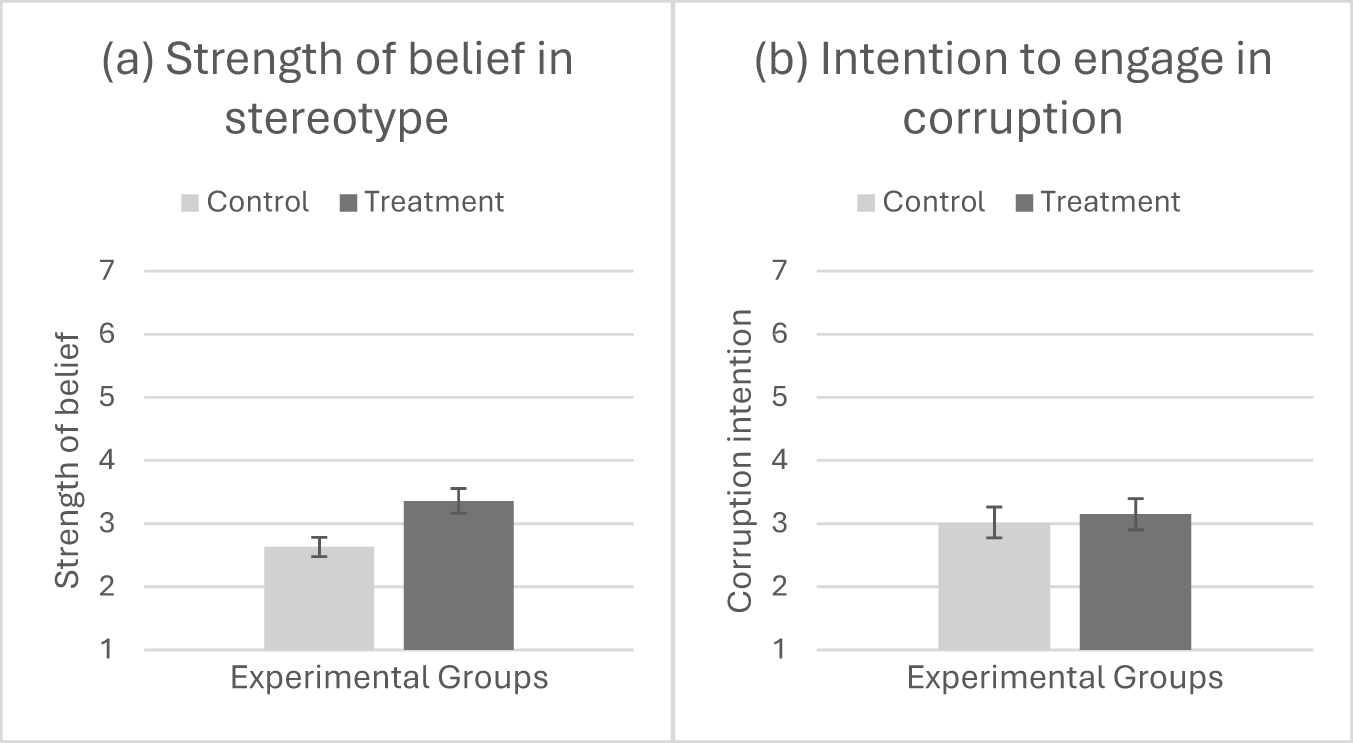
As shown in Figure 6, a two-sample t-test between the treatment and control condition revealed that the recall and information treatment increased participants’ strength of belief in the stereotype as predicted (t(498) = − 5.81, p = 1.12e−08, d = −0.50, M control = 2.63, SDcontrol = 1.28; M treatment = 3.36, SDtreatment = 1.61). However, corrupt intention ratings revealed no statistically significant differences between the conditions (t(532.62) = −0.74, p = 0.46, M control = 3.02, SDcontrol = 2.05; M treatment = 3.15, SDtreatment = 2.02).
Mean scores of strength of belief in the stereotype that bureaucrats are corrupt intention to engage in corruption between control and treatment participants. Each condition shows the 95% error bars. Strength of stereotype strength was scored on a 1–7 Likert scale (completely disagree to completely agree). Intention to engage in corruption is scored on a 1–7 Likert scale (very unlikely to very likely).
OLS regression analyses revealed similar results in which treatment is a significant predictor of strength of belief in the stereotype (R 2 = 0.06, F(1, 533) = 34.06, p = 9.27e−09) but not on corrupt intention (R 2 = 0.00, F(1, 533) = 0.55, p = 0.46). Further analysis revealed that, with the inclusion of the preregistered control variables, treatment turns out to be marginally significantly associated with corrupt intentions (p = 0.06). A full result of the regression analyses can be found in Appendix 10. A subsequent series of regression analyses revealed that tolerance of corruption is endogenous to the treatment which suggests that participants selectively use the information in line with how acceptable they perceive the corrupt behavior to be (R 2 = 0.41, F(5, 528) = 74.5, p < 2.2e−16). Ceteris paribus, each point increase in treated participants’ belief that the corrupt behavior to be acceptable, their intention to engage in corruption increased by 1.18 points (16.86%). Appendix 11 contains the full results of the stepwise comparison of all the regression models.
I then ran OLS regressions to test the hypothesis that the effect would be stronger for participants with a larger difference between pre- and posttreatment beliefs after treatment. Table 6 shows the results of the regression analyses. Participants’ belief in the stereotype and intention to engage in corruption are not associated with the difference between their pre- and posttreatment beliefs for participants in the treatment condition (Strength in stereotypical belief: R 2 = 0.06, F(3, 531) = 11.72, p = 1.90e−7; Corruption intention: R 2 = −0.004, F(3, 531) = 0.28, p = 0.84). The full results with inclusion of all preregistered controls are in Appendix 12.
OLS regression results of the null model where strength in stereotype belief and rate of cheating is predicted by treatment condition and difference between pre- and posttreatment beliefs
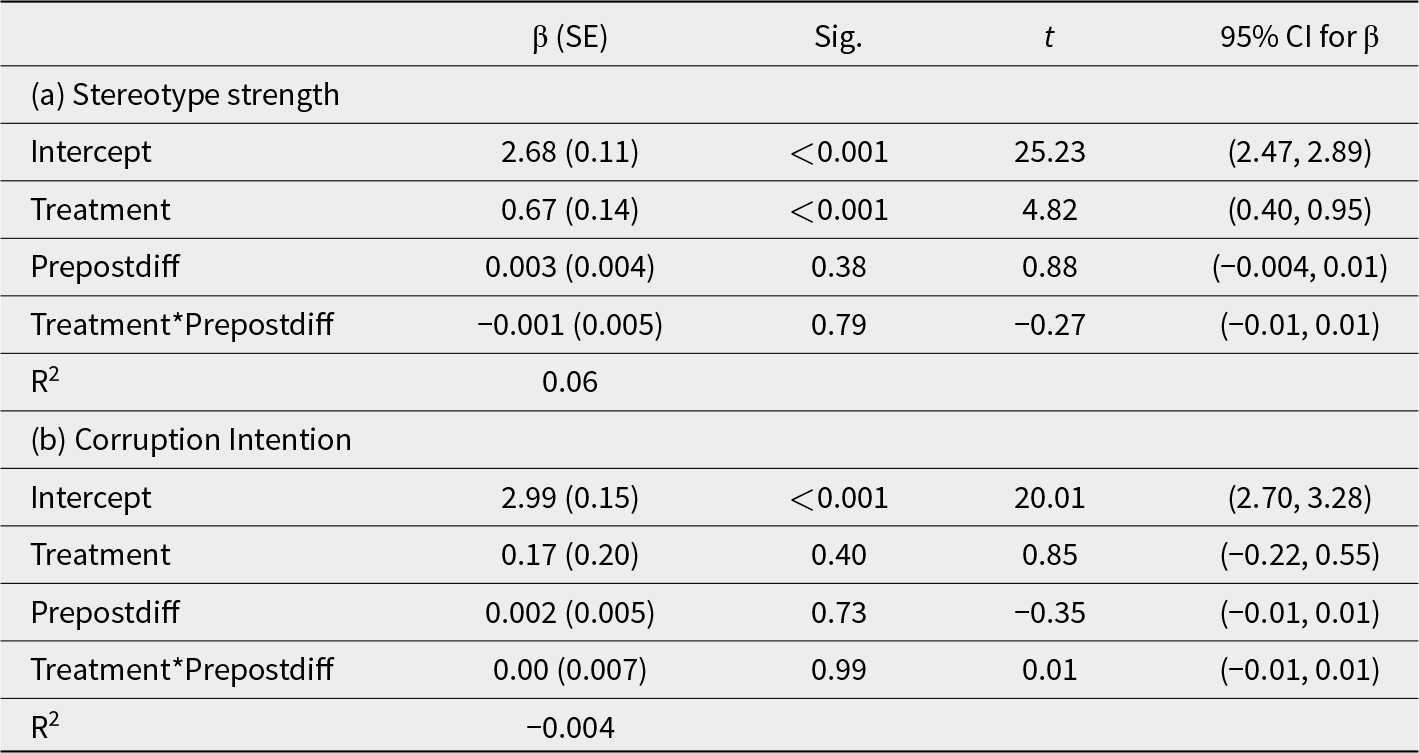
Note: Prepostdiff is the variable indicating difference between participants’ pre- and posttreatment beliefs.
Taken together, the results showed that providing participants with stereotype information strengthened their belief in the stereotype (Hypothesis 1) but was insufficient to change their intention to engage in corruption (Hypothesis 2). Participants’ abilities to update their beliefs after treatment have no significant effect in the strength of their beliefs in the stereotype and their corruption intention.
Concluding discussion
Results suggest that increasing corruption perception through learning about information congruent with the corrupt bureaucrat stereotype does not cause public servants to act more dishonestly or want to engage in corruption. This is the first high-powered study to provide causal evidence that corruption perception changes beliefs, but not intention and behavior of public servants. As such, my findings do not corroborate previously received wisdom that perceived prevalence of corruption can directly increase corruption-related intentions and behaviors.
Instead, the findings show that the causal effect of corruption perception on intention and behavior is more complex than previously purported by literature. Preexisting beliefs play a large role in the effectiveness of the information treatment. For example, the extent to which a corrupt act is acceptable significantly increases public servants’ intention to engage in corruption. This is congruent with Haaland and Roth (Reference Haaland and Roth2021) and Sulitzeanu-Kenan et al. (Reference Sulitzeanu-Kenan, Tepe and Yair2021)’s suggestion that intention and behavior may have an important ‘cultural’ component that is stable over time. One’s tolerance of such acts may be shaped by the norms and practices prevalent in their social environment. Beyond perception of prevalence, variables such as cultural values, moral principles and beliefs about the world affect one’s intention to engage in unethical behavior (Li et al., Reference Li, Triandis and Yu2006; Mazar and Aggarwal, Reference Mazar and Aggarwal2011; Bai et al., Reference Bai, Liu and Kou2016).
While I did not find a direct effect of corruption perception on dishonest behaviors and corrupt intentions, another study among Costa Rican citizens using similar methods, Corbacho et al. (Reference Corbacho, Gingerich, Oliveros and Ruiz-Vega2016) found that corruption information increases citizens’ willingness to bribe officials. This suggests that public servants are differentially affected by such information. A potential explanation lies in public service motivation (PSM) of public employees – the motivation or need to act in ways that promote the public interest. The public sector is often associated with higher PSM, especially in comparison to the private sector (Perry and Wise, Reference Perry and Wise1990; Jacqueline et al., Reference Jacqueline, Doverspike and Miguel2012). Research has shown that PSM is negatively associated with dishonesty (Olsen et al., Reference Olsen, Hjorth, Harmon and Barfort2019) and positively linked to employees’ willingness to report unethical behavior (Van Roekel and Schott, Reference Van Roekel and Schott2021). Scholars argue that individuals with higher PSM are more likely to act ethically because ethical behavior aligns with the core values and ideals that shape their personal and professional identities (Wright et al., Reference Wright, Hassan and Park2016).
Additionally, individual traits may play a role in shaping the likelihood of public employees engaging in dishonest and corrupt behaviors. Cadot (Reference Cadot1987) showed that risk is a parameter of the decision to engage in corrupt acts – lower degree of risk aversion is associated with more corruption. Public employees have traditionally been stereotyped as risk-averse individuals (Merton, Reference Merton1940; Thompson, Reference Thompson1961; Norris, Reference Norris, Donahue and JS2003). As such, this trait may serve as a deterrent to corruption. Supporting this idea, Gans-Morse et al. (Reference Gans-Morse, Kalgin, Klimenko, Vorobyev and Yakovlev2021) found that students aspiring to public sector careers were less willing to cheat or offer bribes in experimental settings.
The lack of evidence for the direct relationship between corruption perception and corruption intentions and dishonest behaviors highlights the importance of causal testing. Furthermore, my findings also add to the body of knowledge in behavioral sciences by demonstrating that attitudes are more easily influenced than intentions and behaviors. This finding is consistent with several recent studies that attempted to modify behavior by correcting beliefs or providing social reference information but failed to do so (Tasoff and Letzler, Reference Tasoff and Letzler2014; Christensen and Wright, Reference Christensen and Wright2018; Kristal and Whillans, Reference Kristal and Whillans2020). For scientific ideas to be endorsed, they must be robust. They must be testable, and they must inspire the confidence of a skeptical audience (Crandall and Sherman, Reference Crandall and Sherman2016). Only when certain events recur in accordance with rules or regularities, as is the case with repeatable experiments, can ideas be endorsed to inform and design real-world policies. It is therefore important that public administration scholars are committed to the rigor needed for causal testing of theoretical relationships.
Limitations
The findings reported here should be considered in the light of some limitations. The first limitation pertains to the samples of my studies. My samples consist of public servants from Anglo-Saxon nations in which corruption is less prevalent compared to countries where corruption is endemic. If preexisting beliefs are shaped by one’s sociocultural environment, then the norms embedded in a country and the proportion of people who adhere to the norm could reinforce or undermine such beliefs (Barr and Serra, Reference Barr and Serra2010). Relatedly, Barfort et al. (Reference Barfort, Harmon, Hjorth and Olsen2019) found that more honest individuals self-select into the Danish public sector, the world’s least corrupt country, whereas Hanna and Wang (Reference Hanna and Wang2017) and Banerjee et al. (Reference Banerjee, Baul and Rosenblat2015) found the opposite effect in India, a country characterized by high prevalence of corruption. Future studies could seek to replicate the current study in a context of high corruption prevalence where preexisting beliefs and stereotypes regarding public sector corruption are stronger.
Another context that limits the generalizability of the findings is the diversity of public sector occupations. Different types of public employees encounter distinct features of public organizations that may shape their exposure to dishonest and corrupt behaviors. Scholars have highlighted that the nature of street-level interactions and public service delivery may affect the cost of honesty and the incentives for corruption (Rose and Peiffer, Reference Rose and Peiffer2016; Sundström, Reference Sundström2016; Nieto-Morales et al., Reference Nieto-Morales, Peeters and Lotta2024). In this study, we focused on public employees broadly without distinguishing between street-level bureaucrats and non-street-level bureaucrats. Future research could further disaggregate the public sector workforce to explore how specific features of public sector motivate corruption.
Another possibility is that the die roll game is a low stakes task and participants did not feel motivated to perform well. However, I am unconvinced that this is likely. First, the studies replicated the mean cheat rate obtained in average cheat rate of the United Kingdom in Olsen et al. (Reference Olsen, Hjorth, Harmon and Barfort2019) – the only Anglo-Saxon nation included in their sample (Olsen et al. (Reference Olsen, Hjorth, Harmon and Barfort2019): 0.26, Study 1: 0.22, Study 2: 0.26). Second, I offered participants a generous incentive structure, including a bonus for each correct die roll guess and a flat fee for participation, which corresponded to a payout rate of at least £6 per hour without bonuses and up to £24 per hour. The minimum pay for studies on Prolific is £6 per hour. Furthermore, Abeler et al. (Reference Abeler, Nosenzo and Raymond2019) also found that, across 90 studies with payout rates ranging from cents to US$50, participants lie very little and refrain from lying maximally.
Another limitation pertains to the lack of mundane realism in these experiments. I tried to include tasks that varied in levels of mundane realism. Designing research is inevitably an exercise of trade-offs. The high internal validity inherent to experiments allows for strong causal conclusions by isolating the effects of a treatment. Experiments or studies that do not allow for random assignment of participants to groups cannot minimize endogeneity concerns and are, therefore, unable to make strong causal claims (Hassan and Wright, Reference Hassan and Wright2020). As argued by McDermott (Reference McDermott2002), what holds greater significance for experimental control and internal validity is subjects’ engagement with the underlying process, rather than how realistic an experiment is. My priority in these experiments is to capture obvert behaviors and intentions related to corruption while making sure that the tasks still adequately capture participants’ attention and engage with the underlying psychological processes.
Finally, it is valid to consider whether the findings might be influenced by demand effects – bias arising when participants infer the experiment’s purpose and adjust their response to align with or counter the hypothesis. However, a recent study involving 12,000 participants across five experiments in various political science subfields found that informing participants about the experimenter’s intent did not alter treatment effects (Mummolo and Peterson Reference Mummolo and Peterson2019). Even financial incentives designed to encourage responses in line with researcher expectations failed to consistently produce demand effects. The authors concluded that participants generally have a limited ability to modify their behavior to match researcher expectations. Moreover, across three experiments, I replicated the mean cheat rate observed in the United Kingdom in Olsen et al. (Reference Olsen, Hjorth, Harmon and Barfort2019), despite differences in study design and research questions. This reinforces confidence that the results are not artifacts of demand effects.
Policy implications
Despite limitations, the findings have important implications for anti-corruption information campaigns in the public sector. The findings showed that exposure to stereotype-congruent information can increase public servants’ belief in the stereotype that public servants are generally corrupt. This suggest that constant exposure to this type of information can contribute to an overall deterioration of public sector image and undermine public sector reputation from within the public sector workforce instead of ameliorating corruption. Like Bauhr and Grimes (Reference Bauhr and Grimes2014), my finding questions the assumption of many anti-corruption practices that transparency can induce good behaviors. Bauhr and Grimes (Reference Bauhr and Grimes2014) argued that exposure of corruption may alter perceptions about the extent and entrenchment of corruption in society. Transparency reforms that reveal pervasive corruption breed resignation and withdrawal from public and civic endeavors rather than induce and empower citizens to mobilize for better government. Such effect may similarly occur for public employees who are constantly exposed to corruption information.
This may be more likely for certain groups of public employees. The findings showed that information strongly increased the intentions of individuals with stronger tolerance beliefs to engage in corruption. Transparency reforms may interact with these beliefs to produce corruption among public employees. While I do not disparage the principle of transparency, nor do I disprove the contention that transparency can contribute to enhancing accountability and limiting the extent of corruption, my findings merely indicate that transparency reforms alone cannot be expected to ignite a broad and general process of accountability that will ultimately curb corruption.
An alternative solution lies in changing the culture or norm within the public sector or public sector organization. Given that one’s beliefs and attitudes can be shaped by their sociocultural environment, cultivating norms that promote honesty, and ethical practices could alter beliefs about the prevalence and acceptability of corrupt behaviors, ultimately decreasing dishonesty and corruption. For instance, public organizations can promote ethical leadership by appointing leaders known for their integrity. Leaders who communicate ethical expectations, encourage ethical behavior and hold subordinates accountable for misconduct are more likely to attract, select and retain employees who share these values (Wright et al., Reference Wright, Hassan and Park2016). Ethical leaders are also more likely to reward and support employees who prioritize integrity over self-interest (ibid.). Public organizations can also reinforce norms of honesty by implementing regular training sessions on ethics, integrity and anti-corruption.
Finally, my findings sound a call for continued exploration into the effects of preexisting beliefs and information in shaping corruption perception, intent and behavioral responses to corruption. There is a need to move from studies that merely identifies antecedents of corruption such as individual dishonesty and motivation to studies that target a more rigorous understanding of the causal mechanisms so that effective intervention can be designed. I hope that this article serves as a starting point to investigate these effects in more depth, as well as the contextual factors that could affect the elasticity of public servants’ responses to information.
Supplementary material
The supplementary material for this article can be found at https://doi.org/10.1017/bpp.2025.10006.
Acknowledgements
The author would like to thank Dr. Lars Tummers, Dr. Stephan Grimmelikhuijsen, Dr. Elizabeth Linos, Dr. Asmus Leth Olsen and the anonymous reviewers for their invaluable support and feedback on the paper.
Funding statement
The study was supported by the NWO Grant 016.VIDI.185.017.
Competing interests
No potential conflict of interest was reported by the author.


 Open access