


Highlights
-
• Which measures best predict Oral Proficiency Interview (OPI) scores?
-
• Objective measures best predicted language dominance, balance, Spanish and English.
-
• Self-report measures did not substantially increase predictive power.
-
• Self-rated spoken proficiency often misclassified language dominance and balance.
-
• Picture naming was the strongest single predictor of OPI scores.
1. Introduction
Bilingualism can be defined in terms of proficiency, dominance and balance. Proficiency corresponds to how quickly, accurately and easily a person can retrieve words and other linguistic structures and the facility of language use across various communicative contexts (Hulstijn, Reference Hulstijn2011). Proficiency spans four modalities: speaking, understanding, reading and writing. Dominance corresponds to which language is more proficient, and balance refers to relative proficiency in the two languages. This can vary with domain or context and can change over a bilingual’s lifetime, depending on their experiences (Birdsong, Reference Birdsong2014; Treffers-Daller & Silva-Corvalan, Reference Treffers-Daller and Silva-Corvalán2016). Among key variables that influence dominance are age of acquisition of the languages, frequency and context of use, formal education and time immersed in each language.
Measuring language proficiency is fundamental in research on bilingualism and in clinical settings (Hulstijn, Reference Hulstijn2012, Reference Hulstijn and Rebuschat2015; Hyltenstam, Reference Hyltenstam and Hyltenstam2016), but there is no standardized method for measurement despite years of calls for such a tool across multiple related subfields of research on bilingualism (e.g., psycholinguistics, sociolinguistics, language pedagogy, second-language (L2) acquisition; Flege et al., Reference Flege, MacKay and Piske2002; Grosjean, Reference Grosjean1998; Hulstijn, Reference Hulstijn2011; Leclercq et al., Reference Leclercq, Edmonds and Hilton2014). Researchers do not agree on how proficiency should be measured which creates a problem for replicability and generalizability of findings, affects how efficiently the field can move forward and is also an obstacle for comparative analysis across subfields (Olson, Reference Olson2024).
Currently, many researchers rely on self-ratings of proficiency, which can vary from 5- to 10-point Likert scales, where 1 usually represents lowest skill and 5, 7 or 10 represent highest skill (Li et al., Reference Li, Sepanski and Zhao2006). While these scales can quickly and easily provide some estimate of proficiency level, they can also create significant misconceptions. One major obstacle to their validity is their subjectivity: bilinguals report how they think they should perform instead of how they perform objectively (Hakuta & D’Andrea, Reference Hakuta and D’Andrea1992; Hulstijn, Reference Hulstijn2012; Li & Zhang, Reference Li and Zhang2021; Ross, Reference Ross1998; Winke et al., Reference Winke, Zhang and Pierce2023). Moreover, self-assessments are vulnerable to the variability that exists across individuals and questionnaires: which questions are asked and how they are framed can be interpreted differently across different groups of bilinguals (e.g., varying in language combination; Tomoschuk et al., Reference Tomoschuk, Ferreira and Gollan2019). Self-assessments are subjectively biased, and while appropriate for some purposes (Stansfield et al., Reference Stansfield, Gao and Rivers2010), they do not rise to the level of precision that is typically required in research for measurement of psychological constructs.
The Language Experience and Proficiency Questionnaire (LEAP-Q; Marian et al., Reference Marian, Blumenfeld and Kaushanskaya2007) is one of the most regularly used questionnaires to collect proficiency data, along with few others (e.g., the Language History Questionnaire (LHQ), Li et al., Reference Li, Sepanski and Zhao2006; the Language Use Questionnaire (LUQ), Kastenbaum et al., Reference Kastenbaum, Bedore, Peña, Sheng, Mavis, Sebastian-Vaytadden and Kiran2019; the Bilingual Language Profile (BLP), Birdsong et al., Reference Birdsong, Gertken and Amengual2012; and the Language and Social Background Questionnaire (LSBQ), Anderson et al., Reference Anderson, Mak, Keyvani Chahi and Bialystok2018; Luk & Bialystok, Reference Luk and Bialystok2013). These vary in how proficiency questions are asked. For example, in the LEAP-Q, the self-rating scale ranges from 0 (none) to 10 (perfect) and only asks about speaking, understanding spoken language and reading. The LHQ asks the same questions, with the added modality of writing and uses a different scale with different labels at each level of assessment, from 1 (almost none) to 7 (like a native speaker). Such differences hinder the ability to compare and replicate results across studies. The predictive power of self-ratings in the LEAP-Q was examined against several objective measures of proficiency (reading fluency, oral comprehension, passage comprehension, productive vocabulary, sound awareness, picture naming and grammaticality judgments; Marian et al., Reference Marian, Blumenfeld and Kaushanskaya2007). Among eight factors that emerged through factor analysis, the one that explained most of the variance (25.3%) included 17 self-report measures on the first-language (L1) and on the second language (L2), to explain relative balance (Marian et al., Reference Marian, Blumenfeld and Kaushanskaya2007). However, most of the proficiency evaluations conducted for research or clinical purposes use a much smaller subset or just one question – Which language do you prefer? – likely leading to limited power to accurately predict proficiency from self-ratings in these contexts. This issue is compounded with the large variability across bilinguals, notably in terms of cultural backgrounds, age-groups and language combinations.
Previous work suggests that Chinese–English and Spanish–English bilinguals do not interpret a self-rating scale in the same manner. In a study that evaluated over 1000 bilinguals, participants self-rated their spoken proficiency in the two languages they knew (Chinese and English or Spanish and English), on a scale from 1 to 7 (Tomoschuk et al., Reference Tomoschuk, Ferreira and Gollan2019). All bilinguals also completed an objective proficiency test, the Multilingual Naming Test (MINT; Gollan et al., Reference Gollan, Weissberger, Runnqvist, Montoya and Cera2012). Groups differed significantly on MINT scores at the same level of self-rated speaking proficiency. For example, at a rating of 7 for Chinese speaking proficiency, the Chinese–English bilinguals on average scored 59 out of 68 on the Chinese MINT (SD = 6.1), but for Spanish speaking proficiency in Spanish–English bilinguals, a 7 on average corresponded to just 51 out of 68 on the Spanish MINT (SD = 8.0) – more than one pooled standard deviation below the Chinese–English bilinguals. On the other end of the scale, at a self-rating of 3, the trend was reversed: Chinese–English bilinguals scored 30.1 out of 68 on average on the MINT (SD = 12.0) and Spanish–English bilinguals, 42.1 out of 68 (SD = 9.9) – about one pooled standard deviation above the Chinese–English bilinguals. Thus, the use of self-ratings of proficiency level as the sole measure of bilingualism is particularly problematic in studies that compare bilinguals of different language combinations, dominance profiles and age-groups (see discussion in Neveu & Gollan, Reference Neveu and Gollan2024b).
Moreover, while previous work focused on measuring proficiency in L2 learners (Leclercq et al., Reference Leclercq, Edmonds and Hilton2014), less research focused on measuring proficiency in heritage bilinguals (e.g., Gertken et al., Reference Gertken, Amengual, Birdsong, Leclercq, Edmonds and Hilton2014). To date, no study tried to determine which of a variety of commonly used measures in psycholinguistic research are most precise and efficient for predicting bilingual language proficiency. Establishing which measure of proficiency is consistent across different groups of bilinguals and matched for difficulty across languages is difficult to achieve for many reasons (Hulstijn, Reference Hulstijn2011; Peña, Reference Peña2007). As a gold standard, in the present study, we adopted a measure of spoken language proficiency: the Oral Proficiency Interview (OPI), based on methods developed by the American Council on the Teaching of Foreign Languages (ACTFL). This choice can be debated (Leclercq et al., Reference Leclercq, Edmonds and Hilton2014) but was appropriate in the present study given that many of the Spanish–English bilinguals tested herein were educated primarily in English, which would make spoken rather than written Spanish the more familiar and representative modality for testing this population. The interview has been adapted for use in research settings (Garcia & Gollan, Reference Garcia and Gollan2022, Reference Garcia and Gollan2025; Gollan et al., Reference Gollan, Weissberger, Runnqvist, Montoya and Cera2012). The adapted OPI has a picture description and five questions (see Appendix A), beginning with easy topics and becoming increasingly more difficult to answer. The interviewee needs to use different tenses and syntactic structures and, on the last two questions, must formulate an argument, defend it and its opposing view, as an educated native speaker of the language would be able to do. The interviewer and additional raters score the interview on a 10-point scale with detailed descriptions of proficiency at each level. The OPI typically takes at least 10 minutes to administer in each language (it varies depending on how verbose an interviewee is) and requires a similar, if not longer amount of time to score by listening to the interview recording.
The OPI can be considered a gold standard because it has high face validity and is easily adapted for administration in many different languages. However, even though the OPI is arguably the best way to measure proficiency and degree of bilingualism accurately, it is rarely feasible to administer in research or clinical settings due to time constraints and lack of individuals qualified to administer and score an OPI in both languages for bilinguals. This study was designed to determine which brief objective measure(s) of proficiency, already widely used in research and in clinical settings, best predict(s) the gold standard. We also examined the same question, but with self-report measures only and with a combination of both self-report and objective measures to determine what the best possible self-report predictor of proficiency is (without any objective measure) and whether participant self-ratings provide any information that is not already captured by the brief objective measures. Finally, because the use of self-ratings is so prevalent in research and clinical settings, we explored additional questions to document their limitations and to better understand some of the more common self-rating profiles. We asked whether self-rated language dominance would match OPI classifications of dominance and whether bilinguals who consider themselves to be balanced (i.e., with similar levels of proficiency in both languages) are in fact more balanced on objective tests than bilinguals who say one language is dominant. We also asked whether bilinguals who said they do not function “like a native speaker” in either language are in fact less proficient in any objective measure compared to bilinguals who said they do.
2. Methods
2.1. Participants
Participant characteristics are summarized in Table 1. We recruited 80 Spanish–English bilinguals from the undergraduate population at the University of California, San Diego (UCSD). All participants were tested via Zoom. Most undergraduates at UCSD learned Spanish at birth but are English-dominant. To ensure we had at least some representation in our dataset of different language dominance profiles, we continued recruiting until we had 20 participants who scored higher in Spanish than in English on the MINT Sprint 2.0 (described later). Study procedures were approved by the Institutional Review Board at UCSD.
Participant characteristics and scores on objective measures, separated according to language dominance, as determined by OPI scores

Note: Bolded values represent significant p-values.
a A chi-square test was performed as this variable is categorical.
b Welch’s t-test was performed as variances were unequal.
c Sum score across four categories.
d Sum score across three letters.
e Hoversten lexical decision task.
Language dominance as shown in Table 1 was determined by OPI scores: 52 bilinguals were English-dominant, 24 were Spanish-dominant and only 4 were perfectly balanced (i.e., got the same OPI score in both languages). English-dominant bilinguals were first exposed to English on average two-and-a-half years earlier than bilinguals in the other two groups. Spanish-dominant bilinguals on average used Spanish more often when growing up and self-rated their proficiency (averaged across speaking, understanding, writing and reading) in Spanish as higher than bilinguals in the other two groups. Average self-rated proficiency in English was marginally different across the three groups.
2.2. Materials
Participants completed a language background questionnaire to provide information about their language learning history and demographic data (see Table 1). We used answers to single questions in our quantitative analyses as these, if accurate, would constitute the fastest and simplest proficiency measures and are what is most often reported in psycholinguistic studies of bilinguals. Objective proficiency measures included, besides the OPI, and described in detail the following: (a) a fast administration version of the MINT, that is, the MINT Sprint 2.0 (Gollan et al., Reference Gollan, Garcia, Stasenko, Murillo, Kim, Galasko and Salmon2023), (b) a category fluency task, (c) a letter fluency task and (d) a lexical decision task (LDT).
The OPI was designed based on how the ACTFL evaluates spoken language proficiency on a scale from 1 to 10 (see Appendix B). The interview consisted of two sets of five questions and two picture descriptions so that each participant was asked different questions and described a different picture in each language (see Appendix A). The questions were based on Garcia and Gollan (Reference Garcia and Gollan2022) and Gollan et al. (Reference Gollan, Weissberger, Runnqvist, Montoya and Cera2012) but updated to current events. Participants were interviewed by a Spanish–English bilingual experimenter, who assigned a rating score immediately after the interview, along with three other native Spanish–English bilingual raters and one rater with a Ph.D. in Translation Studies, with English and Spanish as working languages. We took the average of all scores to get the OPI score. In eight cases, a rater’s score of the Spanish OPI differed by two or more points from the average, and raters were then asked to listen again to the interview and adjust their score up or down based on whatever seemed accurate (without revealing what the group average score was nor whether the initial score was “too high” or “too low”). In all but two cases, the second listen resolved outlying ratings in the direction of the average rating. For the two cases that went in the other direction, a sixth OPI rater (another native Spanish–English bilingual) listened to the recordings and provided an additional rating. This step resolved outlying ratings such that all scores were within two points of the average per participant across raters.
In the MINT Sprint 2.0, participants were shown 80 color pictures on a grid simultaneously (with 10 pictures in each row), and they were asked to name them in order, as quickly and accurately as they could, from top left to bottom right on a first pass attempt under time pressure (they are told they have only 3 minutes, but are not stopped if they need more than 3 minutes to get through the grid). Participants were then given a second pass cue to “try again” to name any items they skipped or missed on the first pass. The MINT Sprint 2.0 materials and instructions are available at https://osf.io/7r9mq/.
In the category fluency task, participants were given the name of a category and asked to produce as many exemplars as they could in 60 seconds. Each participant completed four categories in each language with counterbalanced assignment of each group of four categories across languages between participants (animals, body parts, furniture and vegetables, clothing, fruits, transport and occupations). We applied strict and lenient scoring through team consensus (e.g., “TV mount” in the furniture category counted as 0 in strict scoring but 1 in lenient scoring). Correlations between the OPI and strict versus lenient scores were not significantly different; therefore, we retained the strict scores in our analyses.
The structure of the letter fluency task was similar to that of category fluency. Participants were given a letter and were asked to produce as many words (excluding proper names) as possible starting with that letter in 60 seconds. Each participant completed three letters in each language (F, A and S in English and P, M and R in Spanish; Artiola i Fortuny et al., Reference Artiola i Fortuny, Heaton and Hermosillo1998). We followed the same scoring procedure as for the category fluency task, except that error types did not require strict versus lenient scoring.
The LDT was an extended version of the LexTALE, which originally had 40 words and 20 nonwords (Lemhöfer & Broersma, Reference Lemhöfer and Broersma2012), and the Spanish version which originally had 60 words and 30 nonwords (Izura et al., Reference Izura, Cuetos and Brysbaert2014). Our version was created by the sixth author (henceforth Hoversten-LDT or H-LDT; Hoversten et al., Reference Hoversten, Brothers, Swaab and Traxler2017) and had 150 items in each language (50 nonwords and 100 real words), including all the words in the originally published versions of the tests. The rationale for extending both versions was to improve matching across English and Spanish versions in length and difficulty (the words in the English version were lower frequency and longer on average than those in the Spanish version, which also included a broader range of item difficulty). Nonwords were also longer in the English than in the Spanish version. All three issues were resolved in the H-LDT. The additional nonwords were created using Wuggy, a multilingual pseudoword generator (Keuleers & Brysbaert, Reference Keuleers and Brysbaert2010), with the original words entered as seed data and the appropriate language selected. At least three native speakers of English and Spanish examined the lists of nonwords generated by the program and selected the most plausible ones. The new nonwords were matched in length to the nonwords in the original version of the other language (e.g., 20 new Spanish nonwords were created to match the 20 English nonwords in the original LexTALE). The Subtlex-US and Subtlex-ESP databases were used to collect frequency data on real words. The H-LDT was administered on a computer (programmed in PsychoPy for presentation; Peirce et al., Reference Peirce2007). During the task, each item appeared one at a time on the screen. The trial sequence consisted of a 200-ms blank screen, a 500-ms fixation cross after which the word appeared for 4000 ms or until the participant responded via button press (i.e., with a “yes” by depressing the “K” key (QWERTY layout) if they thought the word was a real word in the language tested or “no” by depressing the “S” key if they thought it was a nonword). Participants were instructed that they would be penalized for guessing incorrectly. The materials for the H-LDT can be found here: https://osf.io/t2ebk/.
2.3. Procedure
All participants completed the questionnaire first and then completed all the objective measures first in the language they indicated as dominant as per average of self-rated proficiency on the questionnaire. The order of tasks within each block was rotated between participants (the first participant started with category fluency, then letter fluency, MINT Sprint 2.0, OPI and H-LDT; the order then rotated in a Latin square design for the next five participants before repeating the same order of tasks again). Within participant, however, the task order was the same in both languages to maximize the gap between completing the same task in each language.
2.4. Analyses
The analyses below focus on four questions in order of interest to determine which measure most accurately predicts (a) which language is dominant, (b) the extent to which proficiency in the two languages is balanced, (c) proficiency in Spanish (the language not dominant in the environment and which varied the most between participants) and (d) proficiency in English (the required language for attendance at UCSD and that therefore varied the least between participants). To assess the first two questions (a and b), we derived a dominance and a balance score for each objective measure.
Dominance scores were calculated for each measure by subtracting the Spanish score from the English score (English minus Spanish). For example, a bilingual with a score of 9 out of 10 for the English OPI and 7 out of 10 on the Spanish OPI yields a positive dominance score of 2 (9 minus 7) which indicates some degree of English dominance (while a negative score would indicate Spanish dominance, and a score of 0 perfectly balanced proficiency in the two languages).
Balance scores were derived by dividing the lower score by the higher score on the same measure completed in both languages. In our example above, it would be 7 divided by 9, meaning that the person is about 78% bilingual (see Garcia & Gollan, Reference Garcia and Gollan2022; Gollan et al., Reference Gollan, Weissberger, Runnqvist, Montoya and Cera2012). Scores closer to one indicate more balanced proficiency across languages, whereas scores closer to zero indicate less balanced proficiency level; that is, one language is more strongly dominant.
We then ran correlations between the OPI scores from four categories (dominance, balance, Spanish and English) and all scores across these categories for all the other measures (see Table 2). For the MINT Sprint 2.0, we examined correlations between OPI scores and four MINT Sprint 2.0 sub-measures: first pass accuracy, total score accuracy (first plus second pass accuracy), measure of percent resolved pictures in the second pass out of pictures not named in the first pass and a first pass efficiency scores (time spent naming in minutes divided by proportion correct answers; Bruyer & Brysbaert, Reference Bruyer and Brysbaert2011). The first pass and total scores were the most robustly correlated with OPI scores (see Supplementary Section C1), and because in previous work, the total score was also most sensitive clinically (for distinguishing patients from controls; Gollan et al., Reference Gollan, Garcia, Stasenko, Murillo, Kim, Galasko and Salmon2023), we used that score in the analyses below unless otherwise mentioned. For category and letter fluency, we examined the correlations with OPI scores at 15-, 30-, 45- and 60-second windows and scores at 30 seconds often were the most robustly correlated with OPI scores, and the 30-second score has often been used to measure bilingual proficiency level (Bice & Kroll, Reference Bice and Kroll2021; Navarro-Torres et al., Reference Navarro-Torres, Garcia, Chidambaram and Kroll2019, Reference Navarro-Torres, Dussias and Kroll2023; Zirnstein et al., Reference Zirnstein, van Hell and Kroll2018, Reference Zirnstein, van Hell and Kroll2019); therefore, we used the 30-second scores for both category and letter fluency in the analyses below (see Supplementary Sections C2 and C3). Raw total H-LDT scores were the numerically highest predictors of Spanish and English OPI scores (higher than the original LexTALE and Lex-ESP items; see Supplementary Section C4). The raw scores are also easier to calculate (relative to adjusted scores suggested by Huibregtse et al., Reference Huibregtse, Admiraal and Meara2002 and Lemhöfer & Broersma, Reference Lemhöfer and Broersma2012); therefore, we used the raw H-LDT scores in the analyses described next.
Pearson’s correlations [and 95% confidence intervals] between the four OPI measures of interest (dominance, balance, Spanish and English) and objective or self-report measures (N = 80)

Note: The strongest predictor of each score is bolded. *p < .05, **p < .01, ***p < .001.
a The dominance score is calculated as English score minus Spanish score.
b The balance score is calculated as lower score divided by higher score.
c The value shown is for the correlation between the MINT Sprint 2.0 efficiency score (which was the strongest predictor of) and English OPI scores (see Supplementary Section C1, Figure 1.4).
d The value shown is for the correlation between the category fluency scores at 45 s (which was the strongest predictor of) and English OPI scores (see Supplementary Section C2, Figure 2.4).
e The value shown is for the correlation between letter fluency score at 15 s (which was the strongest predictor of) and English OPI scores (see Supplementary Section C3, Figure 3.4).
f All participants learned Spanish from birth (values of 0); therefore, we used age of regular use, which varied more than age of acquisition.
g For 8 bilinguals, percent use between English and Spanish did not add up to 100.
h Correlations between OPI scores and percent use while growing up scores yielded stronger correlations than with current percent use scores; therefore, we only show percent use while growing up scores here (see Supplementary Section D).
For self-report measures, we followed the same process and examined correlations between OPI scores (dominance, balance, Spanish and English) and all variables across these categories for all the other measures (see Table 2). Specifically, we compared self-rated speaking proficiency versus average self-rated proficiency (collapsed across speaking, listening, writing and reading). Average self-rated proficiency was overall more robustly correlated with OPI scores, so we retained this variable in further analyses described next. We followed the same process with age of first exposure versus age of regular use, percent use of the language currently versus growing up and raw immersion years versus proportion of life immersed (all latter variables were retained) (see Supplementary Section D and Table 2).
We next ran linear modelsFootnote 1 using forward selection. Forward selection compared a base model with a full model to select which predictors explained a significant amount of variance in the dependent OPI score. The base model was built with the single most strongly correlated objective or self-report measure and its analogous OPI score. For example, comparing Spanish category fluency, letter fluency, the MINT total score and the H-LDT, the Spanish MINT total score was most robustly correlated with Spanish OPI scores and the base linear model predicting Spanish OPI scores included only the Spanish MINT total score, while the full model was built with all four objective measures. We repeated the same procedure with self-report measures only and then with both objective and self-report measures combined (see Supplementary Section A for a visual summary of our analyses). The rationale was to examine how unbiased objective measures versus biased self-report measures fare in predicting proficiency and whether combining both types leads to higher accuracy in predicting proficiency as measured by OPIs.
We scaled each predictor variable as they were on different scales and centered them to reduce standard error for the intercept (predictions are more precise around the mean values of predictors, rather than extreme values of predictors). Forward selection examined the extent to which the Aikake Information Criterion (AIC) decreased by adding predictors present in a model with all predictors under consideration (full model) compared to a single predictor model (base/start model). The output provided the most parsimonious model (best model) to explain variance in the outcome variable (OPI scores) – this was the model with the lowest AIC. Order of predictors in the model syntax did not affect the calculation.
This analysis was repeated including self-report measures only and again with both objective and self-report measures together. We additionally checked for multicollinearity between predictors using the variance inflation factor measure. All values for each predictor in each model were under five, suggesting the level of multicollinearity when present was not critical.
Foreshadowing the results, we found that self-reports were generally not as strongly correlated with OPI scores, self-report measures never outperformed objective measures in regression models that included either self-report or objective measures, and in combined models, self-report measures added no predictive power, or just 2–3% predictive power, for explaining OPI scores. Additionally, while only 4 of 80 bilinguals were classified as perfectly balanced (having equal OPI scores in the two languages), a majority of bilinguals (42 out of 80) classified themselves as balanced (having equal self-ratings for speaking). Thus, we conducted three additional exploratory analyses to investigate individual differences between self-rating classifications and OPI scores. We first compared dominance groups as determined by the OPI (balanced, English-dominant and Spanish-dominant) in terms of self-rated speaking proficiency and average self-rated proficiency versus OPI scores. We then examined whether self-rated balanced bilinguals were indeed more balanced on objective measures. Finally, we examined whether a lack of a 7 rating on spoken self-rated proficiency was a disadvantage compared to one or two 7 ratings in each language. To this end, we divided bilinguals into three groups: those who assigned themselves a 7 (the maximum possible rating in our scale) for speaking in both languages (Two 7s), a 7 in at least one language (One 7) and those who did not give themselves a 7 in either language (No 7s).
3. Results
The best predictor of OPI dominance scores was the MINT Sprint 2.0 dominance score followed by the Spanish H-LDT score, Spanish category fluency score and least predicted by the letter fluency dominance score (see Table 2). The order of predictors was similar for OPI balance and OPI Spanish, but was quite different for English, in which the English MINT Sprint 2.0 first pass efficiency score (completion time in minutes/proportion correct on the first pass) was the best predictor, followed by English category fluency score, letter fluency dominance score and finally English H-LDT. The “analogous” measures (e.g., a dominance score predicting OPI dominance score) were not always the strongest predictor – but close to strongest if not (see Supplementary Sections C and D). Among the four scores of interest, the language dominance score and Spanish proficiency were easiest to predict overall, followed by balance and then English proficiency, which was most difficult to predict with only two correlations above .3 (with one of these being the correlation between the MINT Sprint 2.0 efficiency score and the English OPI score (see Table 2, footnote c).
We next describe the best models resulting from forward selection, using objective measures only, self-report measures only and a combination of both, to predict OPI dominance, balance, Spanish and English scores.
3.1. Predicting language dominance
The dependent variable was skewed to the right: applying a base-10 log-transformation and adding a constant of three to avoid negative values removed the skew.
Objective measures only. The best model predicting OPI dominance scores retained the MINT Sprint 2.0 and H-LDT dominance scores (English total score minus Spanish total score). Higher MINT Sprint 2.0 dominance scores predicted higher OPI dominance scores (explaining 28% additional varianceFootnote 2 compared to the same model without MINT Sprint 2.0 dominance scores; b = 0.09; back-transformed b = 1.78, SE = 0.02, t = 5.43, η p2 = 0.28, p < .001; see Figure 1 with untransformed variables, top left panel). The effect of the H-LDT was not significant (b = 0.02; back-transformed b = 1.95, SE = 0.02, t = 1.42, η p2 = 0.03, p = .16). Visual inspection of model assumptions was satisfactory. We re-ran analyses removing one extreme point and one point with potential leverage, and results remained unchanged.
Correlations between MINT Sprint 2.0 and OPI scores for language dominance, balance, Spanish and English. Different color dots represent participants classified as balanced (n = 4), English-dominant (n = 52) or Spanish-dominant (n = 24), as determined by OPI scores.

Self-report measures only. The best model predicting OPI dominance scores included dominance scores derived from average self-rated proficiency, age of regular use and proportion of life immersed. Higher average self-rated proficiency dominance scores predicted higher OPI dominance (explaining 18% additional variance compared to the same model without average self-rated proficiency dominance scores; b = 0.05, back-transformed b = 1.87, SE = 0.01, t = 4.15, η p2 = 0.18, p < .001). A higher age of regular use of the Spanish language compared to the English language led to stronger English dominance as per the OPI score (explaining 17% additional variance compared to the same model without the dominance scores for age of regular use of the languages; b = −0.05, back-transformed b = 1.89, SE = 0.01, t = −3.95, η p2 = 0.17, p < .001). A higher proportion of life immersed in English compared to Spanish led to stronger English dominance as per the OPI score (explaining 8% additional variance compared to the same model without the dominance score for proportion life immersed in each language; b = 0.03, back-transformed b = 1.92, SE = 0.11, t = 2.56, η p2 = 0.08, p < .05). Visual inspection of model assumptions revealed potential issues with linearity and homoscedasticity, even after verifying the distribution of all model variables. We re-ran analyses removing one extreme point, and results remained unchanged.
Combining objective and self-report measures. We built a new linear regression model with forward selection predicting the OPI dominance only keeping the objective and self-report predictors that were significant in the previous best models. The best fit model retained the MINT Sprint 2.0 dominance score, the dominance score for age of regular use of the languages and average self-rated proficiency dominance score. Higher MINT Sprint 2.0 dominance scores predicted higher OPI dominance (explaining 29% additional variance compared to the same model without MINT Sprint 2.0 dominance scores; b = 0.08, back-transformed b = 1.80, SE = 0.01, t = 5.56, η p2 = 0.29, p < .001). A higher age of regular use of the Spanish language compared to the English language led to stronger English dominance as per the OPI score (explaining 7% additional variance compared to the same model without the dominance scores for age of regular use of the languages; b = −0.03, back-transformed b = 2.06, SE = 0.01, t = −2.45, η p2 = 0.7, p < .05). The effect of average self-rated proficiency dominance score (b = 0.02, SE = 0.01, t = 1.73, η p2 = 0.02, p = .09) was not significant. Visual inspection of model assumptions revealed potential issues with linearity and homoscedasticity, even after verifying the distribution of all model variables.
3.2. Predicting balance
The dependent variable and all independent variables were skewed to the left: we reflected the data, added adapted constants to avoid negative values and applied a base-10 log-transformation to all. This transformed each variable to a more normal distribution.
Objective measures only. The best model predicting the OPI balance scores included the MINT Sprint 2.0 and H-LDT balance scores. Higher MINT Sprint 2.0 balance scores predicted higher OPI balance (explaining 11% additional variance compared to the same model without MINT Sprint 2.0 balance scores, b = 0.17, SE = 0.05, t = 3.15, η p2 = 0.11, p < .01; see Figure 1 with untransformed variables, top right panel). The effect of the H-LDT was marginal, such that higher H-LDT balance scores tended to predict higher OPI balance (explaining 4% additional variance compared to the same model without the H-LDT balance scores, b = 0.09, SE = 0.05, t = 1.75, η p2 = 0.04, p = .08). Visual inspection of model assumptions revealed potential issues with linearity, even after verifying the distribution of all model variables. We re-ran analyses removing three extreme points and one point with potential leverage. Results remained relatively comparable: the MINT Sprint 2.0 now explained 12% additional variance and the effect of H-LDT became significant, now explaining 7% additional variance.
Self-report measures only. The best model predicting OPI balance scores included the balance scores for average self-rated proficiency and proportion of life immersed. Higher balance for average self-rated proficiency predicted higher OPI balance (explaining 12% additional variance compared to the same model without average self-rated Spanish proficiency b = 0.14, SE = 0.04, t = 3.30, η p2 = 0.12, p < .01). More balanced immersion predicted less balance in OPI scores (explaining 10% additional variance compared to the same model without proportion life immersed; b = −0.12, SE = 0.04, t = −2.96, η p2 = 0.10, p < .01). Visual inspection of model assumptions revealed potential issues with linearity and homoscedasticity, likely due to the extreme skew of the proportion of life immersed variable that could not be transformed to a more normal distribution. We therefore did not attempt outlier removal.
Combining objective and self-report measures. We built a new linear regression model with forward selection predicting the OPI balance only keeping the objective and self-report predictors that were significant in the previous best models. The best fit model retained all predictors. Higher MINT Sprint 2.0 balance scores predicted higher OPI balance (explaining 19% additional variance compared to the same model without MINT Sprint 2.0 balance scores, b = 0.18, SE = 0.04, t = 4.21, η p2 = 0.19, p < .001). The main effect of average self-rated proficiency balance score was marginal, b = 0.07, SE = 0.04, t = 1.78, η p2 = 0.04, p = .08), and the main effect of proportion of life immersed balance score was not significant (b = −0.07, SE = 0.04, t = −1.65, η p2 = 0.03, p = .10). Visual inspection of model assumptions again revealed potential issues with linearity and homoscedasticity, as described above.
3.3. Predicting Spanish proficiency
The dependent variable was skewed to the left: we reflected the data, added a constant and applied a base-10 log-transformation, which led to a more normal distribution of the variable.
Objective measures only. The best model predicting OPI Spanish scores included the Spanish LDT, the MINT Sprint 2.0 and the category fluency task scores. Higher Spanish H-LDT scores predicted higher OPI Spanish scores (explaining 18% additional variance compared to the same model without the Spanish H-LDT, b = −0.06, back-transformed b = 9.84, SE = 0.02, t = −4.04, η p2 = 0.18, p < .001). Higher MINT Sprint 2.0 Spanish scores predicted higher OPI Spanish scores (explaining 9% additional variance compared to the same model without MINT Sprint 2.0 balance score, b = −0.05, back-transformed b = 9.82, SE = 0.02, t = −2.74, η p2 = 0.09, p < .01; see Figure 1 with untransformed variables, bottom left panel). Higher Spanish category fluency predicted higher OPI Spanish scores (explaining 8% additional variance compared to the same model without Spanish category fluency, b = −0.04, back-transformed b = 9.79, SE = 0.02, t = −2.61, η p2 = 0.08, p < .05). Visual inspection of model assumptions again revealed potential issues with homoscedasticity. We re-ran analyses removing two points with potential leverage and results remained similar: H-LDT scores now explained 13% variance; MINT Sprint 2.0, 12%; and category fluency, 6%. Visual inspection of assumptions showed no difference compared to the model on the full sample.
Self-report measures only. The best model predicting OPI Spanish scores included proportion of life immersed in Spanish, average self-rated Spanish proficiency, age of regular use of Spanish, and a nonsignificant effect of percent Spanish use growing up. A higher proportion of life immersed in Spanish led to higher OPI Spanish scores (explaining 17% additional variance compared to a model without proportion of life immersed in Spanish, b = −0.06, back-transformed b = 9.84, SE = 0.02, t = −3.89, η p2 = 0.17, p < .001; see Figure 2 with untransformed variables, bottom left panel). Higher average self-rated Spanish proficiency predicted higher OPI Spanish scores (explaining 16% additional variance compared to the same model without average self-rated Spanish proficiency, b = 0.06, back-transformed b = 9.55, SE = 0.02, t = 3.73, η p2 = 0.16, p < .001; see Figure 2 with untransformed variables, top left panel, compared with self-rated speaking proficiency only, top middle panel). Earlier regular use of Spanish predicted higher OPI Spanish score (explaining 7% additional variance compared to the same model without age of regular use of Spanish; b = 0.03, back-transformed b = 9.62, SE = 0.01, t = 2.44, η p2 = 0.07, p < .05; see Figure 2 with untransformed variables, top right panel). Higher percent use of Spanish growing up did not significantly predict higher OPI Spanish scores (b = −0.02, back-transformed b = 9.75, SE = 0.02, t = −1.42, η p2 = 0.03, p = .16; see Figure 2 with untransformed variables, bottom middle panel). Visual inspection of model assumptions again revealed no issues. We re-ran analyses removing two points with potential leverage and results remained similar except that the effect of age of regular use became non-significant. Average self-rated Spanish proficiency now explained 17% of variance and proportion of life immersed in Spanish, 14%.
Correlations between self-report measures and Spanish or English OPI scores. Different color dots represent participants classified as balanced (n = 4), English-dominant (n = 52) or Spanish-dominant (n = 24), as determined by OPI scores.

Combining objective and self-report measures. We built a new linear regression model with forward selection predicting the OPI Spanish score only keeping the objective and self-report predictors that were significant in the previous best models. The best fit model retained all variables. Higher MINT Sprint 2.0 Spanish scores predicted higher OPI Spanish scores (explaining 8% additional variance compared to the same model without MINT Sprint 2.0 balance scores, b = −0.05, back-transformed b = 9.81, SE = 0.02, t = −2.55, η p2 = 0.08, p < .05). Higher Spanish H-LDT scores predicted higher OPI Spanish scores (explaining 7% additional variance compared to the same model without Spanish H-LDT scores, b = −0.04, back-transformed b = 9.79, SE = 0.02, t = −2.33, η p2 = 0.07, p < .05). Higher Spanish category fluency scores marginally predicted higher OPI Spanish scores (explaining 5% additional variance compared to a model without Spanish category fluency, b = −0.03, back-transformed b = 9.77, SE = 0.02, t = −1.94, η p2 = 0.05, p = .06). Earlier age of regular use of Spanish predicted higher OPI Spanish scores (explaining 4% additional variance compared to the same model without age of regular use of Spanish, b = 0.02, back-transformed b = 9.58, SE = 0.01, t = 1.81, η p2 = 0.04, p = .07). The main effect of average self-rated proficiency in Spanish was not significant (b = 0.02, back-transformed b = 9.65, SE = 0.01, t = 1.59, η p2 = 0.03, p = .12). The main effect of proportion of life immersed in Spanish was also nonsignificant (b = −0.02, back-transformed b = 9.65, SE = 0.01, t = −1.57, η p2 = 0.03, p = .12). Visual inspection of model assumptions again revealed no issues.
3.4. Predicting English proficiency
The MINT Sprint 2.0 first pass efficiency score was slightly skewed to the right. We applied a natural log transformation which led this variable to be more normally distributed.
Objective measures only. The best model predicting OPI English scores included the MINT Sprint 2.0 English first pass efficiency score and the category fluency score at 45 s in English. Bilinguals who were less efficient in naming items (i.e., had slower MINT Sprint 2.0 first pass efficiency scores) scored lower on the English OPI (explaining 15% additional variance compared to the same model without MINT Sprint 2.0 English first pass efficiency, b = −0.15, back-transformed b = −0.001, SE = 0.04, t = −3.75, η p2 = 0.15, p < .001; see Figure 1 with untransformed variables, bottom right panel). The higher the category fluency score at 45 s, the higher the OPI English scores (explaining 6% additional variance compared to the same model without category fluency score at 45 s, b = 0.09, SE = 0.04, t = 2.16, η p2 = 0.06, p < .05). Visual inspection of assumptions revealed no issues. We re-ran analyses after removing one point with potential influence. The MINT Sprint 2.0 now explained 12% of additional variance, and the category fluency, 9%.
Self-report measures only. The best model predicting OPI English scores only included age of regular use of English. The later the age at which English was used regularly, the lower the OPI English score (explaining 14% additional variance compared to a model without age of regular use of English, b = −0.14, SE = 0.04, t = −3.54, η p2 = 0.14, p < .001; see Figure 2 bottom right panel with untransformed variables). Visual inspection of assumptions revealed no issues.
Combining objective and self-report measures. We built a new linear regression model with forward selection predicting the OPI English score only keeping the objective and self-report predictors that were significant in the previous best models. The best fit model retained all variables. Higher MINT Sprint 2.0 English first pass efficiency scores predicted lower OPI English scores (explaining 9% additional variance compared to the same model without MINT Sprint 2.0 English first pass efficiency, b = −0.12, back-transformed b = −0.001, SE = 0.04, t = −2.79, η p2 = 0.09, p < .01). Higher English category fluency scores marginally predicted higher OPI English scores (explaining 5% additional variance compared to a model without English category fluency scores, b = 0.08, SE = 0.04, t = 1.99, η p2 = 0.05, p = .05). Age of regular use of English was not a significant predictor of English OPI scores (b = −0.07, SE = 0.04, t = −1.62, η p2 = 0.03, p = .11). Visual inspection of assumptions revealed no issues. We re-ran analyses removing one point with potential influence. The best model now retained only the MINT Sprint 2.0 and the category fluency English scores, with the MINT Sprint 2.0 explaining 12% of additional variance and category fluency, 9%.
The results of the best models derived from linear regression with forward selection models for objective, self-report and combined measures along with total R2 are summarized, respectively, in Table 3 and shown in Figure 3.
Summary of best fit objective, self-report and combined measures models

a The dominance score is calculated as English score minus Spanish score.
b The balance score is calculated as lower score divided by higher score.
c The median for this variable was 0, with n = 67 participants indicating 0, and n = 13 indicating an age between 1 and 5.
Bar plot of models’ multiple R-squared with confidence intervals (shown with error bars) for each predicted OPI score (dominance, balance, Spanish and English) and measures used (self-report only, objective measures only or both combined). Self-report measures never outperformed objective measures and did not measurably improve predictive power.

3.5. Exploratory analyses of individual differences in self-rating categories
Classification of language dominance. Bilinguals who said one language is dominant tended to be more accurate than bilinguals who said they were balanced but gross misclassifications were common; most notably 19% of bilinguals who said they are English-dominant instead were judged by OPI interviewer and raters to be Spanish-dominant (5 of 26 per self-rated speaking proficiency), and similarly, 17% of bilinguals who said they are Spanish-dominant instead were classified as English-dominant with the OPI (2 of 12 per self-rated speaking proficiency; see Table 4).
Number of bilinguals who were classified as balanced, English-dominant or Spanish-dominant by the OPI versus by self-rated spoken or average self-rated proficiency level

Bilinguals’ ability to accurately classify themselves into groups better matched the OPI classification when using self-ratings averaged across all four modalities instead of self-rated of speaking proficiency alone. Looking at the top left and middle panels on Figure 2, the distribution of average self-rated proficiency looks less discrete than speaking proficiency alone (Veríssimo, Reference Veríssimo2021), but what differentiates these measures is that bilinguals who were English-dominant per the OPI were fine to rate themselves a 7 in speaking, but less so in all three other modalities. Fewer bilinguals report being balanced, and a larger portion reported being English-dominant, more in line with OPI scores, but note that many discrepancies remained (e.g., more than 10 times as many bilinguals said they are balanced bilinguals in terms of speaking proficiency than were judged as such by the OPI).
Were self-rated balanced bilinguals more balanced on objective measures? Bilinguals who said their spoken proficiency is balanced tended to be more balanced on objective measures than bilinguals who said they were English-dominant. This was particularly evident on the OPI and MINT Sprint 2.0 (see Figure 4, top, left and middle panels, and Table 5). However, the bilinguals who self-rated as balanced tended to be objectively less balanced than bilinguals who self-reported they are Spanish-dominant, as can be seen especially on the MINT Sprint 2.0 and H-LDT (Figure 4, top, middle and right panels, and Table 5). The bottom two rows of Table 5 suggest that bilinguals who said they are balanced used both languages about equally often during childhood but had been immersed in English for the majority of their life.
Boxplots showing median scores (bolded lines) on balance scores for each of the objective measures in bilinguals who self-rated as balanced, Spanish-dominant or English-dominant for spoken language proficiency. Self-rated Spanish-dominant bilinguals were as balanced as, or more balanced on, objective measures than self-rated balanced bilinguals. Edges of the box are the first (Q1-bottom) and third (Q3-top) quartiles; whiskers represent quartiles Q1–1.5(Q3-Q1) and Q3 + 1.5(Q3-Q1). T-tests were performed against the reference group (balanced).
Note: ns = not significant, *p < .05, **p < .01, ***p < .001.

Comparison of bilinguals who self-rated their spoken proficiency as equal in both languages (balanced), English-dominant or Spanish dominant

Note: See also Figure 4. Bolded values represent significant p-values.
a The balance score is calculated as lower score divided by higher score. A score closer to 1 indicates higher levels of balance, and a score closer to 0 indicates monolingualism.
Is lack of a 7 rating on spoken self-rated proficiency a disadvantage? Did bilinguals who self-rated their proficiency in both languages at the highest possible level (seven – likely a native speaker) indeed have higher proficiency in objective measures? Similarly, did those who did not self-rate as a seven for spoken proficiency in either language have lower proficiency in the objective measures? With the exception of MINT Sprint 2.0 scores (where One 7s had the highest average score), the Two 7s group tended to have higher scores than the No 7s on objective proficiency measures (significantly higher on category and letter fluency). Conversely, the One 7 group resembled the No 7s group more than the Two 7s group (with the exception of the H-LDT scores which resembled that of the Two 7s). These results suggest that rather than the No 7s being disadvantaged in some way, the Two 7s group may have had a subtle advantage in some aspect of spoken proficiency. As Figure 5 suggests, even though there are significant differences between groups on some of the measures (H-LDT, category and letter fluency), distributions of scores tend to overlap more than they differ (unless comparing across extremes, i.e., No 7s versus Two 7s).
Boxplots showing median scores (bolded lines) obtained on the objective measures in whichever language scored higher by bilinguals who self-rated their spoken proficiency at the maximum possible score of seven in neither, one or both languages. Edges of the box are the first (Q1-bottom) and third (Q3-top) quartiles; whiskers represent quartiles Q1–1.5(Q3-Q1) and Q3 + 1.5(Q3-Q1). T-tests were performed against the reference group (no7s).
Note: ns = not significant, *p < .05, **p < .01, ***p < .001.

4. Discussion
The results of this study demonstrated overall superiority of objective over self-report measures. The MINT Sprint 2.0 picture naming test was the single most strongly correlated measure with OPI scores, especially for measuring dominance and balance (confidence intervals hardly overlapped with the single most strongly correlated self-report measure). Numerically, picture naming was also strongest for predicting Spanish and English OPI scores (for the latter, see footnote c in Table 2). Surprisingly, the H-LDT was the second single best measure for predicting dominance, balance and Spanish OPI scores, closely followed by category fluency (Table 2). Among self-report measures, average self-rated proficiency was the single most strongly correlated measure with OPI scores, except for English which was age of regular use. No self-report measure outperformed the MINT Sprint 2.0 as a single predictor for any of the four measures of interest (dominance, balance, Spanish and English).
Table 3 shows a detailed summary of the regression analyses (see also Supplementary Section A for a summary visual of the analyses). Letter fluency was not a significant predictor in any regression model. The MINT Sprint 2.0 explained the most variance in regression models (except for predicting OPI Spanish where the MINT Sprint 2.0 and H-LDT explained comparable amounts of variance). The MINT Sprint 2.0 was especially strong for predicting language dominance. For predicting balance and Spanish, the H-LDT added predictive power, while category fluency also contributed to prediction of Spanish, and only the MINT Sprint 2.0 and category fluency contributed to prediction of English. The total R-squared values for self-report-only models never exceeded that of objective-measures-only models, and average self-rated proficiency explained the most variance for predicting dominance, balance and Spanish, but was not significant for predicting English. Proportion of lifetime immersed in English and/or Spanish (depending on the analogous OPI score) also added predictive power for explaining dominance, balance and Spanish, while the analogous age of regular use score added predictive power for explaining OPI dominance and OPI English scores.
In the combined models, self-report measures increased the proportion of variance explained by just 3 percentage points for dominance and 2 points for Spanish, and self-report measures did not add any predictive power over objective measures for predicting balance or English. The superiority of the MINT Sprint 2.0 was again clear in the combined model of language dominance in which it alone explained 29% of the variance. The MINT Sprint 2.0 also added predictive power in every combined model, which was not true for any other objective or self-report measure (see bottom of Table 3).
Unsurprisingly, English proficiency (which varied less than Spanish proficiency between participants in the present study) was more difficult to predict and patterned differently in a few ways. Specifically, rather than total MINT Sprint 2.0 scores, the first pass efficiency scores (which combine naming speed and accuracy) were most powerful to predict English proficiency, and within category fluency, the 45- instead of 30-second cutoff was best. Objective measures alone explained 44–69% of the variance for predicting dominance, balance and Spanish, but for English, only 23%.
4.1. Which objective measures are best and why?
A priori we would have expected the MINT Sprint 2.0 and category fluency to best predict OPI scores because these tasks arguably bear greater resemblance to naturalistic speech. Like in spontaneous language production, in picture naming and category fluency tasks, the speaker needs to go from concepts (images, categories, thoughts) to words. By contrast, the letter fluency task requires speakers to search the lexicon in ways that are not normally required during speaking, and in fact, this task is more often used in clinical settings as a measure of executive control (e.g., Bose et al., Reference Bose, Patra, Antoniou, Stickland and Belke2022; Shao et al., Reference Shao, Janse, Visser and Meyer2014). Executive control in the letter fluency task would be needed to generate strategies for searching the lexicon in a novel way and to avoid producing semantically related words that come to mind but do not start with the required letter. The letter fluency task is also more vulnerable to language switches and testing order effects compared to a picture naming task (Luo et al., Reference Luo, Luk and Bialystok2010; Sandoval et al., Reference Sandoval, Gollan, Ferreira and Salmon2010; Van Assche et al., Reference Van Assche, Duyck and Gollan2013). Consistent with this view, in the present study, letter fluency at 30s was more strongly correlated between languages (r = .56, p < .001) than category fluency at 30s (r = .26, p < .05), H-LDT total scores (r = .08, p = .50) or MINT Sprint 2.0 total scores (r = −.22, p < .05), which is consistent with the hypothesis that letter fluency measures an aspect of cognitive processing not related to language proficiency. As such, contra previous recommendations (Artiola i Fortuny et al., Reference Artiola i Fortuny, Heaton and Hermosillo1998; Suarez et al., Reference Suarez, Gollan, Heaton, Grant and Cherner2014), we recommend against using the letter fluency task to measure bilingual proficiency (letter fluency produced smaller simple correlations even relative to average self-rated proficiency level; see Tables 2–3 and Supplementary Sections C3 and D).
More surprising was that the H-LDT, which is a relatively shallow measure of lexical processing, was robustly associated with dominance, balance and Spanish OPI scores (see Table 2) and also explained unique variance in regression models for predicting Spanish OPI scores and balance scores (Table 3). Unlike some vocabulary tests which require individuals to identify or produce the correct meaning of individual words, in the LDT, all that is required is the ability to recognize and distinguish real words from nonwords. However, this lack of depth in assessment and also the lack of match in modality between the predictor (word recognition) and the outcome (speaking) (see Uchihara & Clenton, Reference Uchihara and Clenton2023) might have been offset by an advantage which is that a much broader range of items can be included in the LDT, including particularly low-frequency words that might be difficult or impossible to depict in a picture naming test (including abstract words) but comprise a lion’s share of the lexicon (Brysbaert et al., Reference Brysbaert, Warriner and Kuperman2014; Eisenchlas et al., Reference Eisenchlas, Schalley and Guillemin2013; Lupyan & Winter, Reference Lupyan and Winter2018). However, in regressions models that combined the H-LDT with other objective measures, the H-LDT did not improve prediction of language dominance, and in the combined objective and self-report models, it survived only for predicting Spanish OPI scores.
4.2 Is it easier to predict dominance, balance, Spanish-proficiency or English-proficiency?
In the present study, predicting dominance and Spanish proficiency was easier than predicting balance or English proficiency (see also Gollan et al., Reference Gollan, Weissberger, Runnqvist, Montoya and Cera2012). Predicting balance may be more difficult because it requires precise estimation of proficiency level in both languages (how similar proficiency is between the two languages; but see Garcia & Gollan, Reference Garcia and Gollan2022 in which balance was easier to predict in some cases than Spanish), whereas dominance only requires estimating which language is relatively better (without estimating proficiency level itself). In addition, languages are typically used in different contexts and purposes (e.g., Grosjean, Reference Grosjean1989), making it difficult or even impossible to compare them on the same criteria. Previously, we suggested that testing of the same concepts across languages will improve prediction of dominance and balance (in the MINT Sprint 2.0, the same pictures are tested in both languages which may remove noise and improve prediction; Garcia & Gollan, Reference Garcia and Gollan2022; Gollan et al., Reference Gollan, Weissberger, Runnqvist, Montoya and Cera2012, see also Liu & Chaouch-Orozco, Reference Liu and Chaouch-Orozco2024), whereas in category fluency and LDTs, bilinguals were tested on different items in each language. The general superiority of the MINT Sprint 2.0 as summarized earlier seems consistent with this proposal.
Predicting English proficiency was harder because English OPI scores varied little, and most bilinguals had higher proficiency level (a certain level of English proficiency is required to attend UCSD) and may have been better predicted by the efficiency measure, which combined speed and accuracy in completion of the MINT Sprint 2.0 test. In previous work, this efficiency measure was not better than total scores for distinguishing cognitively healthy older monolingual participants from those at risk for Alzheimer’s disease (with an absence of cognitive symptoms but a presence of biomarkers for Alzheimer’s in the cerebrospinal fluid; Gollan et al., Reference Gollan, Garcia, Murillo, Vargas, Pulido and Salmon2024). Measurement of speed reflects the accessibility of words in the lexicon; ability to produce more words per minute is significantly correlated with OPI ratings in both the dominant and the nondominant languages (Garcia & Gollan, Reference Garcia and Gollan2025). Speed may be valuable for discriminating small differences in competencies in highly proficient speakers but might also be measuring cognitive ability (rather than proficiency per se; Hulstijn, Reference Hulstijn2011) which may be more closely related to production of a dominant than a nondominant language (Garcia & Gollan, Reference Garcia and Gollan2025). Thus, the efficiency scores may be particularly useful for predicting dominant language ability in samples with a majority of English-dominant bilinguals (as was the case here) and/or in monolinguals whose one language is presumably even more “dominant” in a sense – that is, hyper-proficient with only very small differences in vocabulary size between individuals but some remaining differences in how quickly they can access the representations needed to produce them.
In addition to this objective measure of processing efficiency, age of regular use of English uniquely predicted English OPI scores. This is perhaps less surprising as all bilinguals in this sample all were exposed to Spanish from birth, and so age of regular use of L2, English, was more critical for explaining later proficiency (e.g., Birdsong, Reference Birdsong1999; Newport, Reference Newport1990, for similar results with accent, see Flege et al., Reference Flege, Munro and MacKay1995) based on the critical/sensitive period hypothesis for language learning. Interestingly here, it was not average self-rated proficiency that weighted most in predicting English proficiency, but instead a variable easier to report (age of regular use of the language). At high levels of proficiency, self-ratings tend to be at ceiling level and so are less informative in comparison.
4.3. Why are objective measures better than self-report measures?
More than half of the participants in the present study self-reported having equal speaking proficiency in their two languages, but bilinguals were rarely rated as perfectly balanced in their OPI scores. One obvious difference between the self-rating scale and the OPI scoring was that the latter included much more detailed description of each proficiency level (which might improve rating accuracy; Li & Zhang, Reference Li and Zhang2021). However, Gollan et al. (Reference Gollan, Weissberger, Runnqvist, Montoya and Cera2012) obtained similar results even though participants in that study (and OPI raters) alike used the same detailed 10-point scale based on ACTFL guidelines to provide self-ratings of proficiency. A critical difference that compromises self-ratings is that OPI raters assigned scores to the same group of participants all performing the same task, whereas individual participants may base self-ratings on idiosyncratic factors relative to other speakers in a variety of different settings and tasks (e.g., if a bilingual only uses Spanish in informal settings, without typically experiencing communication breakdowns, they have every reason to believe they are highly proficient – only bilinguals who had to use both languages in a variety of contexts may be more aware of their proficiency limitations in each language). Note that few bilinguals were balanced according to their OPI scores, and contrary to their self-ratings, even when allowing for a standard error of deviation between scores (n = 4 were perfectly balanced, and only n = 14 were balanced when allowing up to .10 of a difference between OPI scores in the two languages - this .10 gap allowed the smallest possible difference in OPI ratings gap), and this matches a consensus in the field that balanced bilingualism is relatively rare (Grosjean, Reference Grosjean1989; Yip, Reference Yip, Grosjean and Li2013). As such, bilinguals’ self-ratings of proficiency might reflect use patterns more than objective proficiency (see also Hakuta & D’Andrea, Reference Hakuta and D’Andrea1992).
For example, in our study, bilinguals’ self-ratings of percent use of English while growing up (Figure 4 bottom left panel and Table 5) matched their self-rated spoken proficiency: those who said they are balanced used English about half the time (on average 45%) while growing up; the English-dominant group, about 60% of the time; and the Spanish-dominant group, about 33% of the time. These classifications of dominance and balance did not match OPI classifications (see Table 4). By contrast, average proportion of life immersed in English, which was also self-reported but may be easier to report accurately, better matched OPI classifications (balanced: immersed in English 82% of the time; English-dominant, 94%; and Spanish-dominant, 51%, see Figure 4 bottom right panel and Table 5). This suggests that bilinguals might base their self-ratings of spoken proficiency on rough estimates of how much they have been using each language, giving less weight to other factors such as immersion and age of regular use, although these affected proficiency as much or more than percent use. In particular, immersion has been found to better predict naming ability in the nondominant language (Neveu & Gollan, Reference Neveu and Gollan2024a), and more robustly so than percent use of the language (Gollan et al., Reference Gollan, Garcia, Murillo, Vargas, Pulido and Salmon2024; Neveu & Gollan, Reference Neveu and Gollan2024b). While daily language use can lead to high fluency in a limited scope of relatively easy topics, immersion likely develops breadth of knowledge and the ability to perform more complex tasks. The combined effects of these language experiences on proficiency are thus better captured through objective measures, which look at proficiency more comprehensively, instead of focusing on the parts (immersion, age of acquisition, percent use) that make up the whole (proficiency as per an OPI).
Within self-reports, however, the use of average self-ratings might have performed better overall because bilinguals do recognize that they have more limited abilities in certain domains of competence (e.g. reading and writing). Although they might not realize it, some of the same skills that lead them to have more limited proficiency in reading and writing also affect their OPI scores. In particular, the OPI requires speakers to perform more difficult speaking tasks than they normally perform in each language and to produce language that might resemble written more than spoken language.
Bilinguals tend to compare themselves to their interlocutors, who in our study were statistically more likely to be monolingual speakers of the dominant language in society (all bilinguals were sampled on a college campus where English is dominant, even though the geographical region is more bilingual than average in the United States). They might additionally factor in other aspects of proficiency such as accent (e.g., Flege et al., Reference Flege, MacKay and Piske2002), which is not evaluated with the OPI (raters were instructed to ignore accent unless it interfered with speech intelligibility), where a stronger accent negatively affects self-rated proficiency. Particularly, Spanish-dominant bilinguals might exhibit more of an accent than English-dominant bilinguals (Flege et al., Reference Flege, MacKay and Piske2002) and so might weight this factor more in their self-ratings than English-dominant bilinguals would, skewing comparisons across groups.
A smaller portion of participants in the present study even self-reported English dominance when they were Spanish-dominant according to the OPI (n = 5) and similarly Spanish-dominant when they were English-dominant according to the OPI (n = 2). Looking closely at this smaller subset of participants, four of seven were almost balanced as per the OPI, with OPI scores in English and Spanish differing by 0.1–0.3 points, and for three of seven, the difference between OPIs ranged between 0.6 and 1.2 points, a more significant gap. Particularly in the latter subgroup, such gross misclassification of language dominance could have potentially serious consequences in clinical settings.
4.4. What do self-ratings reflect?
Exploratory analysis of self-rating categories provided some unique insights as to what self-report measures reflect and suggest possible avenues that might be explored to improve their predictive power. First, most bilinguals self-rated their spoken proficiency as balanced (42 out of 80, see Table 4) even though few were classified as such by the OPI. Average self-rated proficiency across all four modalities (instead of just speaking proficiency) reduced the number of bilinguals who said they are balanced and improved the match between self-report and objective measures. It is surprising that the average self-rating was more strongly correlated than self-rated spoken proficiency with OPI scores (which itself measures spoken proficiency). It would be important to determine whether the same would be true for bilinguals who read languages in which writing systems do not have shared letters, where greater discrepancies between spoken and written modalities are frequent. While bilinguals who said they are balanced did tend to be more balanced on average on objective measures (on the OPI and MINT Sprint 2.0, with nonsignificant trends in the same direction on fluency tasks; see Figure 4, middle panel), bilinguals who said they are Spanish-dominant for speaking were in fact the most balanced on objective measures (especially the MINT Sprint 2.0 and H-LDT, but also on the OPI). Spanish-dominant bilinguals also tended to report later age of regular use of English, less than 50% use of English during childhood and relatively more balanced immersion in each language, while self-reported balanced bilinguals reported learning both languages relatively early on, and using both languages about equally often in childhood, but were immersed in English for most of their life (see Figure 4, bottom panel).
Finally, bilinguals who did not give themselves a maximum proficiency rating in either language (No 7s) were not disadvantaged in any objective measure of spoken proficiency relative to the “at least one maximum rating” (One 7) group (and they exhibited only a small possible disadvantage in the H-LDT). Additionally, bilinguals who gave themselves a maximum score in both languages (Two 7s) scored significantly higher only in fluency tasks (not on the OPI or MINT Sprint 2.0) and the fluency advantage was relatively small, though the difference in fluency scores between extreme groups (No 7s versus Two 7s) was larger in size (see Figure 5, bottom panels). Thus, some of the discrepancies between self-ratings and OPI scores might measure an aspect of proficiency that participants are sensitive to and that fluency tasks also measure, but the OPI and vocabulary tests do not.
5. Conclusions
Objective measures, especially the MINT Sprint 2.0, provided the strongest single predictors of language dominance and English proficiency, while self-report measures were weaker and contributed little or no predictive power in combined models. The MINT Sprint 2.0 is also relatively fast to administer and easy to score (scoring is completed on the go) and so should strongly be considered for inclusion in any study that aims to have rigorous measurement of language dominance and/or degree of bilingualism (by contrast, scoring or fluency tasks require assessment of idiosyncratic responses produced by different individuals, which is more time-consuming). If time and resources are available, additional administration of category fluency (to predict English proficiency) and the H-LDT (to predict Spanish proficiency) can further strengthen proficiency measurement. Average self-rated proficiency was the most powerful single self-report question to predict proficiency, but self-report measures never outperformed objective measures, often produced distorted classifications of language dominance, and self-report was especially inaccurate for identifying which bilinguals were most balanced. Given how quick and easy objective measures are (especially the MINT Sprint 2.0, and the H-LDT when testing literate participants), and the critical importance of accurately identifying which language is dominant in clinical settings (Gasquoine & Gonzalez, Reference Gasquoine and Gonzalez2012; Gollan et al., Reference Gollan, Salmon, Montoya and Da Pena2010; Reference Gollan, Garcia, Murillo, Vargas, Pulido and Salmon2024), there is no longer any justification for failing to include these objective and precise measures of bilingualism as a construct in research on bilinguals.
Supplementary material
The supplementary material for this article can be found at http://doi.org/10.1017/S1366728925000367.
Data availability statement
The data and script for this study are openly available at https://osf.io/t2ebk/.
Acknowledgements
We would like to thank Mayra Murillo for data collection and coding.
Funding statement
This research was supported by grants from the National Institute on Aging (AG076415, AG074928) and the National Science Foundation Grant BCS2316909 and by a predoctoral fellowship from the National Institute on Aging (F31-AG077915).
Competing interests
The authors declare none.
Appendix
A. Oral Proficiency Interview adapted instructions and questions
-
OPI ENGLISH
Now I am going to ask you some questions to get an idea of how you use English in a conversational context. I will ask you some questions so that you may give a sample of your communication skills. I would like for you to answer my questions as fluently and naturally as you can, but also try to show me your best language skills. These questions are strictly to assess language proficiency and you will not be judged on your opinions or experiences. Do you understand?
QUESTION SET A:
-
A. Where did you grow up? How is it different from or similar to San Diego?
-
B. [COOKIE-THEFT PICTURE]: Please take a look at this picture. Examine the whole picture and then describe everything that you see happening. Be sure to mention all the different things.
-
C. Tell me about your childhood. What was it like? What do you remember most about it?
-
D. Tell me about your schedule for the rest of the day. Where will you be and what will you be doing at each hour.
-
E. There is a debate on whether to extend the school day for children in the USA for the purpose of improving academic performance nationwide. Do you think this is a good or a bad idea and why? How would you defend the opposing view as well?
-
F. The state of California is considering passing a law that would require all school-aged children to be vaccinated against COVID-19 or have a medical exemption in order to be enrolled in school. Do you think it is the government’s place to tell parents whether they should have their children vaccinated? Please explain your reasoning. How would you defend the opposing view as well?
QUESTION SET B:
-
A. Where are you from? How did you learn the languages that you speak?
-
B. [BUSTED WINDOW PICTURE]: Please take a look at this picture. Examine the whole picture and then describe everything that you see happening. Be sure to mention all the different things.
-
C. Tell me about your time as a student in school. What do you remember most about that experience?
-
D. Tell me about what you will do next week. Where will you be and what will you be doing each day?
-
E. Some parents think that bilingual children will not do as well in school as monolingual children. Others say bilingualism is an advantage. What do you think? How would you try to convince someone that your view is the right one?
-
F. How important are free speech and freedom of the press to a healthy society? Please share your opinion. How would you defend the opposing view as well?
OPI SPANISH
Ahora te voy a hacer unas preguntas para tener una idea de cómo utilizas el español en un contexto de conversación. Te haré algunas preguntas para que puedas dar una muestra de tus habilidades comunicativas. Quiero que intentes contestar a mis preguntas de la manera más fluida y natural que puedas, y a la vez trates de demostrar tu mejor capacidad lingüística. Estas preguntas son estrictamente para evaluar tu habilidad lingüística y no se te juzgará por tus opiniones o experiencias. ¿Lo entiendes?
QUESTION SET A:
-
A. ¿En dónde te criaste? ¿Y cuáles son las diferencias y semejanzas de ese lugar con San Diego?
-
B. [COOKIE-THEFT PICTURE]: Por favor mira esta imagen. Examina la imagen por completo y después describe todo lo que veas que esté sucediendo. Asegúrate de mencionar todas y cada una de las cosas que veas.
-
C. Cuéntame sobre tu niñez. ¿Cómo fue? ¿Y qué es lo que más recuerdas?
-
D. Cuéntame sobre lo que tienes programado para cada hora durante del resto del día. ¿En dónde vas a estar y que estarás haciendo?
-
E. Actualmente hay un debate acerca de extender el día escolar para los alumnos en los Estados Unidos para mejorar el rendimiento académico a nivel nacional. ¿Crees que es una buena o mala idea y por qué? ¿Y cómo defenderías el punto de vista opuesto?
-
F. El estado de California está considerando aprobar una ley que exigiría que todos alumnos se vacunen contra el covid-19 o tengan una excepción médica para poder ingresar en la escuela. ¿Crees que el gobierno debe decidir por los padres si sus hijos deberían estar vacunados? Por favor explica tu razonamiento. ¿Y cómo defenderías el punto de vista opuesto?
QUESTION SET B:
-
A. ¿De dónde eres? ¿Y Cómo aprendiste los idiomas que hablas?
-
B. [BUSTED WINDOW PICTURE]: Por favor mira esta imagen. Examina la imagen por completo y después describe todo lo que veas que esté sucediendo. Asegúrate de mencionar todas y cada una de las cosas que veas.
-
C. Cuéntame sobre cuando eras un estudiante en la escuela. ¿Qué es lo que más recuerdas de esa experiencia? (la primaria)
-
D. Cuéntame sobre lo que harás la semana que viene. ¿En dónde estarás y que harás cada día?
-
E. Algunos padres piensan que los niños bilingües no prosperan tanto en la escuela que los niños monolingües. Otros dicen que el ser bilingüe es una ventaja. ¿Qué piensas? ¿Y cómo intentarías convencer a alguien de que tu punto de vista es el correcto?
-
F. ¿Qué tan importante crees que es la libertad de expresión y de prensa para una sociedad saludable? Por favor comparte tu opinión. ¿Y cómo defenderías el punto de vista opuesto?
B. Oral Proficiency Interview – speaking proficiency rating scale and instructions for scoring
**IGNORE ACCENT UNLESS SPEECH IS HARD TO UNDERSTAND**.
1 = Novice Low: No real functional ability (limited ability to communicate). Given lots of time and cues may be able to exchange greetings, give identity and name a number of familiar objects. Cannot participate in a true conversational exchange.
2 = Novice Middle: Can communicate only very minimally and with great difficulty using a number of isolated words and memorized phrases, errors may be almost constant, and/or speech slow and with hesitations and false starts.
3 = Novice High: Can communicate with some success about simple topics only. Heavy reliance on memorized phrases, or on words provided by person speaking with. Speaks in short or incomplete sentences, and frequent miscommunications occur. Difficulty speaking throughout an exchange and may have many errors but some utterances without errors.
4 = Intermediate Low: Can successfully handle a limited number of uncomplicated communicative tasks by combining and recombining into short statements using simple language or repeating things the examiner said. Some errors may be present but also produces many utterances without errors.
5 = Intermediate Middle: Can successfully handle a variety of uncomplicated communicative tasks about simple topics (food, travel, family, daily activities and personal preferences). Speaks in full sentences and even with some strings of sentences. Some clear difficulty saying what they want to say but can work around it. Most utterances do not have errors, but there may still be some throughout the entire interview.
6 = Intermediate High: Can successfully handle many uncomplicated tasks and social situations requiring an exchange of basic information related to work, school, recreation, particular interests and areas of competence. Similar to Intermediate Middle (5 score) but errors and difficulty saying what they want to say is only occasional, most utterances without errors, but still some errors present throughout entire interview, especially on more challenging topics.
7 = Advanced Low: Can participate actively in most informal and a limited number of formal conversations on activities related to school, home, and leisure activities and, to a lesser degree, those related to events of work, current, public and personal interest or individual relevance. May occasionally speak at a professional level (e.g., like an M.D.) but not for an extended period of time. Very few errors and errors occur mostly on more challenging topics.
8 = Advanced Middle: Can handle with ease and confidence a large number of communicative tasks such as informal and some formal exchanges on a variety of concrete topics relating to work, school, home and leisure activities, as well as to events of current, public and personal interest or individual relevance. Can sometimes function at a formal or professional level of language but not consistently and not with a broad range of topics. Little difficulty speaking on complex/abstract topics, only a handful of errors present if any, speech is fluent and proficient.
9 = Advanced High: Can participate fully and effectively in conversations on a variety of topics in formal and informal settings on both concrete and abstract topics. Can speak at a formal or professional level of language usually without difficulty. When speaking at a formal or professional level, very few or no errors occur and these do not interfere with communication (and errors that occur will tend to be more native-like, e.g., a slip that is then corrected, a slight mispronunciation that happens when speaking too quickly).
10 = Superior: Speaks like a highly educated native speaker. Can participate fully and effectively in conversations on a variety of topics in formal and informal settings on both concrete and abstract topics with accuracy and fluency using formal and professional quality language. Errors are rare (or absent) and do not interfere with communication. Communicates well on any topic no matter how difficult and speech sounds like it is easily planned and even sophisticated. (Imagine a speaker like Barack Obama producing unscripted speech.) Errors might include stumbles that even the most proficient speaker occasionally produces, a word that is changing over time, e.g., data is instead of data are), a language switch that is in the process of becoming a borrowed word or that is very appropriate considering the context).
Examples of things that count as errors:
-
- subject–verb agreement, for example, “yo ser de Tijuana” instead of “yo soy de Tijuana”
-
- using the nontarget language, for example, “me tomo un nap” versus “me tomo una siesta”
-
- gender agreement errors, for example, “detras de un pared” instead of “UNA pared”
-
- verb conjugation errors, for example, “yo habla español” instead of “yo hablo español”
-
- combining verb tenses inappropriately, “Yo he tengo una gato” instead of “yo he tenido un gato”
-
- omitting function words “Voy a escuela” versus “Voy a la escuela”
-
- omitting parts of words:
For example: INCORRECT: “trabajo en un labatorio” versus CORRECT: “trabajo en un laboratorio”
Other Notes/Info:
Each time you sit down to score do the following:
-
a) skim the proficiency guidelines to remind yourself what is in them
-
b) listen to the entire interview before assigning a score
-
c) use half-scores if you are having trouble deciding between two scores
-
d) compare the same person across languages, if the person speaks slowly in both languages that is just how they talk, but if one language is much slower than the other, it is likely to be caused by lower proficiency level
-
e) if anything stands out as you listen, take notes about it
Things that might stand out:
-
- difficulty finding words
-
- language switching (but do not penalize if borrowed word or context appropriate)
For example: Me gusta mirar Netflix antes de dormir. Yo estudio en UCSD.
-
- speech errors
-
- odd language
-
- strong accent (IGNORE ACCENT UNLESS SPEECH IS HARD TO UNDERSTAND)
-
- do not penalize regional variation in accent
for example, Cuban Spanish often drops final consonants.
For example: perros – > perro’ or cansado – > cansa’o.
for example, “dicir” instead of “decir” is common in certain Spanish speaking regions.
-


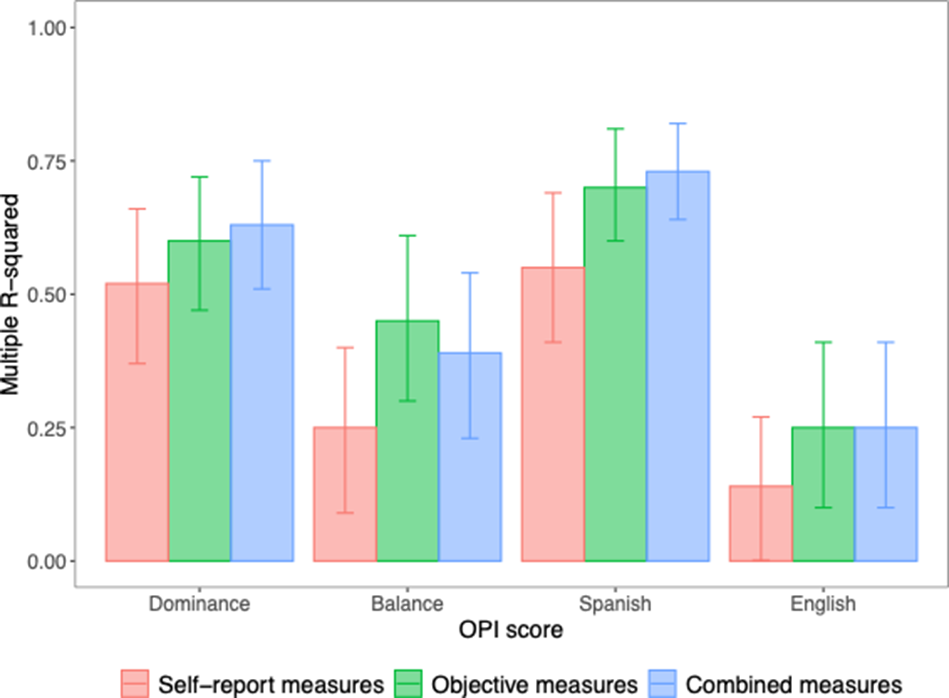

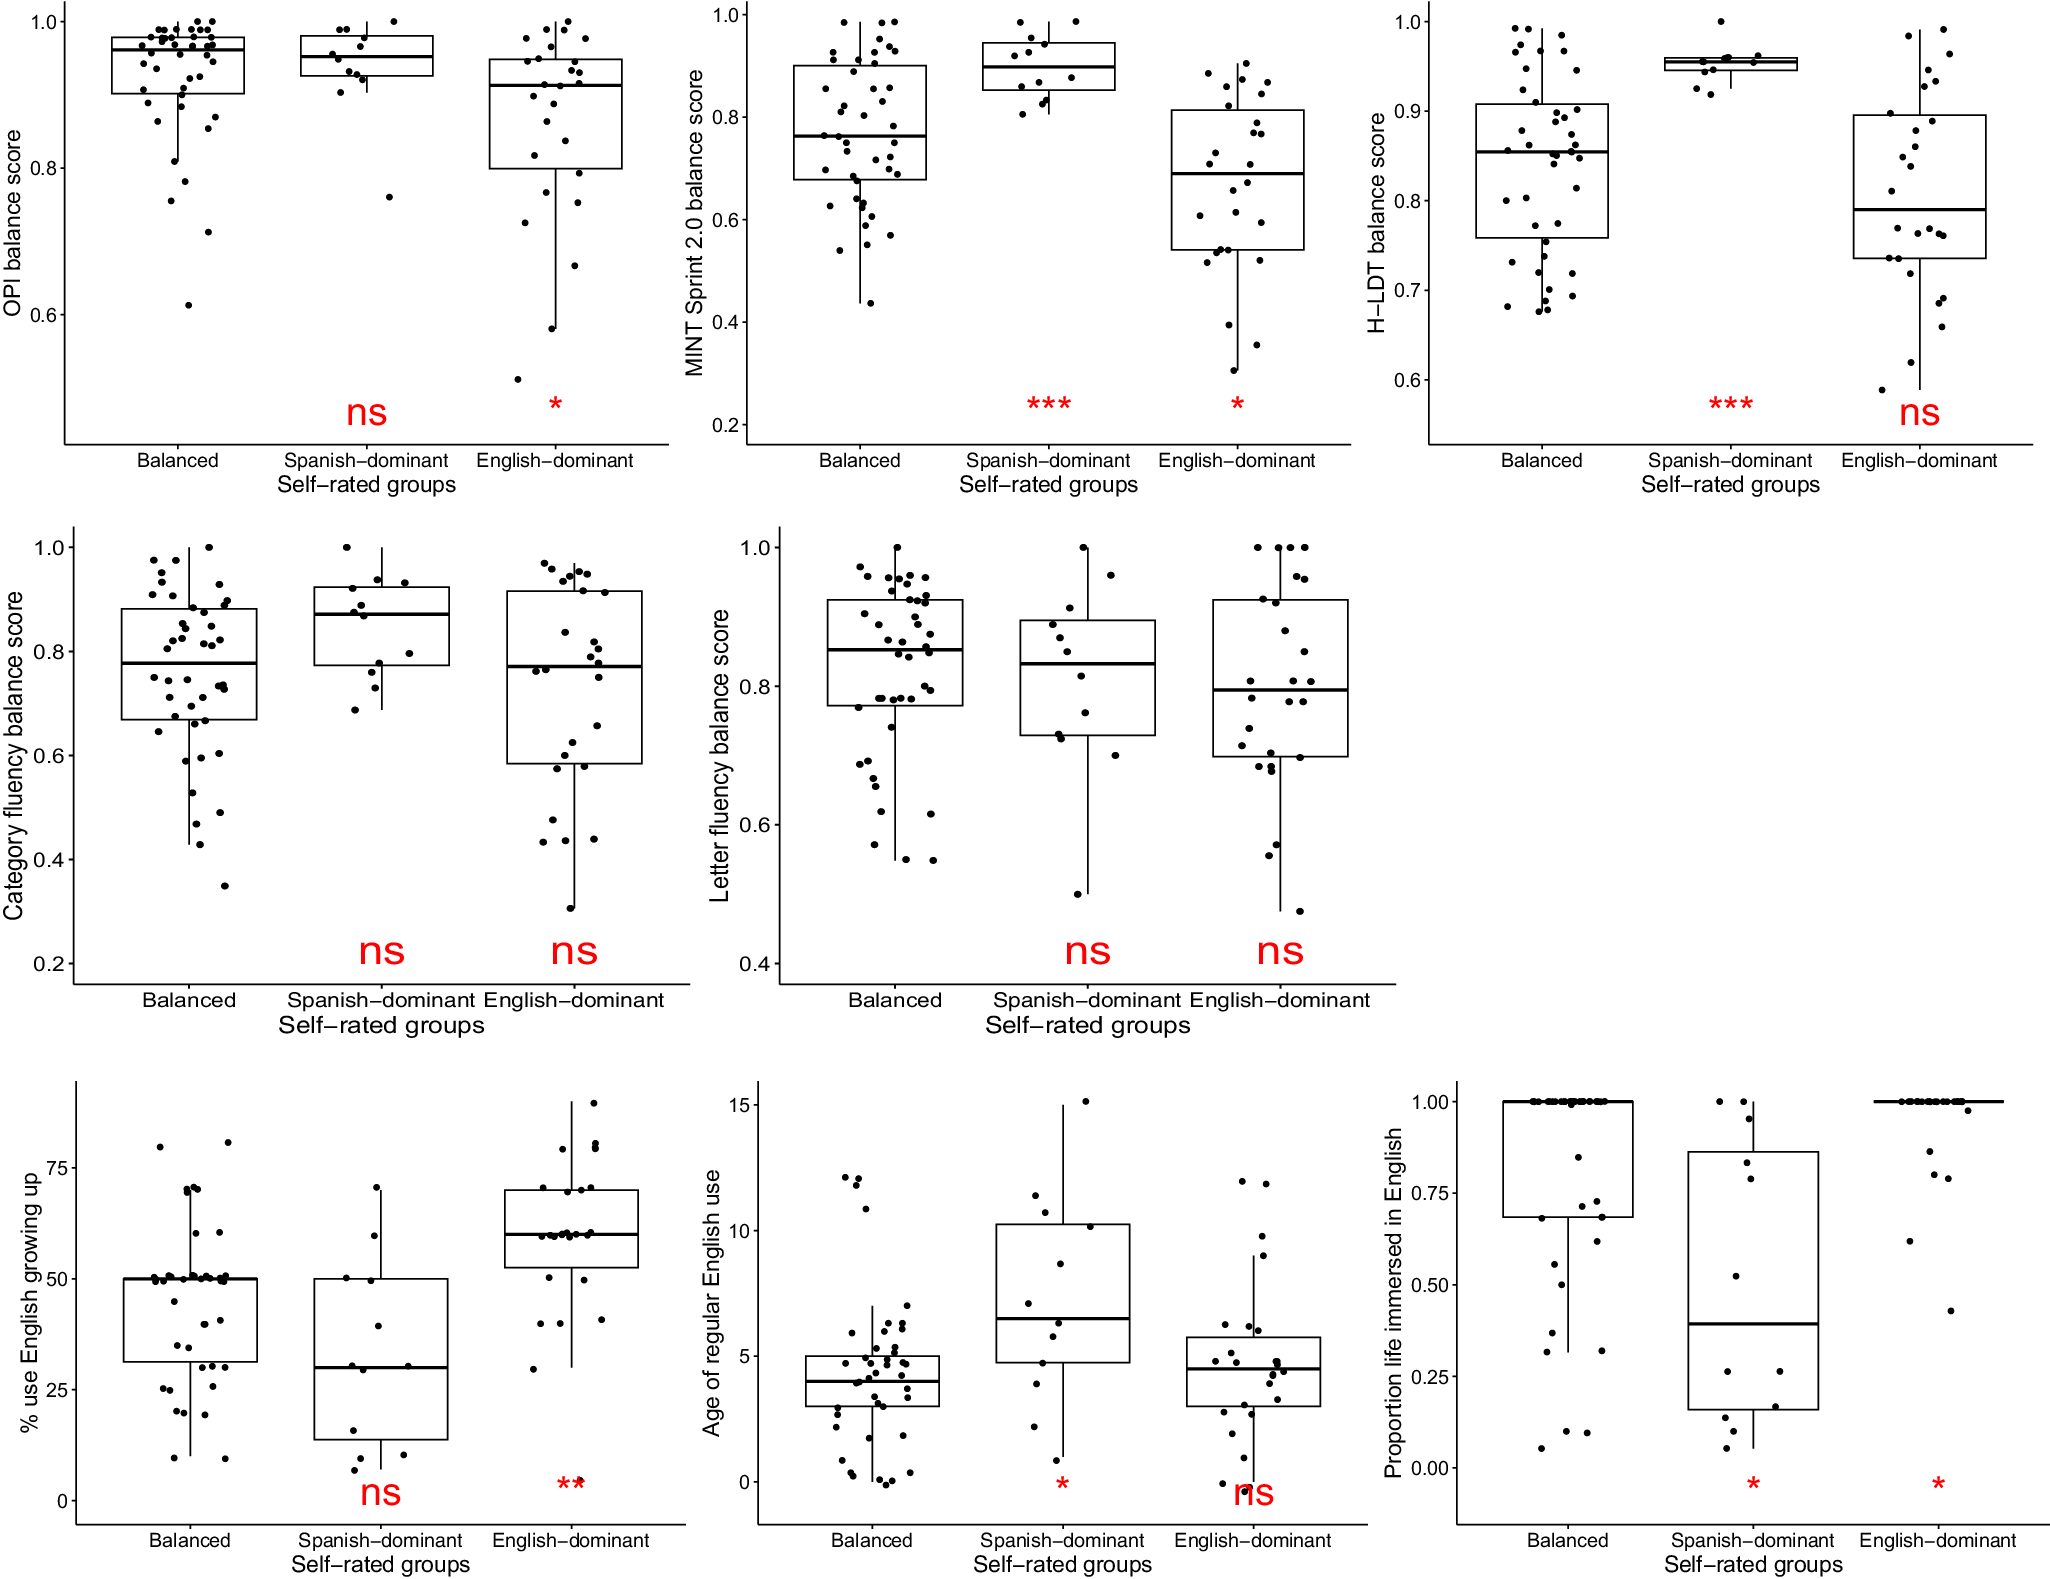

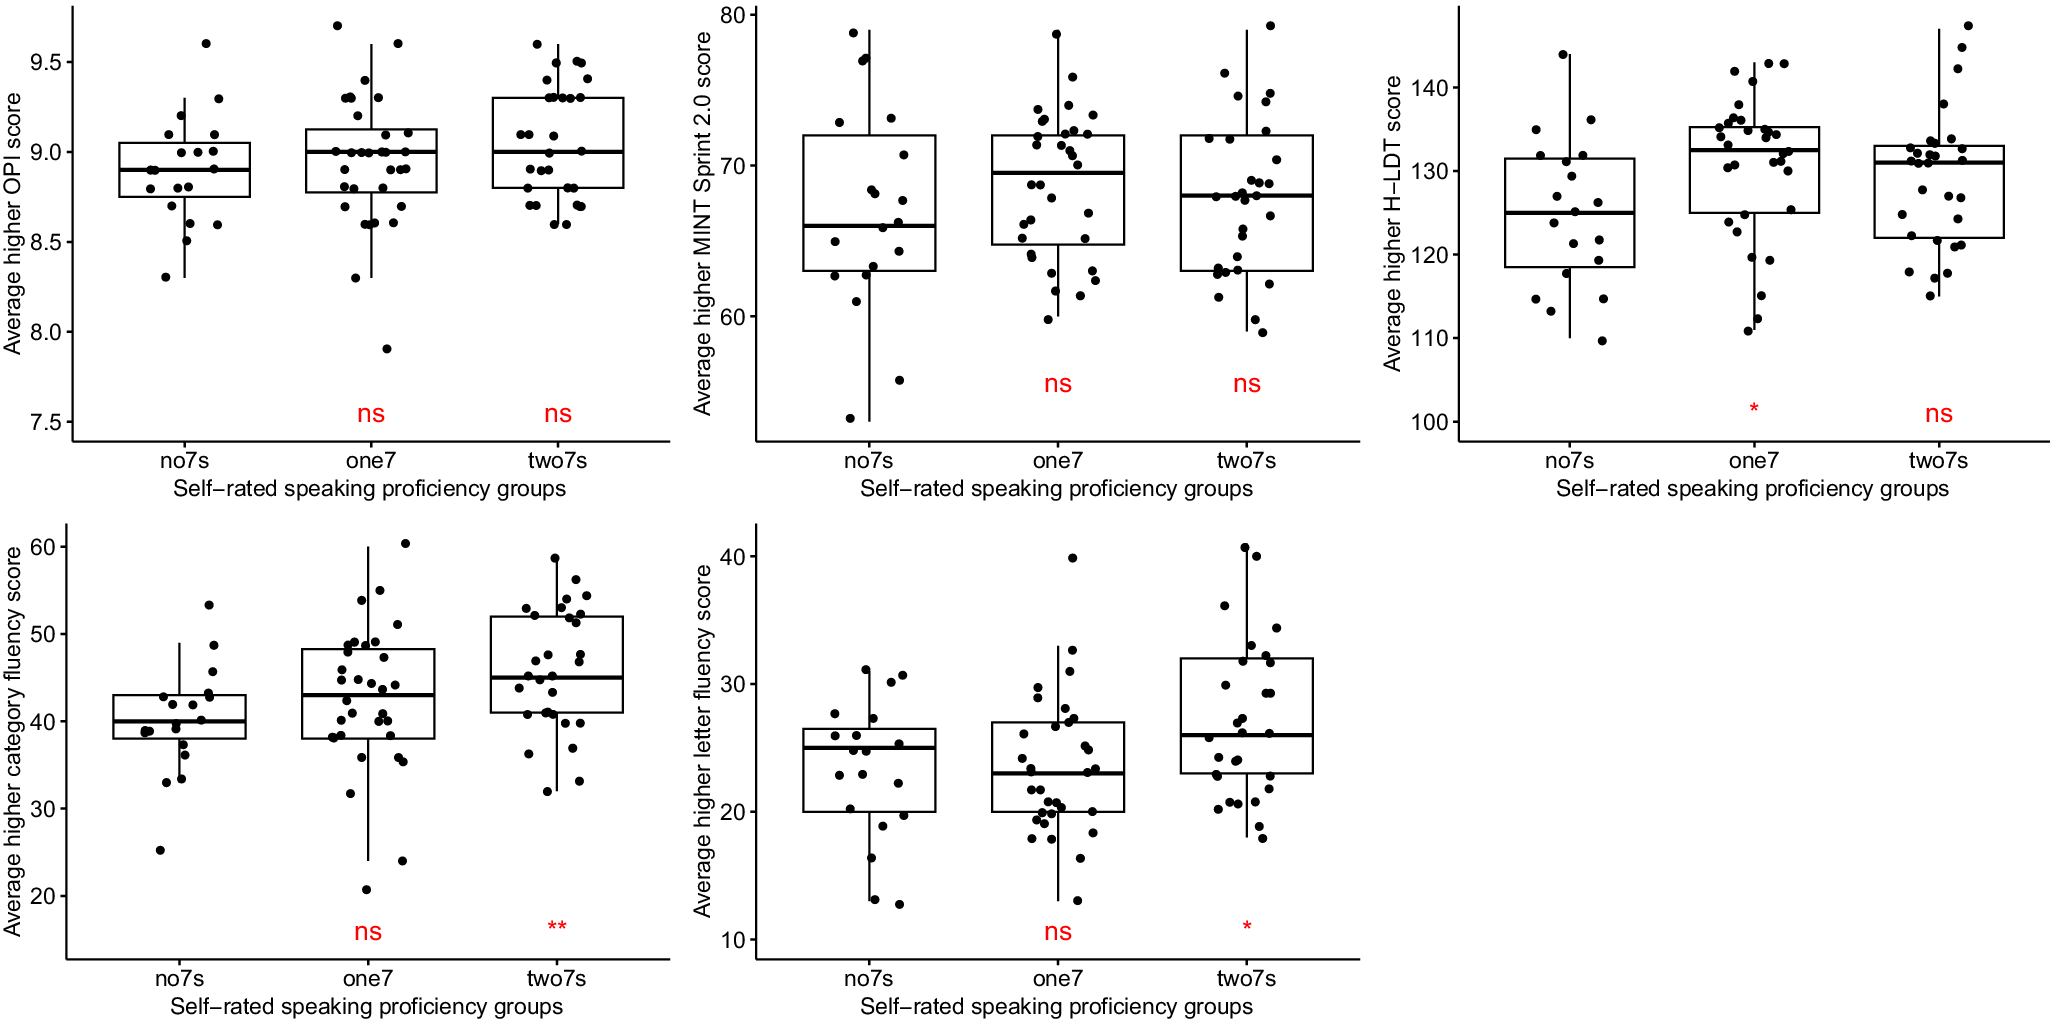


 Open access