


What
Network meta-analysis (NMA, sometimes called ‘multiple treatments meta-analysis’ or ‘mixed-treatment comparison’) is a method to compare multiple interventions (usually in terms of efficacy/safety) across a network of studies (usually randomised controlled trials, RCTs).
Why
In medicine, several treatment options employing similar mechanisms of action are often available for the same condition. The principles of evidence-based medicine require treatments to be compared head-to-head in RCTs (or in meta-analyses of these) to assert that one treatment is better than another. However, RCTs rarely include more than two treatment arms, and standard meta-analyses can compare only two interventions at a time. Therefore, a clinician interested in learning what the best antidepressants are for efficacy or safety would need to review a number of studies with separate head-to-head comparisons. Also, some treatment comparisons may not have been performed in the available trials.
NMAs address both of these problems by comparing all different interventions in a single analysis and retrieving indirect evidence from the data available. Furthermore, having access to both direct and indirect evidence increases the significance of the specific result.
Why not?
Some researchers are wary of indirect evidence, arguing that data from indirect evidence have not been randomised between different studies. Such lack of randomisation exposes analyses to the risk of selection bias, and therefore evidence produced only from indirect comparisons (i.e. subject to indirectness) is downgraded in terms of quality. Indeed, a well-connected network (i.e. rich in direct comparisons) gives results that are more robust than a poorly connected one; however, indirect evidence is still useful in real-world evidence-based medicine, where not all head-to-head comparisons have been performed, and because it supports findings from the direct evidence.
Another common critique is that NMAs compare ‘apples with oranges’. This is a common problem with all meta-analyses, and it is minimised by ensuring that the included studies have similar selection criteria for their participants, thus respecting the principle of transitivity (i.e. any patient within the network could have been randomised to any of the treatments).
Finally, it is important to consider the principle of ‘garbage in, garbage out’, whereby if the included studies are conducted poorly, the results of the NMA will be of low quality too. As with any other meta-analysis, the quality of the included studies needs to be assessed and weighed up before any conclusions are drawn; in NMAs, this is done through an NMA-modified grading of recommendations assessment, development and evaluation (GRADE).
When
A PubMed search for the terms network meta-analysis, multiple treatments meta-analysis, and mixed-treatment comparison yielded 3299 records: the first NMA (and the only one for that year) was published in 2002, but it was only between 2009 and 2011 that the number of reported NMAs reached double figures, followed by an astonishing growth since 2012 (Fig. 1). The first NMA concerning mental health was published in 2006 (King Reference King, Griffin and Hodges2006).
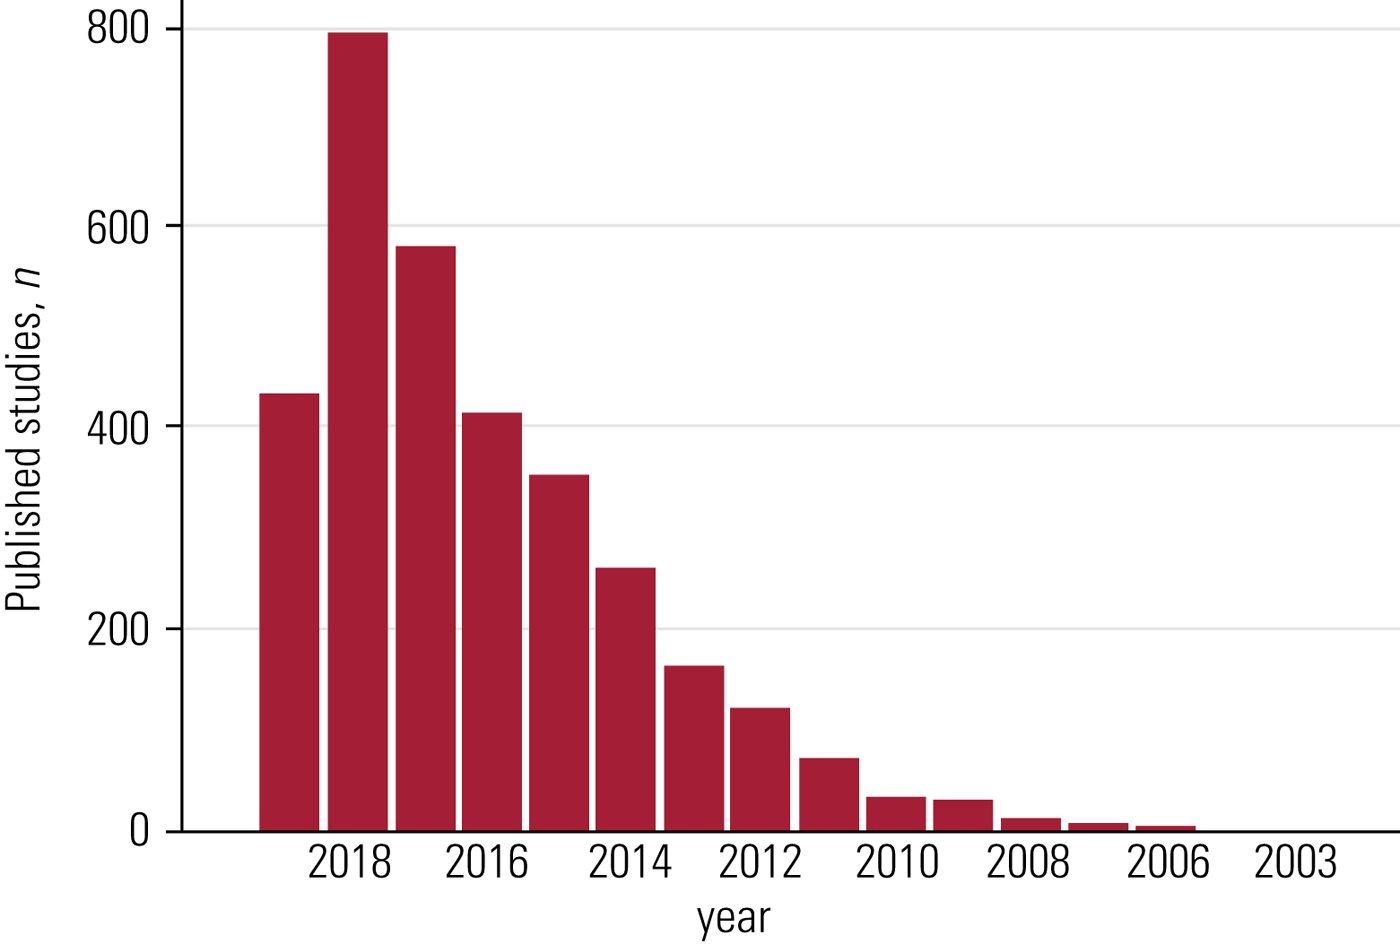
FIG 1 Published network meta-analyses over the years, according to a PubMed search.
Where
Network meta-analyses soon became sought-after publications by major journals (e.g. JAMA and Archives of Internal Medicine). Today, NMAs are found in journals with a wide range of impact factors. However, well-conducted NMAs (e.g. Cipriani Reference Cipriani, Furukawa and Salanti2018) are frequently published in key journals as these studies are likely to support or even spark changes in clinical guidelines.
How
In its design and execution, an NMA shares most of its features with a classic pair-wise meta-analysis (Mavridis Reference Mavridis, Giannatsi and Cipriani2015): defining the research question, specifying eligibility criteria, searching for and selecting studies, assessing risk of bias and quality of evidence, conducting a meta-analysis, and interpreting and reporting of findings (Higgins Reference Higgins2008).
Additionally, an NMA synthesises results from both direct and indirect evidence (Fig. 2):
• direct evidence is produced by comparing interventions within the available studies (e.g. comparison of fluoxetine with control using the pooled results of all trials that compare fluoxetine with control);
• indirect evidence uses a common element from various studies to compare interventions for which no specific comparison studies are available (e.g. comparison of fluoxetine with venlafaxine using pooled results of all trials comparing fluoxetine with control and all trials comparing venlafaxine with control).
Direct and indirect evidence are important in their own right, but their combination (i.e. mixed evidence) can add more strength to a study's conclusions by improving the precision of the estimated result (Cipriani Reference Cipriani, Higgins and Geddes2013).
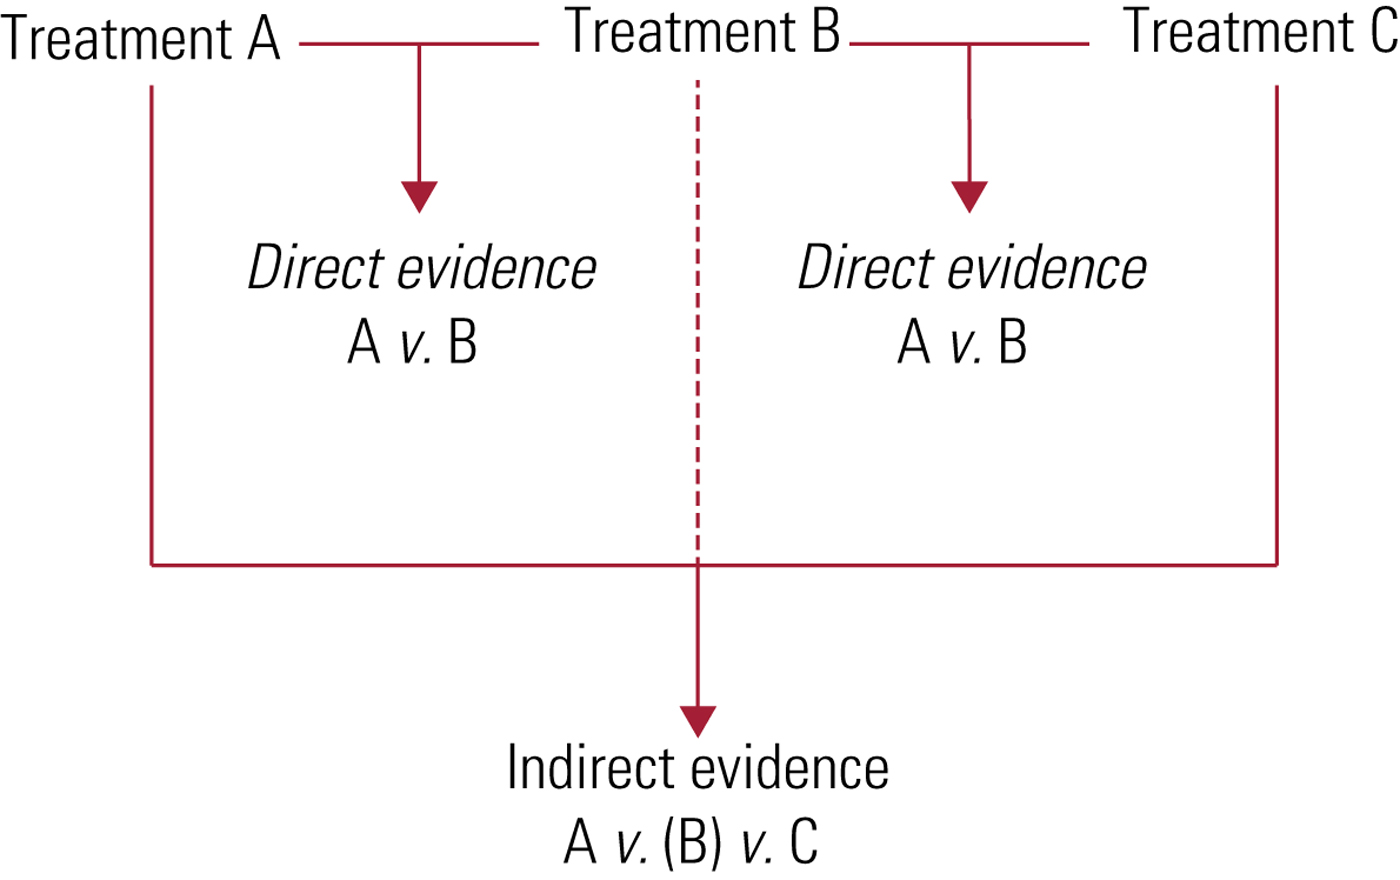
FIG 2 Direct and indirect evidence.
All the studies included in an NMA are presented in a network plot – hence, the name (Fig. 3).

FIG 3 A network plot. Circles correspond to an intervention or a control condition: the bigger the size, the higher the number of participants involved in that condition. Lines connecting the circles represent the trials comparing the interventions or control conditions; the width of the line corresponds to the number of participants involved in that comparison.
NMAs generally make an assumption of consistency: the estimates of the effects from direct and indirect evidence must be in agreement. In mathematical terms, if three options (A, B and C) are available, trials comparing A with B, B with C and A with C will estimate the parameters δ AB, δ AC and δ BC respectively (where δ denotes the difference); in this case, there is consistency if δ AB + δ BC = δ AC. In lay terms, if skyscraper A is 400 m high, skyscraper B is 350 m and skyscraper C is 275 m, the difference between skyscraper A minus B (50 m) plus the difference between skyscraper B minus C (75 m) must equal the difference between skyscraper A minus C (125 m). In clinical terms, an example would be that if sertraline proves better than fluoxetine, and fluoxetine proves better than placebo, then we would expect sertraline to be better than placebo – if that is not the case, we have inconsistency, which can be assessed and dealt with using statistical methods beyond the scope of this refreshment.
Authors can generate ‘NMA-modified forest plots’ ranking all treatments for outcomes such as efficacy/safety by their point estimate against the control condition (e.g. antidepressants can be ranked from the highest to the lowest effect sizes for efficacy in comparison with placebo) (Fig. 4).

FIG 4 A network meta-analysis modified forest plot. In this example, treatments A–F are compared against placebo and ranked according to their effect sizes. Squares represent the point estimate for the effect size (e.g. odds ratio): the bigger the size, the more evidence supporting that comparison (e.g. higher number of participants involved in that comparison). Lines crossing the squares are confidence intervals; a shorter line corresponds to narrower confidence intervals and thus more precise results.
Finally, it is possible to build league tables that allow head-to-head comparisons between the available treatments for efficacy/safety outcomes (e.g. each individual antidepressant is compared with the others and with placebo, reporting the effect size for each comparison and outcome in a table) (Fig. 5).
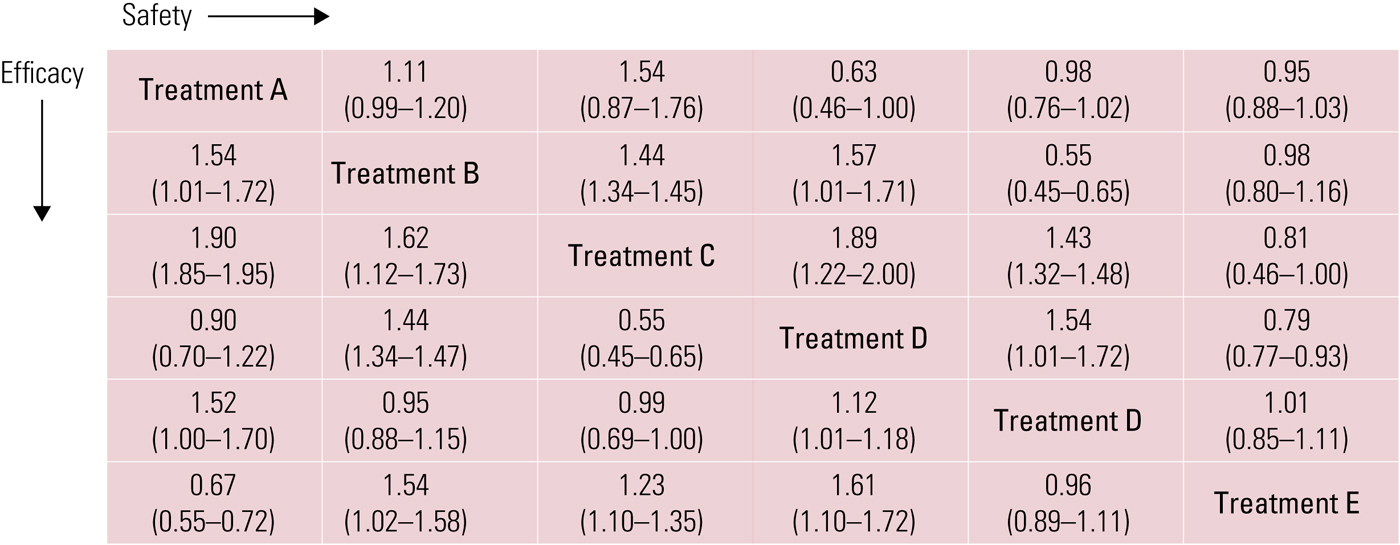
FIG 5 A league table showing the effect size (95% CI) for each outcome (efficacy and safety) in a head-to-head comparison of treatments A–E.
Conclusions
In view of the several advantages of NMAs, though bearing in mind the potential pitfalls, NMAs have been recommended as the highest level of evidence in treatment guidelines (Leucht Reference Leucht, Chaimani and Cipriani2016), thus representing an exceptional informative tool for clinicians and researchers.
Funding
R.D.G. acknowledges the support of the Wellcome Trust [102176/Z/13/Z]. The views expressed are those of the author and not necessarily those of the Wellcome Trust or the National Health Service.


eLetters
No eLetters have been published for this article.