The high prevalence of the metabolic syndrome and excessive adipose tissue accumulation (in particular, abdominal obesity) is a major threat to public health, being associated with a substantial decrease in health-related quality of life and an increase in economic costs( Reference Shamseddeen, Getty and Hamdallah 1 – Reference Poyrazoglu, Bas and Darendeliler 3 ). Thus, new strategies related to the long-term prevention and reduction of incidence and severity of CVD and type 2 diabetes need to be initiated. Among these is the identification of beneficial bioactive compounds within many foods, as appropriate dietary strategies that may themselves positively affect disease predisposition and evolution( Reference Brown, Poudyal and Panchal 4 ).
Lignans are chemicals produced as secondary metabolites( Reference Milder, Kuijsten and Arts 5 , Reference Ayres and Loike 6 ). They occur in the whole plant kingdom and can also be found in fibre-rich foods and particularly concentrated in oilseeds (especially in flaxseed and sesame)( Reference Namiki 7 – Reference Muir 9 ), in cereal grains (e.g. wheat and rye bran), nuts( Reference Smeds, Eklund and Sjöholm 10 ), Brassica species, legumes, berries and in many plant-related beverages (tea, coffee and so on)( Reference Kuhnle, Dell’Aquila and Aspinall 11 ). 7-Hydroxymatairesinol (7-HMR) is a dibenzylbutyrolactone plant lignan closely related to matairesinol. It is found at relatively high concentrations in the heartwood of branches and knots of Norway spruce trees (Picea abies)( Reference Hovelstad, Leirset and Oyaas 12 ) and in various concentrations in plant foods( Reference Smeds, Eklund and Sjöholm 10 – Reference Smeds, Jauhiainen and Tuomola 14 ). The activity and metabolism of 7-HMR has been recently evaluated in rats and in humans, with enterolactone (ENL) being the major metabolite identified( Reference Saarinen, Wärri and Mäkelä 15 , Reference Udani, Brown and Tan 16 ). Other metabolites detected included hydroxyenterolactone, α-conidendrin, conidendric acid, enterodiol (END), allo-7-HMR and unchanged 7-HMR. All of these minor metabolites, including unchanged 7-HMR, were at concentrations many-fold lower than the primary metabolite ENL( Reference Saarinen, Wärri and Mäkelä 15 ).
In contrast to other well-studied lignans, which are highly concentrated in oilseeds such as sesamin or secoisolariciresinol( Reference Dar and Arumugam 17 , Reference Mukker, Kotlyarova and Singh 18 ), 7-HMR, although also present in oilseeds, was only recently detected in several cereals by applying improved extraction and detection methodologies( Reference Smeds, Eklund and Sjöholm 10 ). 7-HMR is found to be concentrated in rye, wheat, triticale, oat, barley, millet, maize bran and amaranth whole grain( Reference Smeds, Eklund and Sjöholm 10 ). Thus, as these grains are widely consumed worldwide in various forms, we intended to study 7-HMR, which is the dominant lignan in these foods, in a model of the metabolic syndrome( Reference Abdollahi, Salehnia and Mortazavi 19 ) for which the metabolic functions and effects of 7-HMR are still elusive.
In this work, we investigate the effect of 7-HMR on the pathological alterations that occur with the metabolic syndrome following a high-fat diet (HFD), at a dose suggested for nutraceutical use (HMRLignan™) (which provides a high intake of this compound), but that can also produce levels of mammalian metabolites (ENL and END) similar to those reached with a lignan-rich diet.
Methods
Chemicals
7-HMR potassium acetate complex (HMRLignan™) was prepared by co-crystallisation of P. abies extract and potassium acetate in a ternary solvent system (ethanol, ethylacetate, water), as previously described( Reference Smeds, Eklund and Sjöholm 10 ). The purity of the preparation HMRLignan™ batch 12809003 is as follows: hydroxymatairesinol potassium acetate 99 % and related substance 4 %. Total P. abies extract (TPE) is a mixture of 7-HMR and allo-hydroxymatairesinol, produced by hot ethanolic extraction of P. abies knots. TEP is an intermediate in the process to obtain pure 7-HMR. All steps in the 7-HMR purification process are validated, and thus TEP is a standardised and replicable product. The product contains 31 % 7-HMR, 16 % allo-hydroxymatairesinol and other natural constituents of the herbal drug. The balance to 100 % is potassium acetate and water. The chemicals were dissolved in dimethylsulfoxide (DMSO) and further diluted before their oral administration to the mice or the treatment of the cells. The chemicals (HMRLignan™ and TEP) for the experiments were provided by Linnea SA free of charge. The complete chemical analysis of 7-HMR is freely available upon request to the corresponding author. In this work, we use the name 7-HMR throughout the text. HMRLignan™ is the proprietary name of the commercial preparation. Palmitic acid (PA; Sigma-Aldrich) was dissolved in isopropylic alcohol at a 100-mm stock concentration. Stock solution was diluted to 1·25 mm in warm Dulbecco’s modified Eagle’s medium (DMEM) containing 10 % fetal bovine serum (FBS; Gibco) and 10 % bovine serum albumin (BSA; Sigma-Aldrich). The 1·25-mm solution was further diluted in warm growth medium at a final concentration of 125 μm to treat cells. The END and ENL enterolignans were purchased from Sigma-Aldrich and dissolved in DMSO at a stock concentration of 10 mm and further diluted in DMSO for experiments with cells.
Experimental animals
The procedures involving animals and their care were conducted in accordance with institutional guidelines, which comply with national and international laws and policies (National Institutes of Health, Guide for the Care and Use of Laboratory Animals, 1996 (7th ed.) (Washington, DC); National Academies Press, National Research Council Guide, www.nap.edu/readingroom/books/labrats). C57BJ/6 mice (Harlan, Udine) were kept in animal rooms maintained at a temperature of 23°C, with natural light/dark cycles in aerated (40×25 cm) polycarbonate cages at a density of 8 mice/cage. Chemicals were administered by oral administration in 100 µl of vegetable oil at 10.00 hours with disposable flexible polypropylene tubes in plastic with a soft bulb tip to minimise tissue damage. At the end of the treatments, the animals were killed by cervical dislocation after having received diethyl ether anaesthesia, and the tissues were dissected and immediately frozen on dry ice. Serum was separated from blood cells by centrifugation at 18 928 G-force (13 000 rpm).
Food consumption was monitored every 2 d as the difference between the weight of the supplied and the consumed pellets. Spilled food, if any, was collected in apposite trays underneath the food containers, measured and taken into account.
Diets
Low-fat diet (LFD) and HFD containing 10 and 50 % energy content from fat, respectively, were purchased from Piccioni (www.totofood.it/). The diet was prepared in pellets. The composition is reported in Table 1. Assay of 7-HMR or TEP or analogues in the diets did not reveal any presence of these chemicals. Quantification was performed by the method reported in Smeds et al.( Reference Smeds, Eklund and Sjöholm 10 , Reference Smeds and Hakala 20 , Reference Smeds, Hakala and Hurmerinta 21 ). Food consumption was monitored every 2 d as difference between the weight of the furnished and the consumed pellets (see the ‘Results’ section). Mean daily water intake was 3·5 (se 0·2) ml/mouse for mice on the LFD and 3·8 (se 0·4) ml/mouse for mice on the HFD. 7-HMR or TEP administration did not change the average water intake.
Table 1 Composition of the dietsFootnote *
LFD, low-fat diet; HFD, high-fat diet.
* Amounts of components in the diets: LFD and HFD containing 10 and 50 % fat, respectively, were purchased from Piccioni.
The LFD was composed of 15·6 % SFA, 45·2 % MUFA and 39·2 % PUFA, whereas the HFD was composed of 60·3 % SFA, 32·9 % MUFA and 6·7 % PUFA.
Echo MRI analysis
The Echo MRI system (EchoMRI Corporation Pte Ltd) was used as already reported( Reference Zanella, Marrazzo and Biasiotto 22 ).
Determination of 7-hydroxymatairesinol and metabolites in mouse serum
7-HMR, END and ENL were determined by HPLC–MS/MS in the mouse serum samples after enzymatic hydrolysis and solid-phase extraction according to a previously described method( Reference Smeds and Hakala 20 ). The method was slightly modified by taking 50 µl of serum instead of 600 µl and 290 units of β-glucuronidase/sulphatase dissolved in 0·5 ml of 10 mm sodium acetate buffer (pH 5·0) for each sample (for the enzymatic hydrolysis). The glucuronidase used was β-glucuronidase/sulphatase (type H-1, from Helix pomatia) (Sigma-Aldrich Co.). The samples were incubated at 37°C for 19 h and cleaned after incubation by solid-phase extraction. For details, see Smeds et al.( Reference Smeds, Hakala and Hurmerinta 21 ). The possible presence of residual lignans in the glucuronidase preparation was not determined, as the method has been validated and found reliable. The small amounts of ENL and END measured in mice on the LFD and HFD reflect the consumption of a certain amount of sawdust as no other sources of lignans were used in this work.
Biochemical assays
Blood was collected from each mouse, stored at 37°C for 30 min and centrifuged at 3500 g at room temperature for 10 min to obtain serum. TAG, HDL and cholesterol concentrations were measured spectrophotometrically with a biochemical multi-analyser ILab Aries (Instrumentation Laboratory Company) using kits by the same manufacturer. The parameters are as follows: TAG analytical range, 0·07−11·3 mmol/l; precision, CV (%) 1·5; cholesterol analytic range, 0·1–23·3 mmol/l; precision, CV (%) 2·0; HDL-cholesterol analytic range, 0·03–6·5 mmol/l; precision, CV (%) 3·1. Species-specific kits are not necessary for the determination of these parameters. Our value ranges are in agreement with data from the literature on the same analytes. Insulin concentration was assayed by a standardised mouse insulin assay (catalogue no. EZRMI-13K; Millipore) and insulin sensitivity was determined by the homoeostasis model assessment (Diabetes Trials Unit, The Oxford Centre for Diabetes). The oral glucose tolerance test was performed as previously described( Reference Zanella, Marrazzo and Biasiotto 22 ). Mice were deprived of food overnight and then orally given glucose (1 mg/g body weight). Tail vein blood samples were taken at 0, 15, 30, 45 and 60 min after glucose administration to measure blood glucose concentrations. Blood glucose concentrations were measured by a portable Accu-check compact glucometer (Roche Diagnostic GmbH). AUC was calculated by using the trapezoid rule( Reference Lin, Koibuchi and Hasegawa 23 ).
For immunoblot analysis, cell lysates were obtained as previously described( Reference Lin, Koibuchi and Hasegawa 23 ). Equal protein amounts, separated by SDS-PAGE, were transferred to polyvinylidene difluoride (PVDF) membranes. Filters were incubated with diluted 1:1000 primary antibodies (mouse anti-PPARγ and mouse anti-fatty acid binding protein 4, aP2/FABP4) and then with peroxidase-labelled goat anti-mouse secondary antibody. All antibodies were purchased from Santa Cruz Biotechnology. Bound activity was revealed by chemiluminescence (SuperSignal West Femto Substrate; Thermo Fisher Scientific). The chemiluminescent signal was captured and quantified by the use of GENE-GNOME (Syngene).
RNA extraction and gene expression analysis
Total RNA was extracted from 10 to 30 mg of tissue or from treated cells using 1 ml of TRIzol Reagent (Thermo Fisher Scientific), according to the manufacturer’s instructions. Tissues in TRIzol reagent were pre-homogenised at 30 Hz for 3 min using the homogeniser MM301 (Qiagen). RNA for each sample was treated with RQ1-DNaseI (Promega) and reversed-transcribed using Improm II Reverse Transcriptase (Promega) and random hexamer primers. For quantitative RT-PCR, 2 µl of single-stranded complementary DNA was mixed with TaqMan Universal PCR Master (Thermo Fisher Scientific) and assay-on-demand gene-specific products, using HPRT1 as the normalising gene (Integrated DNA Technology), and analysed on a ABI PRISM 7700 Sequence Detection System (Life Technologies). The calculation of threshold cycle (C
t
) values was performed using the SDS 2.2 software (Applied Biosystems), after automatically setting the baseline and the threshold. Data were analysed using the
 $$2^{{{\minus}\Delta \Delta C_{t} }} $$
method, as previously described(
Reference Zanella, Derosas and Corrado
24
).
$$2^{{{\minus}\Delta \Delta C_{t} }} $$
method, as previously described(
Reference Zanella, Derosas and Corrado
24
).
Histological examination
Epididymal adipose tissue and liver were fixed in formaldehyde and embedded in paraffin. Sections measuring 3 μm were dewaxed and rehydrated through decreasing alcohol series up to distilled water and stained with haematoxylin–eosin. Original magnification was 20×. Analyses were conducted in a blinded manner by two independent pathologists.
Cell culture and treatments
Mouse 3T3-L1 confluent cells (cells with a fibroblast-like morphology, differentiating into an adipocyte-like phenotype) were cultured in basal or differentiation medium (3-isobutyl-1-methylxanthine, dexamethasone, insulin; MDI) as described( Reference Zanella, Marrazzo and Biasiotto 22 , Reference Biasiotto, Zanella and Masserdotti 25 ). On day 9 after induction of differentiation, the cells were treated with different doses of 7-HMR, TEP, ENL and END (0·01, 0·1, 1 µm) for two further days. On day 9 after differentiation induction, lipid content was quantified as described( Reference Zanella, Marrazzo and Biasiotto 22 ). For mRNA quantification the confluent cells were treated for 48 h with vehicle or defined concentrations of the molecules, and RNA was extracted using the TriReagent Solution (Ambion), treated with DNaseI (Promega) and reverse-transcribed. Quantitative PCR analyses were performed using Assay on Demand kits on an ABI PRISM 7000 (Applied Biosystems)( Reference Cocco, Porrini and Derosas 26 ). HPRT1 was used as the reference gene.
Murine HEPA 1–6 hepatocarcinoma cells (IZSLER Brescia) were used as the steatosis in vitro model. Cells were cultured in DMEM medium containing 10 % FBS. For PA treatment, cells were seeded at a density of 2×10⁴/well in ninety-six-well plates in growth medium for 24 h. Then, medium containing the SFA PA at 125 μm was applied for 24 h in the presence of vehicle (isopropylic alcohol 0·1 %, plus BSA 1 %, plus DMSO 0·05 %) or 7-HMR, TEP, END or ENL in the dose range of 0·001–1 μm.
Statistical analysis
Sample size was calculated in order to be able to detect differences of about 5 g in total body weight between HFD mice using one-way repeated-measures ANOVA at 80 % power. Calculations were performed using the G*Power 3.1.5 software (available at http://www.gpower.hhu.de/en.html). With a β level of 0·20, an α level of 0·05 and a small effect size, the sample size was thirty-nine mice in each of the four groups (then increased to forty, to account for possible dropouts). Statistical analysis was performed by ANOVA, either one-way or two-way with repeated measures on one factor, according to the data type, followed by post hoc Bonferroni analysis. All the analyses were conducted in a blinded manner and were performed using the Prism 5.0 software (GraphPad Software, www.graphpad.com).
Results
Effects of 7-hydroxymatairesinol and total Picea abies extract on body fat deposition, lipid profile and sugar metabolism in male mice fed a high-fat diet
Peripubertal male mice, 3 weeks old, were randomised into four groups (LFD, HFD, HFD+7-HMR and HFD+TEP). The compounds were given daily by oral administration to mimic dietary assumption and to allow microbiota metabolism. The mice were fed the LFD or the HFD plus or minus the oral lignan for 60 d. Average food consumption was 2·99 (se 0·5) g/mouse per d for the mice on the LFD (46·65 kJ/mouse per d (11·15 kcal/mouse per d)) and 2·61 (se 0·4) g/mouse per d for the mice on the HFD (51·46 kJ/mouse per d (12·30 kcal/mouse per d)). Food intake of the mice on the HFD plus oral administration with vegetable oil with dissolved 7-HMR or TEP was 2·70 (se 0·6) g/mouse per d and 2·65 (se 0·6) g/mouse per d, respectively, showing that vegetable oil plus the chemicals did not have any effect compared with vegetable oil alone.
HFD-fed mice were treated daily with 3 mg/kg body weight (bw) 7-HMR (doses of 1 up to 22·5 mg/kg body weight have been studied in humans and showed no toxic effects)( Reference Udani, Brown and Tan 16 ) (HORMOS study number: 3000-4302 and one manuscript in preparation) or 10 mg/kg body weight TEP (an experimental dose based on previous unpublished results). Total body weight was measured periodically for 60 d and total body fat was measured at the end of the experiment. From day 30 until the end of the experiment the body weight started to be significantly lower in mice treated with 7-HMR and TEP (−7 and −6 %, respectively, at day 30, and −11 and −13 %, respectively, at day 60) compared with the mice on the HFD alone (Fig. 1(a)).
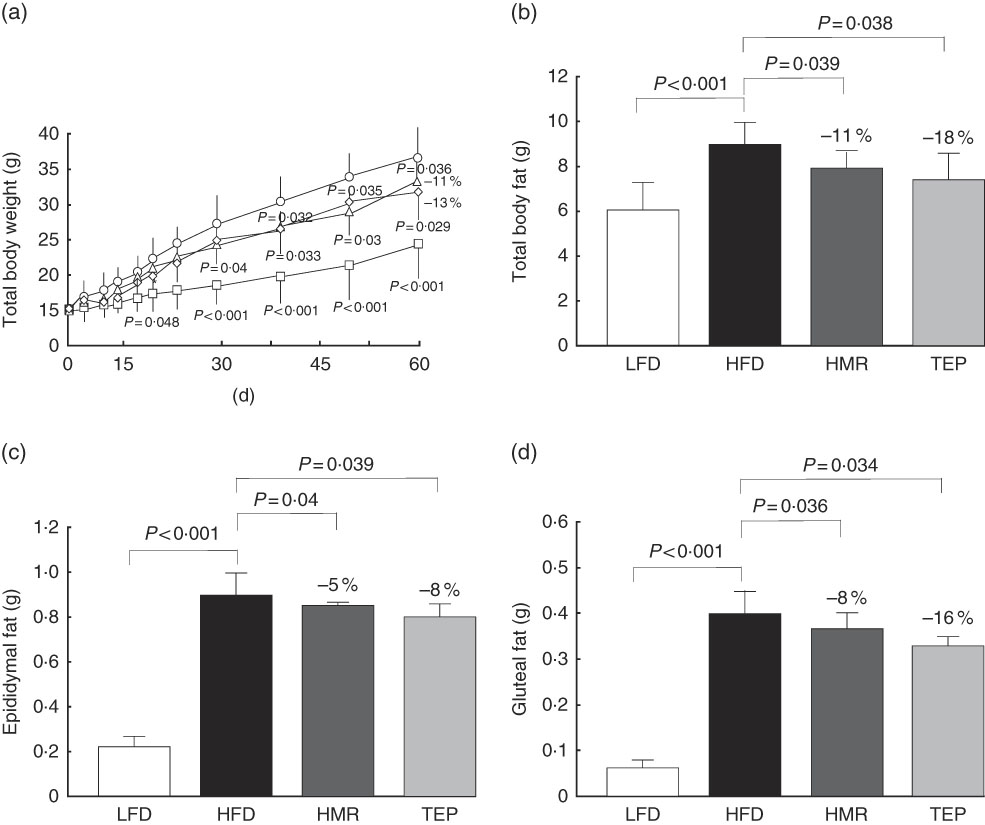
Fig. 1 Effect of 7-hydroxymatairesinol (7-HMR)- and total Picea abies extract (TEP)-medicated diets on fat development in male mice. Time-course effects of control−low-fat diet (LFD), control−high-fat diet (HFD), HFD+7-HMR and HFD+TEP on body weight and total adipose tissue deposition in male C57BL/6J mice. Total adipose mass was analysed using an EchoMRI system. (a) Total body weight, (b) total body fat (g), (c) weight of epididymal fat and (d) weight of gluteal fat. Time of treatments was 60 d. Fat pads were excised immediately after euthanasia. a: ![]() , LFD;
, LFD; ![]() , HFD;
, HFD; ![]() , HFD+7-HMR;
, HFD+7-HMR; ![]() , HFD+TEP. Percentage values (11 and 13 % less weight) in the graph represent the extent of the change on the HFD value. (b)–(d):
, HFD+TEP. Percentage values (11 and 13 % less weight) in the graph represent the extent of the change on the HFD value. (b)–(d): ![]() , LFD;
, LFD; ![]() , HFD;
, HFD; ![]() , HFD+7-HMR;
, HFD+7-HMR; ![]() , HFD+TEP at the end of the 60-d treatments (b–d). Percentage values on the histograms represent the extent of the change on the HFD value. Values are means (n 40 per group), with their standard errors represented by vertical bars. P=actual value or P<0·001.
, HFD+TEP at the end of the 60-d treatments (b–d). Percentage values on the histograms represent the extent of the change on the HFD value. Values are means (n 40 per group), with their standard errors represented by vertical bars. P=actual value or P<0·001.
We also found that total fat and isolated epididymal and gluteal fat pads were significantly smaller in the 7-HMR- and TEP-treated mice compared with mice on the HFD alone (Fig. 1(b)–(d)). Serum glycaemia decreased (fasting glucose: −12 % 7-HMR and −14 % TEP. AUC −33 % 7-HMR and −27 % TEP), as well as insulin secretion (−74 % 7-HMR and −89 % TEP) and insulin resistance (−71 % 7-HMR and −78 % TEP), in the 7-HMR- and TEP-treated mice (Fig. 2(a)–(e)). Histological examination of the adipocyte size in epididymal fat revealed that the decrease in fat weight of mice fed 7-HMR or TEP corresponds to a decrease in cellular dimensions (Fig. 3(a) and (b)). Mice on the HFD developed accumulation of lipid droplets in the liver (liver steatosis), which were measured by histological analysis (Fig. 3(c)) and the fat content quantified (Fig. 3(d)). 7-HMR and TEP lowered the lipid content in the liver of the treated mice.
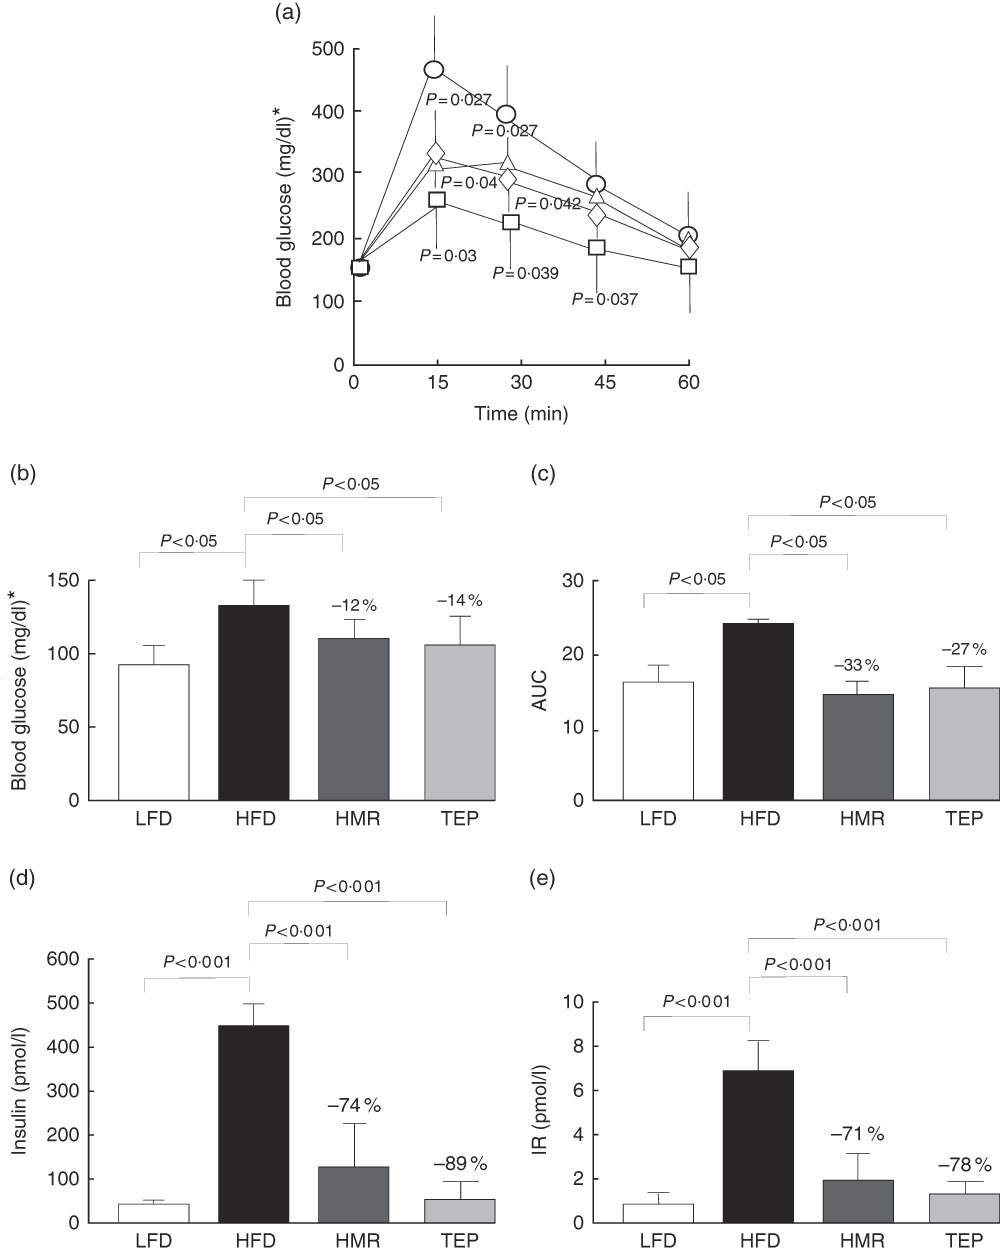
Fig. 2 Glucose tolerance. For glucose tolerance tests animals were fasted overnight for 12 h and blood samples were obtained from the tail vein. (a) Animals were then injected intraperitoneally with 2 g/kg body weight of glucose and blood samples were taken at the indicated intervals. (b) Fasting glucose levels, (c) the AUC (AUC from the glucose tolerance test) and (d) plasma insulin levels were measured with an insulin ELISA kit (Millipore, mouse insulin ninety-six-well plate assay; catalogue no. EZRMI-13K). (e) Determination of homoeostasis model assessment of insulin resistance (IR). Calculations were carried out using glucose and insulin concentrations obtained after 6 h of food withdrawal, using the HOMA Calculator (Diabetes Trials Unit), the Oxford Centre for Diabetes, Endocrinology and Metabolism: homa.calculator@dtu.ox.ac.uk. a: ![]() low-fat diet (
low-fat diet (![]() , control − low-fat diet (LFD)
, control − low-fat diet (LFD)![]() ;
; ![]() , control−high-fat diet (HFD);
, control−high-fat diet (HFD); ![]() , HFD+7-hydroxymatairesinol (7-HMR);
, HFD+7-hydroxymatairesinol (7-HMR); ![]() , HFD+total Picea abies extract (TEP); (b)–(e):
, HFD+total Picea abies extract (TEP); (b)–(e): ![]() , LFD;
, LFD; ![]() , HFD; ■, HFD+7-HMR;
, HFD; ■, HFD+7-HMR; ![]() , HFD+TEP. Percentage values on the histograms represent the extent of the change on the HFD value. Values are means (n 10 per group), with their standard errors represented by vertical bars. P=actual value or P<0·001. * To convert glucose in mg/dl to mmol/l, multiply by 0·0555.
, HFD+TEP. Percentage values on the histograms represent the extent of the change on the HFD value. Values are means (n 10 per group), with their standard errors represented by vertical bars. P=actual value or P<0·001. * To convert glucose in mg/dl to mmol/l, multiply by 0·0555.
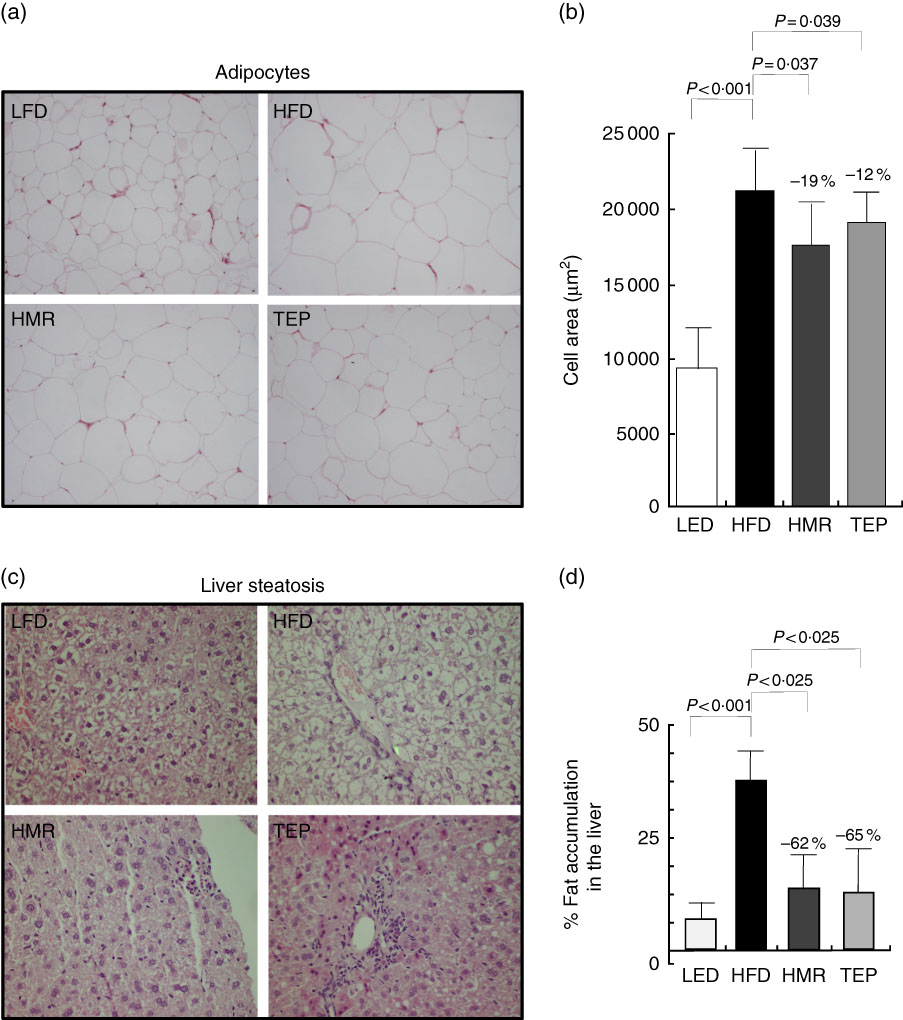
Fig. 3 Histological examination epididymal adipose tissue and liver parenchyma were fixed in formaldehyde and paraffin embedded. Sections (3 µm) were stained with haematoxylin–eosin. Cells were photographed at 20× magnification with a digital camera (Nikon Digital Camera DMX 1200). (a, b) Adipocyte size was measured using dedicated software (Image Pro Plus; Imaging and Computer). At least four different fields of three different tissue sections were evaluated for each sample. (c) Liver steatosis. Representative liver sections stained with haematoxylin–eosin. (d) Liver tissue was processed to quantify the fat content. Percentage fat content was determined relative to fat content in the liver of mice on the high-fat diet (HFD). Data represent the average result of the analysis of tissues from five different mice (n 5). Percentage values on the histograms represent the extent of the change on the HFD value. Values are means with their standard errors represented by vertical bars. LFD, low-fat diet; HMR, hydroxymatairesinol; TEP, total Picea abies extract. P=actual value, or P<0·025, or P<0·001.
Effects of 7-hydroxymatairesinol and total Picea abies extract on serum lipids profile in male mice fed a high-fat diet
After 10 weeks on the HFD, we observed a decrease in total serum cholesterol levels (−11 %) in TAG (−15 %) and LDL (−23 %) in mice fed the TEP-supplemented diets compared with those in HFD-fed mice. HDL did not change in both groups of treated mice (Table 2). No significant changes were visible in the serum of mice fed the 7-HMR-supplemented diet (P<0·05).
Table 2 Lipid profile in serumFootnote *(Mean values and standard deviation; n 10 samples/group)
LFD, low-fat diet; HFD, high-fat diet; 7-HMR, 7-hydroxymatairesinol; TEP, total Picea abies extract.
* Serum lipids were measured in the different groups of mice. From the left column: control mice on the LFD, mice on the HFD, mice on the HFD plus 7-HMR; mice on the HFD plus TEP. Group a, mice on the HFD v. mice on the LFD; group b, 7-HMR-treated mice v. mice on the HFD alone; group c, TEP-treated mice v. mice on the HFD alone. P=actual value.
† To convert cholesterol in mg/dl to mmol/l, multiply by 0·0259. To convert TAG in mg/dl to mmol/l, multiply by 0·0113.
Concentration of enterolactone and enterodiol in mouse serum
The major 7-HMR metabolites ENL and END (Fig. 4), produced by the intestinal microbiota from the dietary precursor, were measured in mouse serum. The sera of mice treated with 7-HMR have significantly higher levels of both metabolites, whereas TEP generated only significant levels of ENL (Table 3), according to a previous work performed in rats with the same precursor( Reference Saarinen, Wärri and Mäkelä 15 ). The small amount of metabolites measured in mice on the control LFD and HFD reflects the consumption of a certain amount of sawdust as no lignans were detectable in the administered diets.
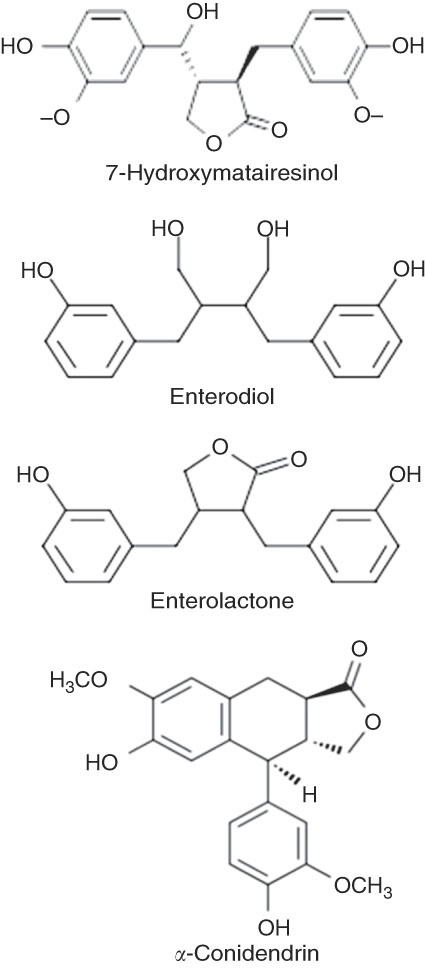
Fig. 4 Structure of 7-hydroxymatairesinol (7-HMR) and mammalian lignan. The molecular structure of 7-HMR and mammalian metabolites.
Table 3 Concentration of enterolactone and enterodiol in mouse serumFootnote *(Mean values and standard deviations; n 16 samples/group)
LFD, low-fat diet; HFD, high-fat diet; 7-HMR, 7-hydroxymatairesinol; TEP, total Picea abies extract; MW, molecular weight.
* Lignan metabolites were measured by HPLC–MS/MS in mouse serum. From the left column: control mice on the LFD, mice on the HFD, mice on the HFD plus 7-HMR; mice on the HFD plus TEP. P=actual value.
Changes in metabolic pathways in the visceral fat and the liver
Increased adipose accumulation is associated with changes in several metabolic parameters in visceral fat and in the liver. We analysed the deregulation of the expression of sets of genes involved in fat accumulation and metabolism, autophagy, inflammation and antioxidant defences.
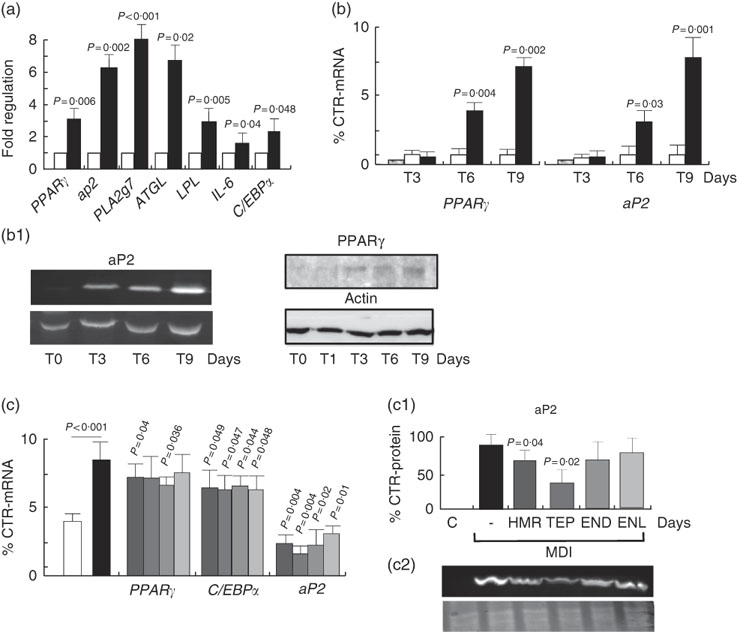
The genes that were found to be modulated code for members of the inflammatory response pathway. TNF-α and IL6 were induced by the HFD and inhibited by 7-HMR and TEP. The antioxidant defence enzyme glutathione-S-transferase 1 was inhibited in the high-fat-treated mice and established at higher levels by TEP. The transcription factor EB (TFEB) was inhibited in the high-fat group and was re-expressed in 7-HMR and TEP-treated mice. The fat metabolism genes LPL, PLA2G7 and leptin were induced by the HFD and repressed by 7-HMR and TEP; the ATGL and adiponectin genes were inhibited by the HFD and restored by TEP (Fig. 5). The PPARγ1 gene, C/EBPα and aP2, which are key factors in adipocyte differentiation and fat metabolism, were up-regulated in both fat and liver and were significantly reduced in TEP-treated mice.
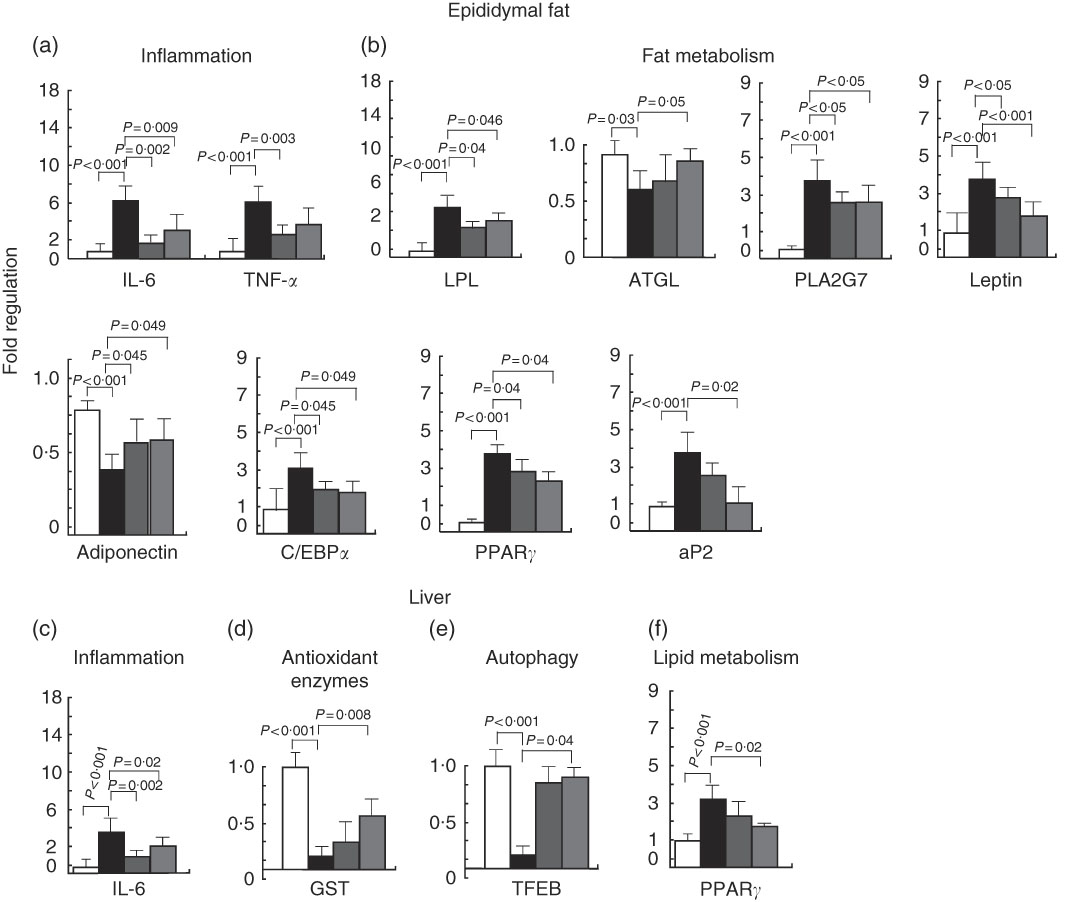
Fig. 5 Gene expression analysis in epididymal fat and the liver. The expression of a set of genes involved in (a), (c) inflammation and (b), (f) fat metabolism (d), antioxidant defences and (e) autophagy were quantified in epididymal fat and liver tissues of the treated mice. Values are mean fold change (n 8), with their standard errors represented by vertical bars. The experiments were performed by the use of Taqman LDA microfluidic cards with HPRT1 RNA used as the normalising gene. ![]() , Control; ■, high-fat diet (HFD);
, Control; ■, high-fat diet (HFD); ![]() , HFD+7-hydroxymatairesinol (7-HMR);
, HFD+7-hydroxymatairesinol (7-HMR); ![]() , HFD+total Picea abies extract (TEP). P=actual value or P<0·001.
, HFD+total Picea abies extract (TEP). P=actual value or P<0·001.
Activity of 7-hydroxymatairesinol and total Picea abies extract on 3T3-L1 cell differentiation and regulation of the PPARγ pathway
To understand whether the increase in fat accumulation observed in vivo could be similarly replicated in vitro and to verify whether it was dependent on fat cell accumulation, we challenged the 3T3-L1 in vitro model of cell differentiation with our compounds. We first characterised the effects of 7-HMR, TEP and the major metabolites ENL and END on 3T3-L1 fat cell accumulation. This was performed in cells maintained in differentiation medium and treated with different doses of 7-HMR, TEP, ENL and END (0·01, 0·1, 1 µm). The Oil-Red-O staining of the treated cells revealed that the lignan metabolites ENL and END inhibited lipid accumulation in differentiating cells. 7-HMR showed less potency and TEP was not active (Fig. 6). To understand whether the modulation of adipogenesis was occurring at a molecular level through key adipogenic factors, we studied the regulation of PPARγ, C/EBPα and aP2 from an array of genes induced in differentiating 3T3-L1 cells (Fig 7(a)). PPARγ and aP2 were maximally expressed at day 9 of the differentiation schedule (Fig. 7(b) and (b1)), and thus for the following experiment we used this end point. At day 9 the lignans 7-HMR and ENL inhibited the activity of PPARγ, whereas all four lignans efficiently inhibited C/EBPα and aP2 in differentiating cells. The aP2 protein was slightly inhibited in the 7-HMR- and TEP-treated cells (Fig. 8(c)).
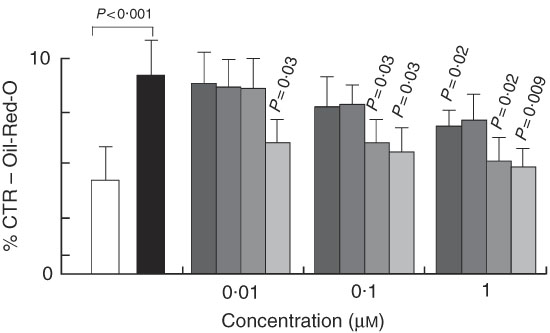
Fig. 6 Regulation of cell differentiation by lignin. 3T3-L1 cells were either maintained in undifferentiated (basal) or differentiated state (3-isobutyl-1-methylxanthine, dexamethasone, insulin; MDI) and stimulated for 9 d with vehicle as control (C). During MDI-induced differentiation the cells were treated with 7-hydroxymatairesinol (7-HMR), total Picea abies extract (TEP), enterolactone (ENL) and enterodiol (END) at increasing concentrations (0·01, 0·1, 1 µm). The effect of these compounds on cell differentiation was measured by the Oil-Red-O staining 9 d after transfection. Values were expressed as percentage of control undifferentiated and untreated (vehicle) cells. Differentiated cells v. control undifferentiated cells; 7-HMR, TEP, ENL, END v. MDI-treated cells. Values are means (n 4), with their standard errors represented by vertical bars. ![]() , C; ■, MDI;
, C; ■, MDI; ![]() , MDI+7-hydroxymatairesinol (7-HMR);
, MDI+7-hydroxymatairesinol (7-HMR); ![]() , MDI+TEP;
, MDI+TEP; ![]() , MDI+ENL;
, MDI+ENL; ![]() , MDI+END. P=actual value, compared with controls (cells in basal medium). P=actual value or P<0·001 compared with controls (MDI-treated cells).
, MDI+END. P=actual value, compared with controls (cells in basal medium). P=actual value or P<0·001 compared with controls (MDI-treated cells).
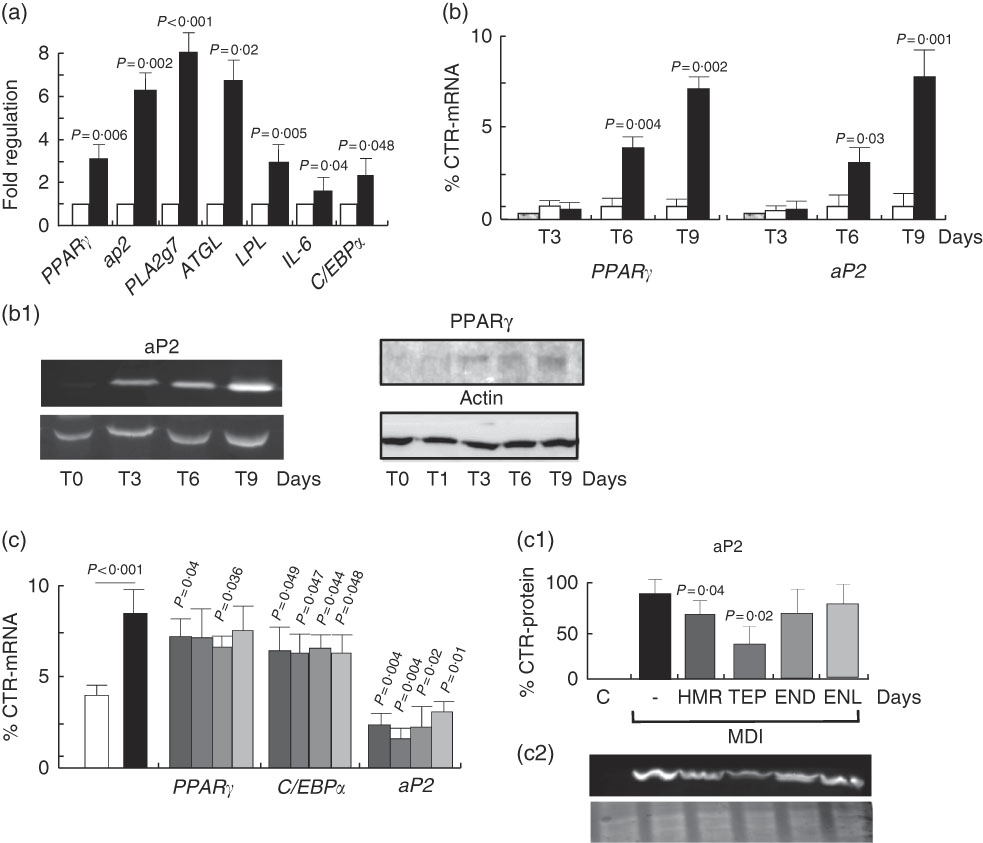
Fig. 7 Regulation of adipogenic factors in 3T3-L1 cells. (a) Regulation of genes of fat metabolism and inflammation in 3T3-L1 cells. Values are means (n 4), with their standard errors represented by vertical bars. ![]() , Control;
, Control; ![]() , MDI (3-isobutyl-1-methylxanthine, dexamethasone, insulin). P=actual value, compared with controls (cells in basal medium). (b) Time course of PPARγ and aP2 mRNA expression and protein synthesis in differentiating 3T3-L1 cells. 3T3-L1 cells were treated with MDI for 3, 6 and 9 d and then mRNA and proteins were harvested for the measurement of PPARγ and aP2 mRNA and protein (b1) as molecular factors of cell differentiation. Data are shown as mean values of at least three experiments. Values are means (n 3), with standard errors represented by vertical bars. P=actual value, compared with controls (cells in basal medium). (c) Differentiating cells were treated for 9 d with vehicle as control (C) or 7-hydroxymatairesinol, total Picea abies extract (TEP), enterolactone and enterodiol at the active concentration of 1 µm in the differentiation (MDI) medium. mRNA expression levels of PPARγ, C/EBPα and aP2 mRNA and protein were evaluated by real-time RT-PCR. mRNA expression of control cells was arbitrarily set at 1. (c1) Densitometric scanning of aP2 protein level measured by Western blotting (c2). Values are means (n 5), with their standard errors represented by vertical bars.
, MDI (3-isobutyl-1-methylxanthine, dexamethasone, insulin). P=actual value, compared with controls (cells in basal medium). (b) Time course of PPARγ and aP2 mRNA expression and protein synthesis in differentiating 3T3-L1 cells. 3T3-L1 cells were treated with MDI for 3, 6 and 9 d and then mRNA and proteins were harvested for the measurement of PPARγ and aP2 mRNA and protein (b1) as molecular factors of cell differentiation. Data are shown as mean values of at least three experiments. Values are means (n 3), with standard errors represented by vertical bars. P=actual value, compared with controls (cells in basal medium). (c) Differentiating cells were treated for 9 d with vehicle as control (C) or 7-hydroxymatairesinol, total Picea abies extract (TEP), enterolactone and enterodiol at the active concentration of 1 µm in the differentiation (MDI) medium. mRNA expression levels of PPARγ, C/EBPα and aP2 mRNA and protein were evaluated by real-time RT-PCR. mRNA expression of control cells was arbitrarily set at 1. (c1) Densitometric scanning of aP2 protein level measured by Western blotting (c2). Values are means (n 5), with their standard errors represented by vertical bars. ![]() , C;
, C; ![]() , MDI;
, MDI; ![]() , MDI+7-hydroxymatairesinol (7-HMR);
, MDI+7-hydroxymatairesinol (7-HMR); ![]() , MDI+TEP;
, MDI+TEP; ![]() , MDI+ENL;
, MDI+ENL; ![]() , MDI+END. P=actual value, compared with controls (cells in basal medium). P=actual value, compared with controls (MDI-treated cells).
, MDI+END. P=actual value, compared with controls (cells in basal medium). P=actual value, compared with controls (MDI-treated cells).
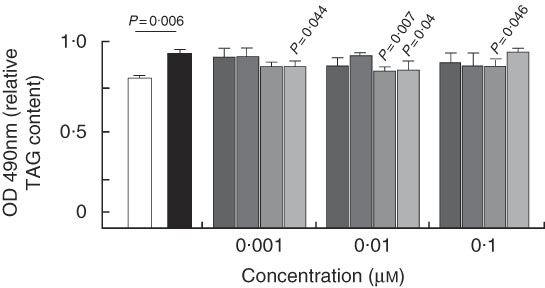
Fig. 8 Quantification of TAG in HEPA 1–6 hepatocytes. Cells were stimulated with palmitic acid alone (PA) or plus 7-hydroxymatairesinol (7-HMR), total Picea abies extract (TEP), enterolactone (ENL) and enterodiol (END) in the concentration range of 0·001, 0·01 and 0·1 µm for 24 h and the accumulated TAG were measured by the Oil-Red-O assay. Values are means of six experiments (n 12 per dose), with their standard errors represented by vertical bars. ![]() , Control;
, Control; ![]() , PA;
, PA; ![]() , PA+7-HMR;
, PA+7-HMR; ![]() , PA+TEP;
, PA+TEP; ![]() , PA+END;
, PA+END; ![]() , PA+ENL. PA-treated cells v. control untreated cells, P=actual value.
, PA+ENL. PA-treated cells v. control untreated cells, P=actual value.
Quantification of TAG accumulation in HEPA 1–6 hepatocytes
In the treated mice, the liver appeared to be responsive to lignan through the inhibition of the diet-induced steatosis, and thus we used a model of liver steatosis in vitro, the HEPA 1–6 hepatoma cells, to identify direct mechanisms of action of the lignans. The cells were challenged with the SFA PA for 24 h and the accumulated lipids were measured by the Oil-Red-O assay. Fig. 8 shows that TAG content was significantly higher in PA-treated cells. The addition of ENL and END decreased PA-induced TAG accumulation starting at the concentration of 0·001 µm, whereas 7-HMR and TEP were effective only at supraphysiological doses (10 µm) (not shown).
Discussion
Lignans are expected to have beneficial effects in humans after fermentative conversion in the colon to bioactive metabolites that may favourably influence parameters related to the metabolic syndrome( Reference Xu, Liu and Zhang 27 ). Here we studied the effects of 7-HMR and TEP (a mixture of 7-HMR and allo-HMR) from P. abies as anti-obesity compounds at doses that can be reached through nutraceutical supplementation or approached with a lignan-rich diet( Reference O’Neill, Bohl and Gregersen 28 ). The study was performed in C57BJ/6 mice, which, among the mouse models of obesity, show the best similarities to human obesity( Reference Smith, Andrews and West 29 – Reference Yue, Cheng and Breschi 32 ). Moreover, similar amounts of the ENL metabolite are observed in our 7-HMR-treated mice and in people on lignan-rich diets, supporting the use of this rodent model for metabolic studies.
The novelty of our results is the demonstration that 7-HMR and TEP exhibit marked effects in limiting body weight, total fat mass deposition, liver steatosis and serum lipids (total cholesterol, LDL-cholesterol and TAG) in mice on a HFD and improve sugar metabolism controlling blood sugar level, insulin concentration and insulin resistance, all strongly altered parameters in the obese mice. The activity of these compounds on metabolic pathways in fat tissue was evidenced at the level of the expression of modulated genes such as PPARγ and C/EBPα, which are master regulators of fat metabolism whose activity is critical for progression to the final stages of adipocyte differentiation( Reference Rosen 33 – Reference MacDougald and Lane 35 ).
In the mouse liver, the fat-rich diet inhibited regulators of lysosomal biogenesis and autophagy pathways such as the master gene TFEB in parallel to an increase in fat accumulation and the induction of severe steatosis, in line with the observations of Settembre et al.( Reference Settembre, De Cegli and Mansueto 36 ) who showed that autophagy is required for lipid degradation via the TFEB pathway. 7-HMR and TEP increased TFEB to levels found in the liver of mice on the LFD (10 % fat), suggesting that the TFEB-regulated pathway may be one of the mechanisms through which lignan can prevent liver steatosis. Amelioration of liver steatosis was also investigated in vitro by using the HEPA 1–6 model. Both the metabolites ENL and END were effective in limiting fat accumulation experimentally induced in these cells, already at the concentration of 1 nm, whereas 7-HMR and TEP showed no effect, indicating that the inhibition of lipid accumulation in the liver is exerted by these dietary compounds in their metabolised form at concentrations as can be found in human plasma of subjects consuming a lignan-rich diet( Reference Smeds and Hakala 20 , Reference Smeds, Hakala and Hurmerinta 21 ).
In the attempt to further delineate mechanisms at fat-cell level, we studied our chemicals in 3T3-L1 cells, a model of adipocyte differentiation. 7-HMR exerted anti-adipogenic effects, although both metabolites ENL and END showed much higher efficiency. At the molecular level, all the lignans effectively inhibited the C/EBPα and aP2 transcription factors, whereas only 7-HMR and ENL modulated PPARγ expression, suggesting that inhibition of lipid accumulation may probably involve an indirect control of PPARγ through C/EBP family members. C/EBPα (C/EBP homologous protein) is a factor that directly or indirectly can affect PPARγ expression, stability and activity and consequently adipogenesis. This can occur through co-activators of the C/EBP family, possibly CHOP, a dominant negative form of the C/EBP members( Reference Li, Huang and Chen 37 ) that blocks adipogenesis( Reference Batchvarova, Wang and Ron 38 ) through inhibition of C/EBPβ, which is expressed early in the differentiation programme and is the transcriptional activator of PPARγ and C/EBPα. These in vitro data, however, do not unequivocally illustrate what might occur in vivo. Although several studies confirm our data regarding the up-regulation of PPARγ during the anabolic course of lipid storage in HFD-fed mice( Reference Bandera Merchan, Tinahones and Macías-González 39 ), a recent work by Soccio et al.( Reference Soccio, Li and Chen 40 ) with genomic experiments showed a reduced level of PPARγ and PPARγ DNA/chromatin occupancy in obese mice consistent with earlier reports( Reference Pedersen, Guilherme and Danai 41 ). In the attempt to interpret these apparently contrasting data, we can consider that PPARγ may perform different functions in metabolically sick rodents compared with healthy ones, as recently discussed by Bandera Merchan et al.( Reference Bandera Merchan, Tinahones and Macías-González 39 ). Similarly, in healthy subjects, a HFD induces PPARγ, whereas the same diet decreases PPARγ in morbidly obese patients( Reference Garcia-Fuentes, Murri and Garrido-Sanchez 42 ). In our healthy mice fed the HFD, we also registered an increase in PPARγ levels and, following the observations of the cited authors, it would be informative to study the levels of PPARγ in this model when the disease aggravates towards morbid obesity after longer periods on the HFD.
We just mentioned above that 7-HMR metabolites show higher efficiency in inhibiting cell differentiation in 3T3-L1 cells already at nm doses. However, knowing that metabolism of 7-HMR takes 24–48 h to be 95 % complete, that C max for ENL is reached at 24 h and that ENL appearance continues up to 72 h and more( Reference Udani, Brown and Tan 16 ), we also included 7-HMR and TEP in our in vitro experiments. The results show that unmodified 7-HMR was effective only at 1 µm, indicating that its metabolism is required for full biological activity and that in its unmodified form it only marginally contributes to the observed effects. Consistently with this, in HEPA cells a significant inhibition of TAG accumulation is achieved only by the metabolised lignans. In contrast, at the molecular level all the lignans were effective on the expression of C/EBPα and aP2 in 3T3-L1 cells, probably indicating that other factors involved in the differentiation process are differentially targeted by the specific lignans( Reference Kim, Kim and Seo 43 ).
This represents the first comprehensive study of 7-HMR on metabolic functions altered by HFD at doses that can be reached through nutraceutical supplementation and dietary intake. The highest amount of 7-HMR can be assumed in a nutraceutical form. HMRLignan™ can provide an intake of about 2–3 mg/kg, depending on the formulation (36–144 mg/d)( Reference Udani, Brown and Tan 16 , Reference Cosentino, Marino and Pacchetti 44 ). 7-HMR is also the most abundant lignan in cereals and the dominant lignan in wheat, triticale, oat and millet bran (from 3 up to 7–9 mg/100 g)( Reference Smeds, Eklund and Sjöholm 10 ). It is present at a high concentration in sesame (17 mg/100 g)( Reference Smeds, Eklund and Willför 45 ), which is often consumed daily as sesame paste (tahin) in the Middle Eastern countries and it is widespread in several plants (i.e. 1·3 mg/100 g cranberry seeds)( Reference Smeds, Eklund and Willför 45 ). Consumption of a diet rich in these foods may bring 7-HMR daily intake to as much as 30 mg/d, very close to nutraceutical doses. Moreover, the ENL levels (39 ng/ml) reached in plasma of our mice treated with 3 mg/kg of 7-HMR are quite close to the concentration of ENL that can be found in people consuming conventional northern European diets (14·8 and 12 ng/ml)( Reference Smeds and Hakala 20 , Reference Bolvig, Kyrø and Nørskov 46 ) and lignan-fortified diets (21 ng/ml)( Reference Vanharanta, Mursu and Nurmi 47 ), but we can realistically hypothesise that it can be found at a higher concentration in people consuming lignan-richer diets with the food components cited above (i.e. Middle Eastern or Mediterranean diets)( Reference Zanella, Biasiotto and Holm 48 ).
In conclusion, this work adds novel information to what has been found for other lignans in similar models( Reference Brown, Poudyal and Panchal 4 , Reference Biasiotto, Penza and Zanella 13 , Reference Imran, Ahmad and Anjum 49 , Reference Adolphe, Whiting and Juurlink 50 ) and highlights the physiological relevance of 7-HMR from nutraceutical and nutritional sources.
Acknowledgements
The authors thank Stephanie Hodeib for English writing and Alessandro Bulla for editing assistance. The authors thank Moris Cadei for histochemical analysis.
This work was supported in part by European Union Grants QLK4-CT-2002-02221 (EDERA) and LSHB-CT-2006-037168 (EXERA), Fondo Ex.60 % (G. B. and I. Z.) of the University of Brescia.
G. B. and I. Z. performed animal treatments, autopsy, tissue collection, detailed experimental design, Echo MRI analysis and in vitro assays (3T3-L1, HEPA6 cells). F. P. performed tissue extraction and qRNA analysis, gene expression analysis and in vitro assays (3T3-L1). M. C. performed histology. I. A. carried out blood collection from the mice, analysis of biochemical parameters, monitoring of animal health and animal care and quantification of food and water consumption. M. L. and B. P. contributed to preparation of chemicals to be administered, title and analytical control of chemical purity and performed quality control. E. M. carried out adipocytic differentiation in vitro and gene expression profiles from cell cultures (3T3-L1). P. M. and R. A. carried out cell culture maintenance; animal maintenance, care, feeding and control; and DNA extraction and amplification. (Moreover, they performed HPLC and MS analysis on several markers that, although not present in this article, greatly contribute to understand the efficiency of the studied chemicals.) G. D. P. performed data analysis, linearity, accuracy and precision, and contributed in writing the paper for his part of competence. F. S. carried out statistical analysis of the in vivo experiments and contributed to writing the paper for his part of competence. A. S. performed determination of 7-HMR and metabolites in mouse serum. D. D. L. contributed to study conception and design, data analysis and in writing the paper.
Two scientists from the company that manufactures and markets the studied chemicals contributed to this work (M. L. and B. P., Linnea SA).