


In various healthcare settings, a significant proportion – up to a third of old patients are at risk of malnutrition or malnourished(Reference Leij-Halfwerk, Alfwerk and Verwijs1), commonly as the result of inadequate food intake, unmet increased protein and energy demand, chronic diseases, polypharmacy or functional disability(Reference Chapman2). Malnutrition significantly increases short-term and long-term risks of longer hospital stay, morbidities, disability, poor quality of life and mortality(Reference Chapman2).
Numerous nutritional screening tools have been developed and validated for use, mostly with acutely ill inpatients in hospital settings and shown to predict clinical outcomes such as complications, hospital length of stay and short-term mortality. However, there is ‘no one size fits all’ nutritional screening tool that is appropriate for different settings(Reference van Bokhorst-de van der Schueren, Guaitoli and Jansma3). As risk factors for malnutrition differ among healthcare settings, a nutritional screening tool that is validated for use for example in the hospital setting may not be appropriate for use in primary care settings(Reference Power, Mullally and Gibney4). Few studies have developed and validated a nutritional screening tool specifically for use with older adults in community or primary care settings.
We recently reported the development of a new geriatric malnutrition risk index that is designed specifically for use in primary care using data from a population-based study of community-dwelling older adults aged 55 years and above. The Elderly Nutritional Index for Geriatric Malnutrition Assessment (ENIGMA) comprises four questions: unable to shop, cook or feed one’s self, difficulty eating due to oral problem, eat few fruits or vegetables, five or more drugs a day and four blood indicators: low albumin, Hb, total cholesterol and lymphocyte count(Reference Ng, Nyunt and Gao5). The index accurately predicted long-term 10-year mortality risk, independently of age, sex, chronic diseases, comorbidity and inflammatory status, with superior accuracy than the Mini Nutritional Assessment Short Form (MNA-SF)(Reference Vellas, Villars and Abellan6,Reference Rubenstein, Harker and Salva7) or the Geriatric Nutritional Risk Index (GNRI)(Reference Bouillanne, Morineau and Dupont8,Reference Cereda and Pedrolli9) in the community setting.
For a malnutrition risk scale to be accepted as a useful measurement tool, it is important to demonstrate that it correlates with a currently accepted scale(s) for malnutrition risk (concurrent validity), and that it is related to elements of a commonly understood construct of malnutrition (construct validity), and in particular to whether it predicts a future adverse health outcome(s) of malnutrition risk (predictive validity). In addition, it is important that the performance of the malnutrition risk scale that is validated in one population sample should be replicated in another external population sample, thereby demonstrating its generalisability and portability to other similar populations and settings.
The ENIGMA was originally developed and validated among community-living older persons participating in the first wave recruitment cohort of the Singapore Longitudinal Ageing Studies (SLAS-1)(Reference Ng, Nyunt and Gao5). The aim in this current study was to further validate the ENIGMA in an external study population of older adults belonging to a second wave recruitment cohort of the SLAS-2. We evaluated the concurrent and construct validity of the ENIGMA by assessing and its correlation and agreement with the MNA-SF and the GNRI, and its association with known socio-economic, behavioural, medical, physical and functional risk factors of malnutrition. Predictive validity was evaluated by comparing the performance of ENIGMA, MNA-SF and GNRI in predicting risks of functional dependency and 10-year mortality risk.
Methods
Study participants
The SLAS is an ongoing observational population-based prospective cohort study of ageing and health transition among older adults, aged 55 years and above in Singapore(Reference Niti, Yap and Kua10,Reference Wei, Nyunt and Gao11) . Two waves of recruitment cohorts from different geographical locations were established: the SLAS-1 cohort, recruited in 2003–2004 comprised participants (n 2804) in the original ENIGMA derivation study as previously described(Reference Ng, Nyunt and Gao5), the second wave recruitment cohort (SLAS-2) comprised 3280 participants who were recruited between 6 March 2009 and 11 June 2013. The present study was conducted on 2824 Chinese participants in the SLAS-2 cohort with complete ENIGMA data and who were followed up on their functional dependency status 4·5 years later and 10-year mortality from 6 March 2009 to 30 April 2019.
The study was conducted according to the guidelines laid down in the Declaration of Helsinki, and all procedures involving human subjects were approved by the Institutional Review Board of National University of Singapore (NUS-IRB 04–140). Written informed consent was obtained from all subjects. Trained nurses visited the participants at home to perform face-to-face questionnaire interviews and clinical measurements and blood draws were performed in a local study site centre. The extensive range of baseline personal and health data included questionnaire, anthropometric and physical performance and blood measurement data related to food intake and nutritional status. Blood measurements were made in overnight fasting blood specimens using standard clinical laboratory methods in an accredited hospital laboratory (National University Hospital National Reference Laboratory).
Measurements
Elderly Nutritional Index for Geriatric Malnutrition Assessment
The ENIGMA was originally developed and validated using data of Chinese participants in the SLAS-1 cohort aged 55 years and above with 10-year follow-up of mortality risk(Reference Ng, Nyunt and Gao5). Briefly, the ENIGMA was derived from sixteen candidate nutritional risk factors including ten indicators found in the National Screening Initiative DETERMINE Your Nutritional Health questionnaire, two body weight indicators and four blood biomarker measures. In Cox proportional hazards risk prediction models adjusting for age, sex, number of comorbidity, chronic inflammation, hypertension, diabetes, cardiac disease and chronic kidney disease, eight indicators were shown to be significant independent predictors of 10-year survivorship: physically unable to shop, cook and/or feed myself; take three or more different drugs a day; tooth or mouth problem causes difficulty eating; few fruit or vegetables (less than 2 portions per day); low Hb (< 12 g/l female, < 13 g/l male); low albumin (< 40 g/l); low total cholesterol < 4·14 mmol/l; low lymphocyte count < 1200/mm3. Using weights derived from regression coefficients, scores are assigned to the presence of each nutritional indicator (0 = not present, 1 = present); the presence of ‘physically unable to shop, cook and/or feed myself’ and ‘low cholesterol’ are given scores of 2. The weighted summed score with potential values from 0 to 10 was derived to create the ENIGMA index. Malnutrition risk was categorised by ENIGMA score as: None (0), Low (1–2), High (3+).
Mini Nutritional Assessment-Short Form
Participants were scored on the MNA-SF (food intake declined due to loss of appetite, digestive problems, chewing or swallowing difficulty, weight loss, mobility, psychological stress or acute disease, neuropsychological problems and BMI)(Reference Vellas, Villars and Abellan6,Reference Rubenstein, Harker and Salva7) . The total scores (ranging from 0 to 14) were used to classify each participant as malnourished (0–7), at risk of malnutrition (8–11) or normal nutritional status (12–14).
GNRI(Reference Bouillanne, Morineau and Dupont8,Reference Cereda and Pedrolli9) . Data on serum albumin, weight and height were used to calculate values for the GNRI, using the following equation:
 $$\text{GNRI} = (1 \cdot 489 \times \text{albumin (g/l)} + 41:7 \times \text{weight/WLo})$$
WLo is the ideal weight which is calculated from the Lorentz equations (When the ‘weight/WLo’ is equal or over 1, the ratio is set to 1).
Baseline co-variables
Socio-demographic status included age, sex, years of education (≤ 6 years, > 6 years), housing status (1–2 room, 3 room, 4+ rooms and others), living arrangement (live alone or live with others) and marital status (single/divorced/widowed or married),
Behavioural measures included smoking (past or current or non-smoker), daily alcohol consumption, physical activity score. Health risk and status included central obesity, low body mass (BMI < 18·5 kg/m2), low HDL-cholesterol (< 1·0 mmol/l), high triglyceride (> 2·2 mmol/l), high fasting blood glucose and diabetes, hypertension or elevated blood pressure, cardiac disease, stroke, multi-morbidity (≥ 5 medical diagnoses), Mini Mental Sate Examination score(Reference Ng, Niti and Chiam12) (scores between 0 and 30, with lower scores indicating poorer cognitive performance) and Geriatric Depression Scale (GDS)(Reference Nyunt, Jin and Fones13) (scores between 0 and 15, with higher scores indicating greater number of depressive symptoms). Physical and functional measurements included mid-calf circumference(Reference Landi, Onder and Russo14) underweight (low BMI < 18·5 kg/m2), knee extension strength(Reference Lord, Menz and Tiedemann15), gait speed, m/s(Reference Nelson, Nevitt and Scott16), timed up-and-go(Reference Shumway-Cook, Brauer and Woollacott17) sit-and-stand 5×(Reference Nakazono, Kamide and Ando18), exhaustion, low physical activity and prefrailty or frailty(Reference Wei, Nyunt and Gao11,Reference Fried, Tangen and Walston19) .
Measurement procedures
Physical activity was measured by the frequency of performance of physical activities of moderate to high intensity that are common among older people locally: brisk walking; taiji or qigong; other physical exercises (jogging, gym workouts); or active sports (bicycling, swimming, tennis, badminton, bowling, golfing, etc), using a three-point Likert scale (1 = less than once a month, 2 = once a month to less than once a week, 3 = once a week or more) to derive a summed score.
Global cognition was assessed by the locally translated and validated version of the Mini Mental State Examination(Reference Ng, Niti and Chiam12) with Mini Mental Sate Examination < 23 indicating cognitive impairment. Depression was assessed using the locally translated and validated version of the Geriatric Depression Scale (GDS)(Reference Nyunt, Jin and Fones13),with GDS score ≥ 5 indicating clinically significant level of depressive symptoms.
Calf circumference was measured using the maximal value obtained with a nonelastic measuring tape on both calves of subjects in the standing position. Knee extension strength was measured for the maximal isometric muscle force using the strap and strain gauge assembly component of the Physiological Profile Assessment(Reference Lord, Menz and Tiedemann15),with the subject sitting with the hip and knee joint angles positioned at 90 degrees in a tall chair, with a strap around the leg 10 cm above the ankle joint, and the spring gauge affixed to a crossbar position behind the subject. The average value (in kilograms) of three trials in the dominant leg was estimated. Gait speed was measured by the time in seconds taken for the participant to cover a distance of 6 m at their fastest pace, averaged for two trials(Reference Nelson, Nevitt and Scott16). Participants performed the test with a dynamic start on a smooth, flat 10-m walkway with red tape markers placed at the 0-, 2-, 8- and 10-metre points along the walkway, allowing for acceleration over the first 2 m and deceleration over the last 2 m. Trained interviewers walking alongside the participants recorded the time to complete the course using a hand-held stop watch. The timing is started when the toes of the leading foot crosses the 2-m mark and stopped when the toes of the leading foot crosses the 8-m mark. The participant is allowed to use his or her usual walking aid.
Timed up and go is used to assess gait and balance. The test measures the time taken for the participant to stand up from a sitting position, walk a distance of 3 m, turn and walk back to the sitting position(Reference Shumway-Cook, Brauer and Woollacott17). The test was performed twice, and the average time recorded. Timed up and go > 12 s predicts high risk of falls among older adults. Sit-and-stand 5×, also called the chair stand test, measures the time to stand up from a standard chair five times, is a surrogate measure of muscle strength in the lower limbs and a cut-off of < 8·5 s is recommended for Asians and is not affected by age or gender(Reference Nakazono, Kamide and Ando18).
The physical phenotype frailty index is based on five criteria used by Fried and colleagues in the Cardiovascular Health Study(Reference van Bokhorst-de van der Schueren, Guaitoli and Jansma3), which has been shown to predict cognitive impairment, functional disability, quality of life and mortality in previous SLAS studies(Reference Wei, Nyunt and Gao11,Reference Fried, Tangen and Walston19) : (1) shrinking or weight loss: BMI of <18·5 kg/m2 and/or unintentional weight loss of ≥ 4·5 kg (10 pounds) in the past 6 months. (2) Weakness: defined as the lowest quintile of knee extension strength within sex and BMI strata (See below). (3) Slowness: defined as gait speed less than 0·8 m/s from the fast gait speed test over 6 metres. (4) Exhaustion was determined by response of ‘not at all’ to the question from SF-12 quality of life scale: ‘Do you have a lot of energy?’ (5) Low activity was determined by self-report of ‘none’ for participation in any physical activity (walking or recreational or sports activity). One-point was assigned for the presence of each component, and the total score categorises participant as frail (3–5 points), pre-frail (1–2 points) or robust (0 point).
Blood measurements included Hb, folate, B12, homocysteine, estimated glomerular filtration rate(Reference Kong, Ma and Chen20) blood cell counts (erythrocytes, erythrocytes distribution width, haematocrit, mean corpuscular volume, mean corpuscular Hb concentration, total leucocytes, neutrophils, lymphocytes, monocytes, basophil and eosinophils counts. Inflammation markers included IL-6, C-reactive protein, tumor necrosis factor, neutrophil:lymphocyte ratio, platelet:lymphocyte ratio, lymphocyte:monocyte ratio, systemic-inflammation index (P × N/L = platelet × neutrophil/lymphocyte)(Reference Li, Wu and Xing21).
Disability was assessed by the need for personal assistance in performing instrumental and basic activities of daily living found in the Barthel and the Lawton indexes(Reference Ng, Niti and Chiam22,Reference Niti, Chiam and Kua23) . Functional dependency was defined by the presence of at least one instrumental or basic Activities of Daily Living (ADL) dependency at baseline and follow-up.
Mortality follow-up
The survival status and date of death of the participants were determined using the participants’ unique National Registration Identity Card number for computerised record linkage with the National Death Registry through the National Disease Registry Office of the Ministry of Health. Survival time was measured from the date of the participant’s interview until death or end of the follow-up period (30 April 2019), whichever came first.
Statistical analysis
Comparisons of group means or proportions by ENIGMA categories were made using ANOVA and χ 2 tests of significance. Correlations between ENIGMA, MNA-SF and GNRI were measured using Spearman’s rho (Rs); percentage agreement was calculated as the number of categorical ratings that agree for two measures, divided by the total number of ratings made, multiplied by 100. Agreement beyond chance was assessed by the Cohen’s kappa. Survival analyses with the Kaplan–Meier method were performed on time-to-event data, censored at date of death or on 30 April 2019. Cox regression analyses satisfying proportional hazard assumptions were used to estimate hazard ratios and 95 % CI of mortality rates. The results presented here are based on complete case analyses for 2468 participants. Similar results were obtained using imputed data analyses which accounted for 320 participants who had missing data on one or more of the ENIGMA indicators. The predictive accuracy of the ENIGMA, MNA–SF and GNRI indexes were compared by receiving operating curves techniques and the C-index. Statistical significance was set at P < 0·05. All data analyses were performed using IBM SPSS 25 software (IBM). As the study involved secondary analysis of an observational study with large sample size, no prior sample size and power estimation was performed.
Results
The mean age of the cohort was 66·8 (sd = 7·7) years and 62·8 % were women. Among them, 28·7 % were categorised by ENIGMA as no risk (zero score), 43·7 % as low risk (1–2) and 17·5 % as moderate to high risk (3–10). Table 1. The main components of the ENIGMA index were use of five or more drugs (40 %), low albumin (34 %), low Hb (31 %) and low total cholesterol (22 %). Among participants in the highest (3+ or moderate to high) risk category, 58 % showed low total cholesterol, 52 % used five or more drugs, 44 % showed low Hb and 42 % showed low albumin.
Table 1. Elderly Nutritional Index for Geriatric Malnutrition Assessment (ENIGMA): association with Mini Nutritional Assessment Short Form (MNA-SF) and Geriatric Nutritional Risk Index (GNRI) and component nutritional indicators
(SLAS2 Chinese n 2468)
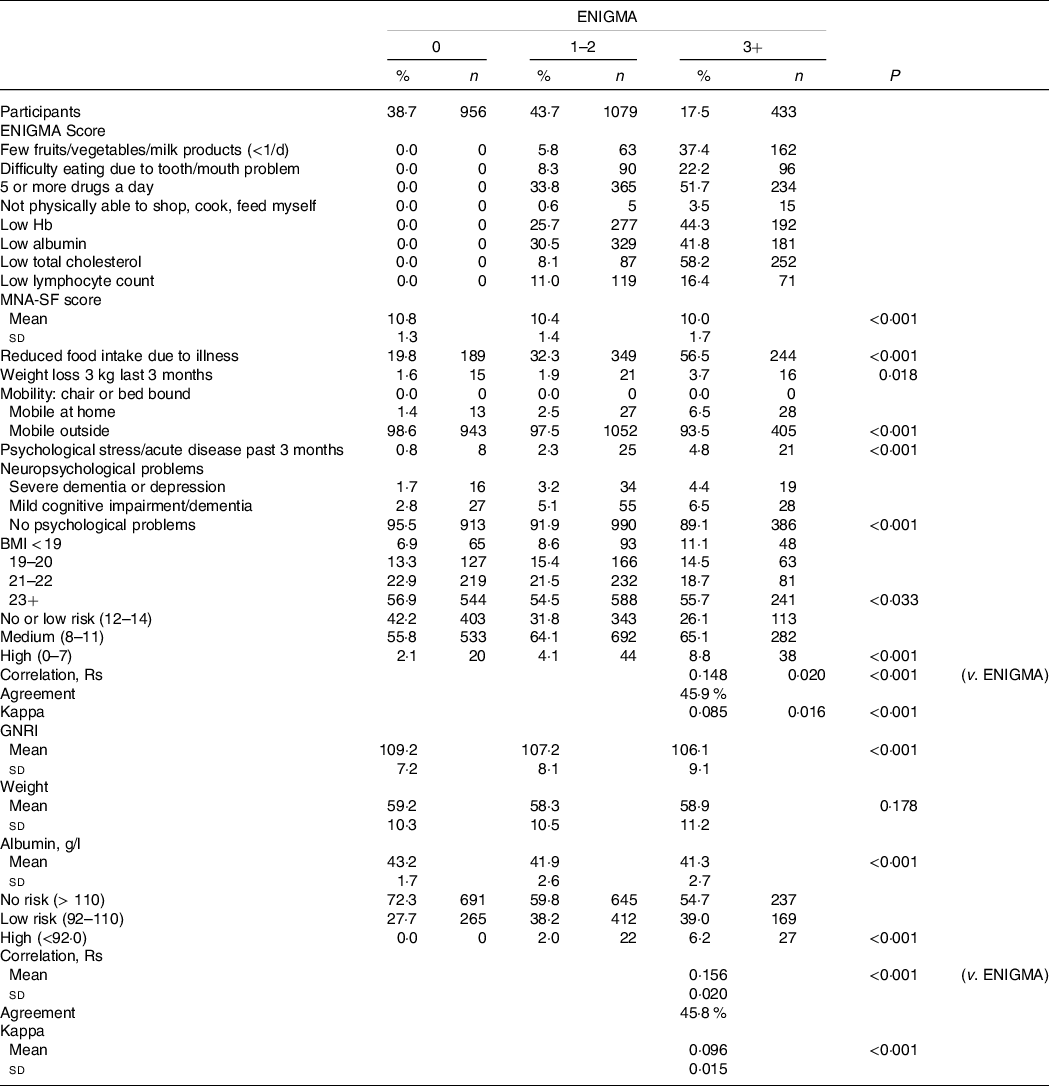
Figures shown are % (n) or mean ± sd.
MNA-SF and GNRI: correlation Rs = 0·47 ± 0·014 (P < 0·001); percentage of agreement = 61·7 %; kappa = 0·33 ± 0·015 (P < 0·001).
Construct validity
Higher ENIGMA risk categories were significantly associated with older age and male sex, indicators of economic deprivation and social isolation (lower education and housing status, being single/widowed or divorced, living alone), negative health behaviour (smoking, low physical activity), markers of the metabolic syndrome (low HDL-cholesterol, high TAG, high fasting blood glucose and diabetes, hypertension or high blood pressure) and prevalent clinical comorbidity: cardiac disease, stroke and multi-morbidity (≥ 5 medical diagnoses), as well as poor Mini Mental Sate Examination cognitive performance score and GDS depression score (Table 2). It was also significantly associated with low body mass (BMI < 18·5 kg/m2) and poorer muscle strength and functional mobility (knee extension strength, gait speed, timed up-and-go and sit-and-stand 5×), physical exhaustion and frailty. As well, there were significant associations with blood biomarkers of hyperhomocysteinaemia, low glomerular filtration rate, anaemia (Hb, haematocrit, erythrocytes count, erythrocyte distribution width, haematocrit, mean corpuscular volume and mean corpuscular Hb concentration), as well as lower lymphocyte counts, higher monocyte, basophil and eosinophil counts and indexes of inflammation (C-reactive protein, tumor necrosis factor, neutrophil:lymphocyte ratio, platelet:lymphocyte ratio, lymphocyte:monocyte ratio, and SII (P × N/L).
Table 2. Clinical, physical, and blood biomarkers by Elderly Nutritional Index for Geriatric Malnutrition Assessment (ENIGMA) nutritional risk categories in SLAS2 participants (n 2468)
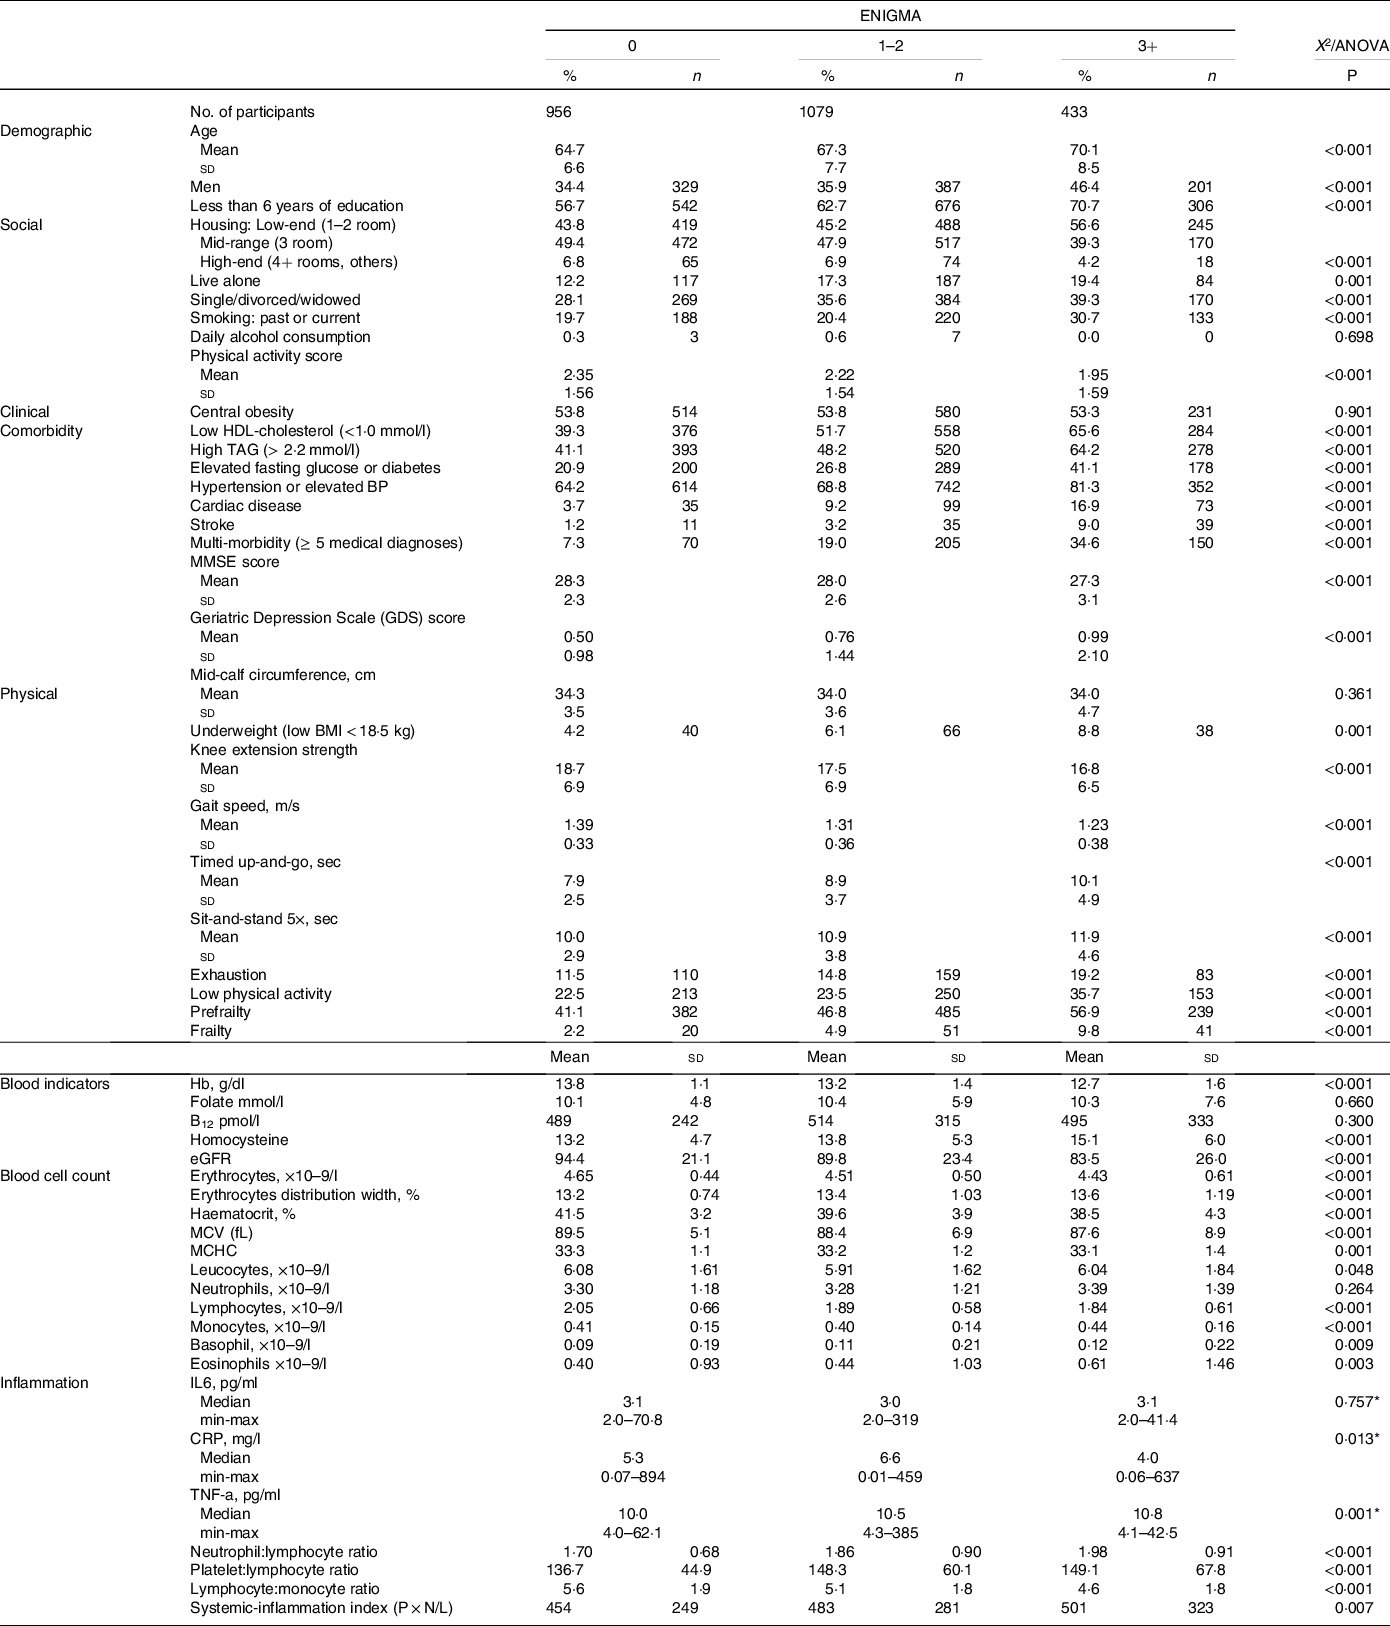
eGFR, estimated glomerular filtration rate; MCV, mean corpuscular volume (fL); MCHC, mean corpuscular Hb concentration (pg); CRP, C-reactive protein; TNF-a, tumor necrosis factor.
Figures shown are % (n) or mean ± sd.
* Significance test with log-transformed dependent variable.
Table 3. Logistic regression models: Elderly Nutritional Index for Geriatric Malnutrition Assessment (ENIGMA), Mini Nutritional Assessment Short Form (MNA-SF) and Geriatric Nutritional Risk Index (GNRI) predicting basic and instrumental Activities of daily living functional dependency at baseline and follow

NE, not estimated.
For GNRI, medium and high categories were combined because of small number in both categories.
* P < 0·05;
** P < 0·01;
*** P < 0·001.
† Adjusted for sex, age, housing status, education status, smoking, physical activity score, multi-morbidity, cognitive impairment, GDS depression and baseline number of instrumental/basic ADL dependencies (for functional dependency at follow-up).
Concurrent validity
Higher ENIGMA risk category was significantly associated with lower scores (higher malnutrition risk) of MNA-SF and its components (reduced food intake due to illness, weight loss, mobility, psychological stress/acute disease, neuropsychological problems and BMI). It was also significantly associated with lower GNRI scores (higher malnutrition risk). Table 1 Although ENIGMA was significantly correlated with MNA-SF and GNRI, the level of concordance was low. (Table 1) The percentage of agreement overall was about 46 % for both MNA-SF and GNRI.
Predictive validity
We assessed the associations of ENIGMA with baseline and follow-up functional dependency which are known adverse health outcomes of malnutrition, in comparison with MNA-SF and GNRI. For all three indexes, the highest category of malnutrition risk was significantly associated with approximately three- to sixfold increased odds of association with functional dependency at baseline in unadjusted analyses. Not surprisingly, MNA-SF (which includes mobility as its component risk factor) showed the highest OR (5·75) of association with functional dependency. We thus performed hierarchical regression models controlling for age, sex, education, housing status, smoking, physical activity, multi-morbidity, mobility, cognitive impairment and depression. MNA-SF was not significantly associated with baseline functional dependency after fully adjusting for these variables. On the other hand, after controlling for the same variables, only ENIGMA high risk remained significantly associated with baseline functional dependency (OR = 1·64, 95 % CI 1·01, 2·65). Furthermore, in univariate analyses, ENIGMA medium and high risk significantly predicted functional dependency at follow-up (OR = 1·71, 95 % CI = 1·01, 2·89) and OR = 2·68, 95 % CI = 1·45, 4·98, respectively), whereas neither MNA-SF nor GNRI predicted follow-up functional dependency. Similar trends of associations were observed in subgroup analyses of older participants aged 65 years and above.
We compared the predictive validity for mortality outcomes of ENIGMA with MNA-SF and GNRI (Table 4). For all indexes, the highest categories of malnutrition risks were associated with up to three- to fourfold increased mortality risks in crude analyses. Further controlling for sex, age, housing status, education status, smoking, physical activity score, multi-morbidity, cognitive impairment, GDS depression, and number of instrumental/basic ADL dependency at baseline reduced the hazard ratio for all indexes, but only the hazard ratio for ENIGMA moderate to high malnutrition risk remained significant (hazard ratio = 1·65 (95 % CI 1·04, 2·62). Similar trends of associations were observed in subgroup analyses of older participants aged 65 years and above.
Table 4. Cox regression models of Elderly Nutritional Index for Geriatric Malnutrition Assessment (ENIGMA), Mini Nutritional Assessment Short Form (MNA-SF) and Geriatric Nutritional Risk Index (GNRI) predicting 10-year all-cause mortality
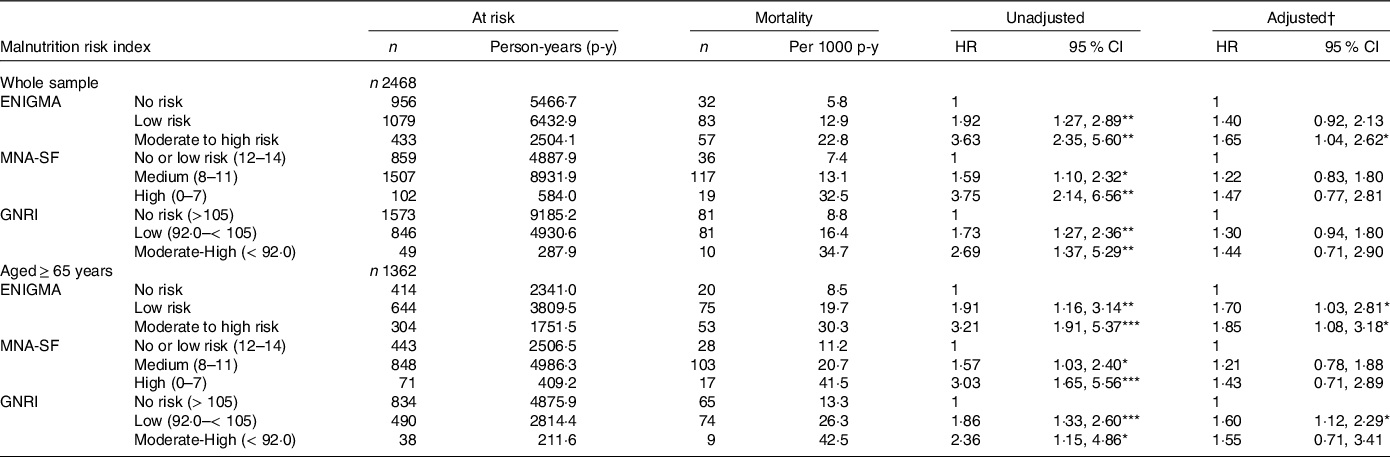
* P < 0·05;
** P < 0·01;
*** P < 0·001.
† Adjusted for sex, age, housing status, education status, smoking, physical activity score, multi-morbidity, cognitive impairment, GDS depression and number of instrumental/basic ADL dependency at baseline.
Discriminant accuracy
We estimated the AUC from receiver operating characteristics analyses (Fig. 1). These show that for functional dependency and mortality outcomes, discriminant accuracies were uniformly greater for ENIGMA than MNA-SF or GNRI, although not all comparisons were statistically significant. Similar trends of associations were observed in subgroup analyses of older participants aged 65 years and above (data not shown).
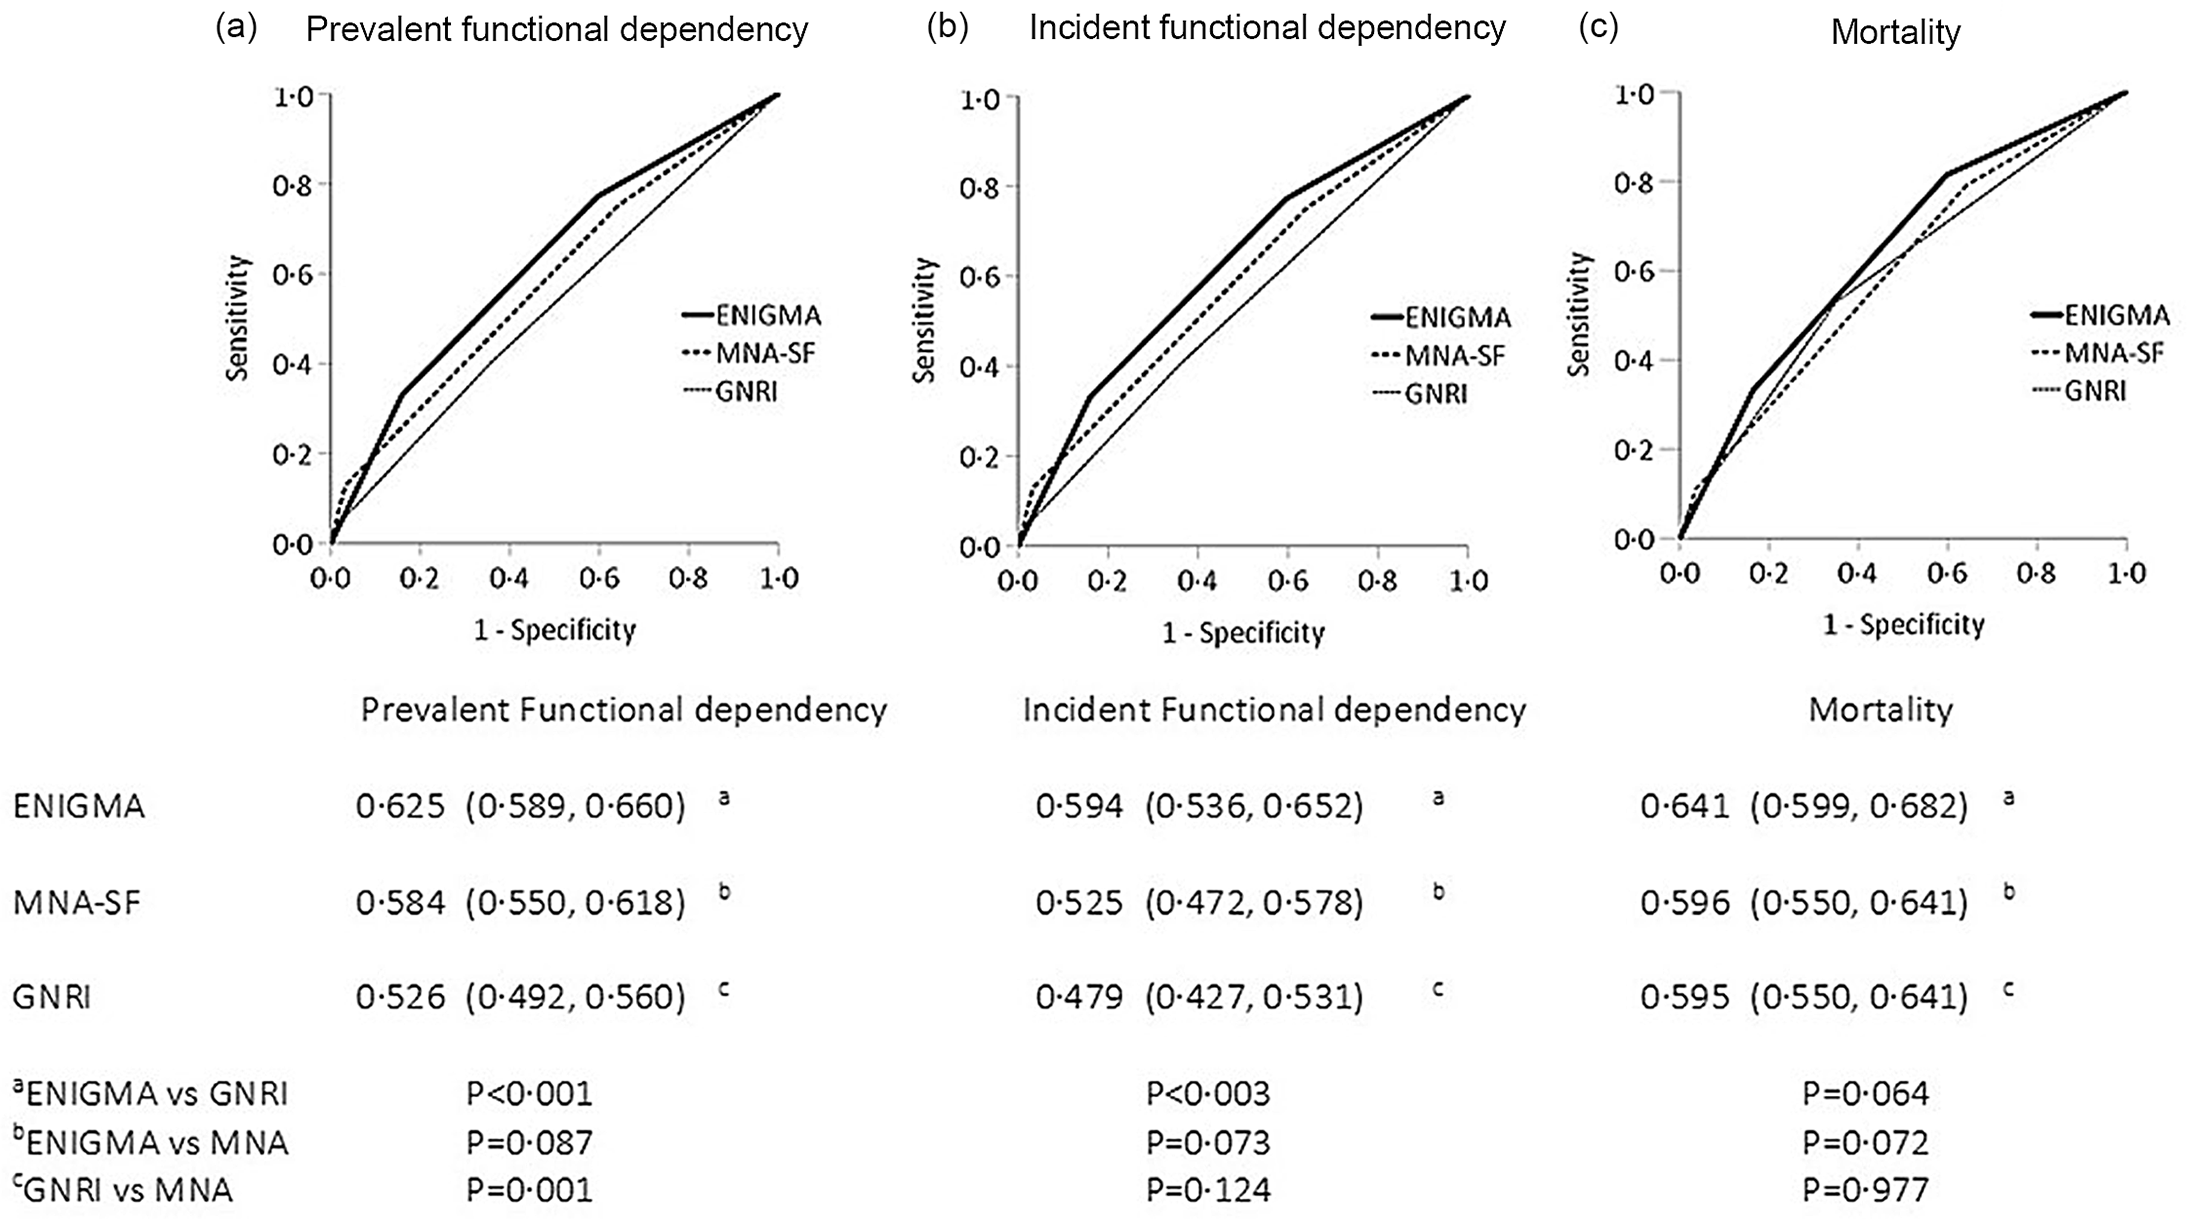
Fig. 1. Receiver operating curves of discriminant accuracy of Elderly Nutritional Index for Geriatric Malnutrition Assessment (ENIGMA), Mini Nutritional Assessment Short Form (MNA-SF) and Geriatric Nutritional Risk Index (GNRI) predicting (a) prevalent functional dependency, incident functional dependency, (b) 10-year mortality (Whole Sample).
Discussion
We previously reported the derivation of the ENIGMA malnutrition risk index and showed its predictive validity for mortality outcomes among community-dwelling older adults(Reference Ng, Nyunt and Gao5). In the present study, we further validated the ENIGMA index in an external cohort of community-dwelling older adults. The second wave SLAS2 cohort differs from the first wave SLAS1 cohort on geographical location, and their socio-economic and health status were somewhat better. In the previous study, the ENIGMA demonstrated higher predictive validity than the MNA-SF and GNRI for 10-year mortality (ENIGMA C = 0·67 v. MNA-SF C = 0·59 v. GNRI C = 0·57). In the present study, we replicated in crude analysis the ENIGMA’s relatively stronger performance for predicting functional dependency and 10-year mortality.
The construct validity of the ENIGMA was supported by its strong association with known risk factors and correlates of malnutrition, including economic deprivation and social isolation, physical inactivity, metabolic syndrome, chronic diseases, multi-morbidity, impaired physical, cognitive and mental functioning, low BMI and blood biomarkers of nutritional state and inflammation. Concurrent validity was shown by its significant correlations with other established indexes of malnutrition risk, but their low concordance suggests that they measure different aspects of malnutrition risk. Similar discrepancies in classification of individuals using GNRI scores compared with MNA-SF scores and low concordance of 10 % to 20 % have also been previously reported(Reference Abd-EI-Gawad, Abou-Hashem and El Maraghy24–Reference Alert, Villarroel and Formiga26).
The observed differences in performance among the tools can be ascribed to differences in their measurement components. The ENIGMA comprises four simple questions on food intake adequacy: food access and intake, absorption and availability and quality and four blood biomarkers of nutritional and inflammation status (albumin, cholesterol, Hb and lymphocyte count). The GNRI comprises albumin and weight measurements, whereas the MNA-SF comprises six questions on food intake, body weight, physical mobility and neuropsychiatric problems. Because of this, we observed differences in predictive ability for functional dependency and mortality, before and after taking into account risk factor covariates especially functional mobility, cognitive impairment and depression. Unsurprisingly with regard to the MNA-SF, which includes features of mobility, cognitive impairment and depression, it strongly predicted prevalent functional dependency and mortality in unadjusted analyses, but not in adjusted analyses. On the other hand, the ability of ENIGMA to predict functional dependency and mortality was robust to these covariate adjustments. Its predictive validity is not directly driven by its tacit association with functional mobility, cognitive impairment and depression, but it was able to capture additional variance in measurement of malnutrition risk that independently predict mortality outcomes. This thus suggests that it has enhanced ability to identify malnutrition among elderly individuals, including especially non-frail individuals without physical, cognitive or mental disability in the community.
The MNA-SF is a widely used tool recommended by the European Society for Clinical Nutrition and Metabolism Guidelines for nutritional screening of the elderly(Reference Kondrup, Allison and Elia27,Reference Beck, Holst and Rasmussen28) . Studies have variously reported that MNA was predictive of in-hospital mortality but not long-term mortality of acutely hospitalised patients(Reference Abd-EI-Gawad, Abou-Hashem and El Maraghy24,Reference Raslan, Gonzalez and Dias29,Reference Vischer, Frangos and Graf30) , or predicted 4-year mortality in community-dwelling older persons(Reference Wang and Tsai31). We found in our previous study that the MNA-SF as well as the GNRI predicted significantly increased mortality risks, but in the present study there was weaker support for their predictive validity.
Another contributing factor to the observed discrepancies is the fact that the different malnutrition risk indexes were applied on community-living older adults in the population. The frequency distribution of individuals classified by risk categories are strikingly different for the ENIGMA, MNA-SF and GNRI. The ENIGMA classifies proportionately more individuals in the top risk category than the MNA-SF or GNRI. Conversely, the very small numbers of individuals classified in the top malnutrition risk categories of the MNA-SF and GNRI suggest that their scaling properties were limited in covering a broad range of malnutrition risk among older adults in the community who are relatively less malnourished compared to hospitalised patients. This small number partly explains the observation that their elevated mortality risk estimates were not statistically significant. Furthermore, the present study population had an even more favourable socio-demographic and health profile than our previous study population. The relatively smaller number of older individuals who are malnourished thus restricts the study power for effect estimation. Despite this, the ENIGMA maintained its robust performance, and this strengthens its external validity for assessing malnutrition risks in a diverse population.
As the ENIGMA was developed and validated among community-dwelling older adults, these results thus support its potential use in geriatric patients in primary care settings. It is potentially a useful clinical tool for assessing malnutrition risk as well as prognostication of their medium to long-term likelihood of functional dependency and life expectancy. It is brief and simple to use, without the need for comprehensive or brief geriatric assessment of physical or neuropsychiatric impairment. It involves four blood tests of Hb, albumin, total cholesterol, lymphocyte count which are routine and simple clinical laboratory tests commonly conducted in modern primary care. Nevertheless, the generalisability of the ENIGMA when applied to ambulatory older patients with chronic diseases in primary care or hospital outpatient clinics should be further investigated in future studies. More studies should also be conducted to evaluate whether the application of the ENIGMA in diverse settings result in measurable changes in nutritional status and tangible impacts on health outcomes and life expectancy.
Conclusion
In the present study, the concurrent and predictive validity of the ENIGMA construct is replicated in an external evaluation study of community-dwelling older persons, supporting its accuracy and utility in assessing malnutrition risks among community-dwelling older adults.
Acknowledgements
This work was supported by research grants from the Agency for Science Technology and Research (A * STAR) Biomedical Research Council (BMRC/08/1/21/19/567) and the National Medical Research Council (NMRC/1108/2007; NMRC/CIRG/1409/2014). We thank the following voluntary welfare organisations for their support: Geylang East Home for the Aged, Presbyterian Community Services, St Luke’s Eldercare Services, Thye Hua Kwan Moral Society (Moral Neighbourhood Links), Yuhua Neighbourhood Link, Henderson Senior Citizens’ Home, NTUC Eldercare Co-op Ltd, Thong Kheng Seniors Activity Centre (Queenstown Centre) and Redhill Moral Seniors Activity Centre.
T. P. N. had full access to all of the data in the study and has primary responsibility for final content. S. H. and T. P. N. reviewed the literature, designed the study, analysed the data, drafted and revised the manuscript. Q. G., X. G., D. Q. L. C., P. Y., K. B. Y. and S. L. W. contributed to the study design and data collection. All authors reviewed the results and drafts and approved the final manuscript.
All authors declare no real or potential conflicts of interest.


