

The two pivotal diet components that have been most intensively studied in relation to chicken growth in diets are protein and total metabolisable energy; however, energy may be derived from carbohydrates (principally starch), protein itself and lipids. The key feed ingredients in practical poultry diets are feed grains, protein sources, lipids, minerals and vitamins. Diets are formulated from a relatively short list of feedstuffs to a set of nutrient requirements designed to meet the needs of modern-genotype broiler chickens for optimal performance on a ‘least-cost’ basis. The influence of the balance of protein and metabolisable energy on animal performance was studied in the literature( Reference Campbell and Dunkin 1 , Reference Black 2 ); however, insufficient attention is being paid to the relationships among the various sources of energy. The intention of this study was to take energy sources into consideration to investigate the interactions between protein, non-protein energy sources and broiler performance using unconventional diets and taking advantage of nutritional geometry in the design and analysis of the experiment.
Practical poultry diets are designed to meet the nutrient requirements for optimal performance in broiler chickens. Conventionally, nutrient requirements for a given parameter in broiler chickens are evaluated by feeding studies with factorial designs using a ‘one-variable-at-a-time’ (OVAT) approach, where the level of a single dietary component varies while the others are kept constant( Reference Ruohonen, Simpson and Raubenheimer 3 ). These investigations usually involve iso-energetic and/or iso-nitrogenous diets. In this context, however, OVAT experiments may overlook interactions between the focal nutrient and the ‘other’ nutrients and invalid conclusions may be drawn. The disadvantages of OVAT experiments can be overcome by adopting the principle of mixture designs( Reference Ruohonen, Simpson and Raubenheimer 3 ) where the total amount of the mixture is held constant, which detects responses to the relative proportions of different components in the mixture. Furthermore, a geometric framework uses Euclidean geometry to relate feeding behaviour and animal nutrition to responses in growth and nutrient utilisation( Reference Simpson and Raubenheimer 4 ). Rather than a more conventional equilateral-triangle mixture design, this study uses a right-angled triangle mixture design (RTM) to create a spatial metaphor, whereby the relationships among the nutritional components may be visualised and interpreted( Reference Raubenheimer 5 ). The present study is one of the few( Reference Bradbury, Wilkinson and Cronin 6 – Reference Liu, Truong and Khoddami 8 ) to adopt this innovative approach in poultry nutrition research to evaluate the influence of macronutrients including starch, protein and lipid on growth performance and nutrient utilisation. Mixture design requires the total amount of the mixture to be held constant. For instance, all the experimental diets in the present study were formulated to be iso-energetic; therefore, macronutrients were expressed as energy derived from starch, protein and fat for statistical purposes. However, it is important to consider that the primary function of macronutrients, especially protein, may not be providing energy.
It is debatable whether modern commercial broiler strains selected for optimal feed intake and growth retain the capacity to adapt to nutritionally challenging environments. Although modern broiler chickens have been heavily selected for optimal growth and carcass yield, their ability to maximise performance by choosing the best possible combination of protein sources has been demonstrated( Reference Gous and Swatson 9 ). This suggests that despite genetic selection and controlled environments, modern broilers still retain the capacity to respond to nutritional challenges. The individual and combined impacts of starch, protein and lipid are important for growth performance, energy utilisation and nutrient digestion in broiler chickens as they represent the major dietary components. Nevertheless, published information is limited because the majority of previous studies( Reference Mateos and Sell 10 , Reference Mateos and Sell 11 ) have used OVAT experimental designs. Therefore, the objective of the present study was to consider the interactions and relative importance between protein and non-protein energy sources on growth performance and nutrient utilisation in broiler chickens by using RTM in nutritional geometry.
Methods
Diet preparation
The feeding study comprised fourteen dietary treatments with various concentrations of starch and protein based on maize-starch, casein, isolated soya protein, synthetic amino acids, sunflower oil and other minor ingredients (Tables 1 and 2). The energy contribution of starch, protein and lipid was considered to be 16·69, 15·51 and 34·31 MJ/kg, respectively( Reference Gous 12 ). All the diets were formulated to be equivalent for energy density (13·60 MJ/kg) but with different proportions of starch, protein and lipid. There were differences in analysed and formulated concentrations of starch, protein and lipid. This is because book values were used for diet formulation, and protein was quantified by using N concentration multiplied by the factor of 6·25. The subsequent response surface analyses in the present study were based on analysed macronutrient values. Fig. 1 illustrates experimental diets in a RTM as described by Raubenheimer( Reference Raubenheimer 5 ). Acid-insoluble ash (AIA) was included in the diets at 40 g/kg as an inert marker to determine nutrient digestibility coefficients at the distal jejunum and distal ileum at 23 d after hatching (CeliteTM World Minerals). The diets were offered to broiler chickens in a mashed form after all the ingredients were thoroughly mixed.
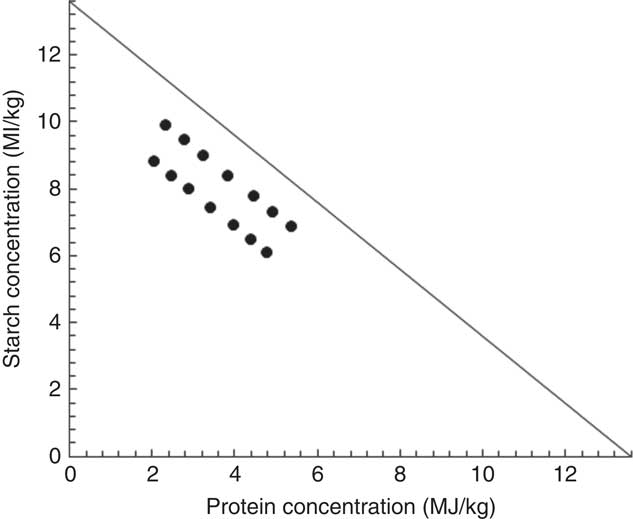
Fig. 1 Plot of energy distributions in fourteen experimental diets in a right-angled mixture triangle.
Table 1 Experimental diets and their designed energy share from starch, protein and lipid
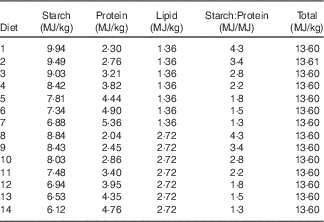
Table 2 Diet compositions and calculated and analysed nutrient specifications in the experimental diets
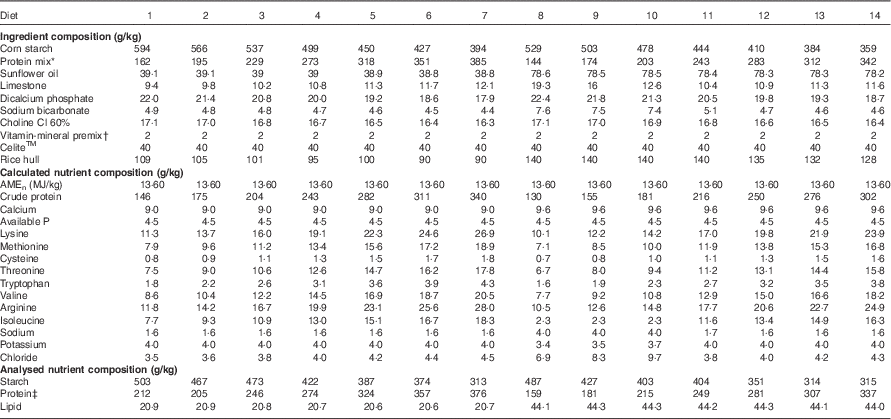
* Protein mix consisted of 31 g/kg dl-methionine, 5·6 g/kg l-lysine HCl, 13·9 g/kg l-threonine, 47·2 g/kg arginine, 97·9 g/kg isolated soya protein, 0·1 g/kg l-valine, 6·1 g/kg l-isoleucine and 798·2 g/kg casein. The calculated nutrition specifications were 72·8 g/kg arginine, 47·6 g/kg isoleucine, 70 g/kg lysine, 49 g/kg methionine, 53·2 g/kg methionine+cysteine, 46·2 g/kg threonine, 11·2 g/kg tryptophan and 53·2 g/kg valine.
† The vitamin–mineral premix supplied per kilogram of feed: in MIU: retinol 0·012, cholecalciferol 0·005; in mg: tocopherol 50, menadione 3, thiamine 3, riboflavin 9, pyridoxine 5, cobalamin 0·025, niacin 50, pantothenate 18, folate 2, biotin 0·2, Cu 20, Fe 40, Mn 110, Co 0·25 mg, I 1, Mo 2, Zn 90, Se 0·3.
‡ Protein concentrations were determined by N content times the factor of 6·25.
Bird management
This feeding study complied with the specific guidelines of the Animal Ethics Committee of the University of Sydney. Male, 1-d-old chicks (Ross 308) were offered a commercial starter diet to 9 d after hatching. They were then identified (wing tags), weighed and allocated into bioassay cages on the basis of their body weight in an environmentally controlled facility. There was no statistical difference in the average body weight for each cage at the beginning of the feeding study. Each of the fourteen dietary treatments was offered to four replicate cages (six birds per cage) or a total of 336 chicks from 10 to 23 d after hatching. Broilers had unlimited access to water and feed under a ‘23-h on–1-h off’ lighting regimen for the first 3 d and then under a ‘16-h on–8-h off’ lighting regimen for the rest of the study. The room temperature was maintained at 32°C for the 1st week, then gradually decreased to 22±1°C by the end of the 3rd week and maintained at the same temperature until the end of the feeding study. Body weight and feed intake were recorded weekly from which feed conversion ratios (FCR) were calculated. The number of deaths or culled birds was recorded daily, and their body weight was used to adjust FCR calculations.
Sample collection and chemical analysis
Excreta samples were collected from 20 to 21 d after hatching to generate data for the analysis of nutrient utilisation (apparent metabolisable energy (AME; MJ/kg and MJ/d), N retention, N-corrected AME (AMEn)) on a DM basis. Excreta samples were freeze-dried and then analysed for gross energy (GE) and AIA concentration. The GE of diets and excreta were determined by bomb calorimetry using an adiabatic calorimeter (Parr 1281 bomb calorimeter; Parr Instruments Co.).
At day 23, all birds were euthanised by intravenous injection of sodium pentobarbitone. The small intestine was removed, and digesta samples were collected in their entirety from the distal half jejunum and distal half ileum. The jejunum and ileum were demarcated by the end of the duodenal loop, Meckel’s diverticulum and the ileocaecal junction. Digesta samples from birds within a cage were pooled, homogenised, freeze-dried and ground through a 0·5-mm screen. Starch concentrations in diets and digesta were determined by a procedure based on dimethyl sulphoxide, α-amylase and amyloglucosidase, as described by Mahasukhonthachat et al. ( Reference Mahasukhonthachat, Sopade and Gidley 13 ). Nitrogen concentrations and AIA concentrations were determined as outlined by Siriwan et al. ( Reference Siriwan, Bryden and Mollah 14 ). Lipid concentration was determined by using the automated Soxhlet extraction as described by Luque de Castro & Priego-Capote( Reference Luque de Castro and Priego-Capote 15 ).
Calculations
AME, N retention and AMEn values were calculated using standard procedures and the following equations.
 $${\rm AME}_{{{\rm diet}}} ({\rm MJ\!/\!kg})\,{\equals} \,{{\left( {{\rm GE}\:/\!{\rm AIA}} \right)_{{{\rm diet}}} {\minus}({\rm GE\:/\!AIA})_{{{\rm excreta}}} } \over {\left( {{\rm GE\:/\!AIA}} \right)_{{{\rm diet}}} }}{\times}{\rm GE}_{{{\rm diet}}} ;$$
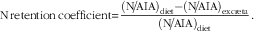 $${\rm N}\,{\rm retention}\,{\rm coefficient}{\equals}{{\left( {{\rm N\!/\!AIA}} \right)_{{{\rm diet}}} {\minus}{\rm }({\rm N}\!/\!{\rm AIA})_{{{\rm excreta}}} } \over {\left( {{\rm N}\!/\!{\rm AIA}} \right)_{{{\rm diet}}} }}{\rm .}$$
AMEn (MJ/kg) values were calculated by correcting to zero N retention, by using the factor of 36·54 MJ/kg N retained in the body( Reference Hill and Anderson 16 ). Apparent digestibility coefficients of starch, protein (N) and lipid were calculated by the following equation.
 $${\rm Digestibility}\,{\rm coefficient}\,{\equals}\,{\rm }{{\left( {{\rm Nutrient}\:/\!{\rm AIA}} \right)_{{{\rm diet}}} {\minus}{\rm }({\rm Nutrient}\:/\!{\rm AIA})_{{{\rm digesta}}} } \over {\left( {{\rm Nutrient}\:/\!{\rm AIA}} \right)_{{{\rm diet}}} }}{\rm .}$$
Metabolisable energy intakes (MJ/bird) of starch, protein and lipid were calculated by the following equation.
 $$\eqalignno{ & {\rm Metabolisable}\,{\rm energy}\,{\rm intake}\cr &\qquad {{\equals}}\, {\rm feed}\,{\rm intake{\times}}{\rm dietary}\,{\rm nutrient}\,{\rm concentration{\times}energy}\,{\rm units}{\rm .}$$
The energy units for starch, protein and lipid were considered to be 16·69, 15·51 and 34·31 MJ/kg, respectively( Reference Gous 12 ).
Statistical analysis
The experimental unit was cage means, and statistical analyses were conducted by using R version 3.1.3. Quadratic regressions were determined by general linear models, and when more than one were significant Akaike Information Criterion was used for model comparison and selection. In addition, the response surface plots were constructed so that the effects from changing factor levels on the examined responses can be visualised, and they were generated using generalised additive models with thin-plate regression splines as the smoothing function.
Results
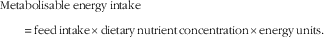
The mortality during the experimental period was 0·30 %, which was independent of dietary treatment (P>0·05) determined by multiple Student’s t test. The results of dietary treatments on growth performance from 10 to 23 d after hatching and nutrient utilisation from 20 to 21 d after hatching are shown in Table 3. The response surface illustrating the influence of energy derived from starch, protein and lipid on feed intake is shown in Fig. 2. Energy derived from lipid had a greater impact on feed intake than energy derived from starch and protein, as shown in Fig. 2, with the relevant contours almost parallel to the x-axis. Fig. 3 illustrates the influence of protein- and non-protein-derived energy intake on weight gain from 10 to 23 d after hatching. The contour plot shows that increasing the protein-derived energy intake increased weight gain in broiler chickens, whereas energy intake derived from starch and lipid had little impact on weight gain. The influence of energy intake derived from lipid v. starch on weight gain in broiler chickens is depicted in Fig. 4. This shows that energy derived from lipid is more important than energy derived from starch with respect to weight gain. There were no obvious patterns in contour plots for FCR when the relative importance of lipid v. protein and lipid v. starch energy intakes was compared (graphs are not shown). The influence of starch and protein energy intakes on FCR in broiler chickens is illustrated in Fig. 5. FCR may be reduced by either increasing protein energy intake or decreasing starch energy intake. As the slope of the contours in Fig. 5 was less than 1, the influence of starch energy intakes on FCR exceeded that of protein energy intakes.

Fig. 2 Influence of energy derived from starch, protein and lipid on feed intake in broiler chickens.
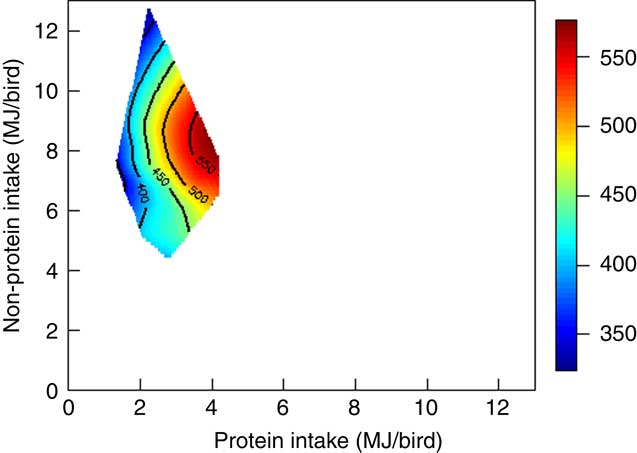
Fig. 3 Weight gain was mainly determined by protein energy intake in broiler chickens.
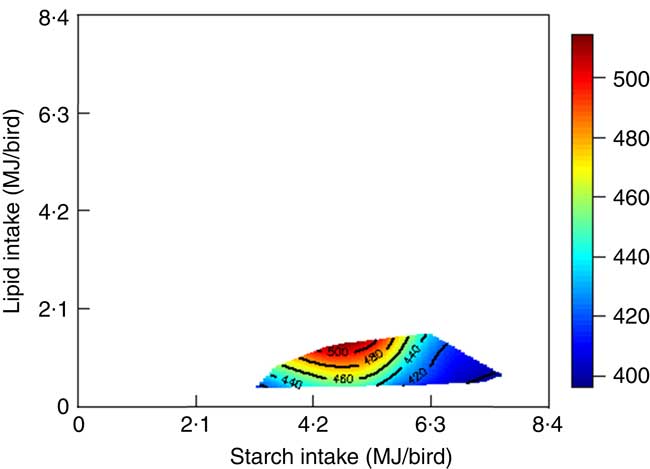
Fig. 4 Influence of energy derived from lipid and starch on weight gain in broiler chickens.
Fig. 5 The influence of starch and protein intake on feed conversion ratio in broiler chickens.
Table 3 The effects of dietary treatments on growth performance from 10 to 23 d after hatching and on nitrogen utilisation from 20 to 21 d after hatching
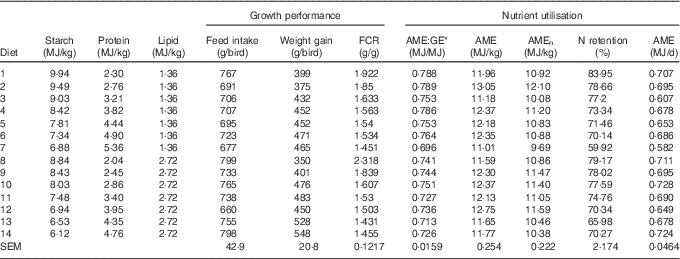
FCR, feed conversion ratio; AME, apparent metabolisable energy; GE, gross energy; AMEn, N-corrected AME.
* The ratio of apparent metabolic energy and gross energy.
The results of nutrient utilisation from 20 to 21 d after hatching are shown in Table 3. There was a quadratic relationship between ratio of dietary starch energy:protein energy and AME (R 2=0·33, P<0·01) in diets with adequate levels of lipid. The predicted maximum AME of 12·44 MJ/kg was realised when the ratio of starch and protein energy equalled 2·706 MJ/MJ (Fig. 6(a)). Similarly, there was a quadratic relationship between ratio of starch:protein energy and AMEn (R 2=0·46, P<0·01) in diets with adequate levels of lipid. The predicted maximum AMEn of 11·51 MJ/kg was realised when the ratio of starch:protein energy equalled 2·981 MJ/MJ (Fig. 6(b)). The effects of dietary treatments on apparent digestibility coefficients of starch, protein and lipid in the distal jejunum and distal ileum at 23 d after hatching are shown in Table 4. On average, apparent starch digestibility coefficients were 0·891 and 0·991 in the distal jejunum and distal ileum, respectively. The average protein (N) digestibilities in the distal jejunum and distal ileum were 0·779 and 0·858, respectively, whereas the average lipid digestibilities were 0·774 and 0·905 in the distal jejunum and distal ileum, respectively.
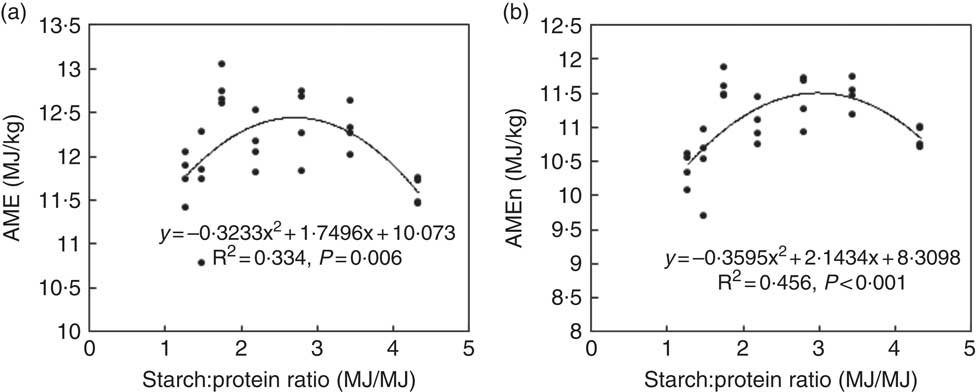
Fig. 6 Influence of dietary starch and protein ratios on energy utilisation in diets with adequate lipid concentration. AME, apparent metabolisable energy; AMEn, nitrogen-corrected AME.
Table 4 Effects of dietary treatments on apparent digestibility coefficients of starch, protein and lipid in the distal jejunum and distal ileum at 23 d after hatching
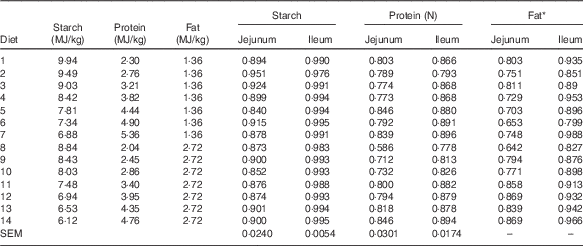
* Because of insufficient sample quantity, digesta samples from the same dietary treatment were pooled to determine lipid content.
Discussion
Overall growth performance
The average weight gain, feed intake and FCR throughout the 10 to 23-d post-hatch period were 699, 416 g/bird and 1·733 g/g, respectively, in the present study, which falls well short of the 2014 Ross 308 performance objectives. This is attributed to reduced voluntary feed intakes because of the fine, powdery mash diets offered to broiler chickens in the present study, which made prehension difficult in comparison with standard, steam-pelleted diets. Given the physical nature of the atypical diets used in the present study, it was simply not feasible to offer them as intact pellets. Selle et al. ( Reference Selle, Liu and Cai 17 ) reported that broilers offered steam-pelleted diets enjoyed advantages of 13·0 % in feed intake (2412 v. 2135 g/bird, P<0·05), 19·9 % in weight gain (1448 v. 1208, P<0·05) and 5·8 % in FCR (1·667 v. 1·770 g/g, P<0·05) in comparison with birds offered corresponding unprocessed, mash diets. It is most likely that the fine mash diets compromised growth performance but the relative differences in performance in relation to dietary treatments remain relevant to an appreciation of the mechanisms, whereby macronutrients influence feed intake, weight gain and FCR.
Rules of compromise
In nutritional geometry, an animal’s response to non-complementary, nutritionally imbalanced feedstuffs has been defined as the rules of compromise( Reference Simpson and Raubenheimer 18 ). As a general description of this concept, dietary treatments with different balances of nutrients need to be offered to animals, so that the intake points jointly form an intake array, the shape of which provides a comprehensive illustration of the rule of compromise( Reference Simpson and Raubenheimer 18 ). In the present study, diets with different starch:protein ratios were used to investigate the rule of compromise as it applies to broiler chickens offered diets with unbalanced levels of starch (312–503 g/kg) and protein (159–376 g/kg). The intake array is shown in Fig. 7, where the intake target was deduced from Ross 308 nutrient specifications. Only the average values of treatments with similar starch:protein ratios were plotted in Fig. 7. The shape of the intake array is close to a straight line with a slope approaching 1 (y=−1·08x+9·2452). This is known as the ‘equal distance rule’( Reference Simpson and Raubenheimer 18 ), which means the animal consumes feed to the point on its respective nutritional rails where the shortage of starch exactly equals the surplus of consumed protein. This is different from the ‘closest distance’ rule of compromise( Reference Simpson and Raubenheimer 18 ), where an animal eats an amount that minimises the ‘as-the-crow-flies’ distance between the actual intake and target intake( Reference Simpson and Raubenheimer 19 ).
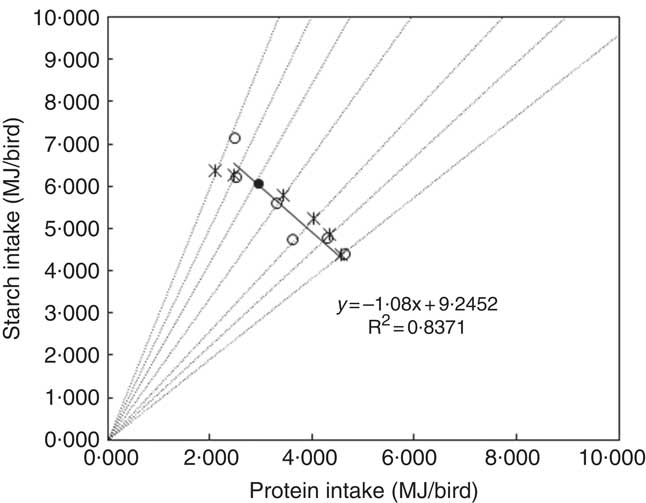
Fig. 7 Intake arrays from diets with low and adequate lipid concentrations (●, estimated intake target; ○, average starch and protein intake in diets on each nutritional rail; *, intakes for closest distance optimisation; ---, nutritional rails; —, linear regression between starch and protein intake).
Protein (nitrogen) utilisation
As shown in Fig. 3, contours tended to lie in parallel with the y-axis, which suggests that increasing protein energy intake enhanced weight gain of broiler chickens, whereas, non-protein energy had a lesser impact on weight gain. Moreover, this improvement in weight gain was not caused by increased feed intakes by Pearson’s correlation (P=0·459) but as a result of enhanced nutrient utilisation. In practice, poultry diets are increasingly formulated on the basis of digestible amino acids; nevertheless, a diet for broiler chickens from 10 to 23 d after hatching is likely to contain about 215 g/kg crude protein. If dietary protein concentrations in the present study are considered in isolation, there are highly significant quadratic relationships between dietary protein for both weight gain (r 0·800; P<0·005) and FCR (r 0·935; P<0·001). The relevant quadratic equations predict that optimal weight gain (461 g/bird) and FCR (1·377 g/g) would correspond to protein concentrations of 276 and 287 g/kg, respectively, which are clearly well in excess of standard practice. The observed improvement in weight gain and FCR may be due to high protein intake in diets containing high protein concentration (Fig. 3). In addition, the ‘protein mix’ used in the present study had a protein content in the order of 882 g/kg, of which approximately 78 % was derived from casein, 12 % from synthetic amino acids and 10 % from soya protein isolate. Thus, the inference is that amino acids stemming from this protein source can generate growth performance in birds at ostensibly excessive levels that is possibly not the case with more conventional protein sources – for example, soyabean meal. This may be related to protein digestion rate and the more rapid digestion of protein and absorption of amino acids from the ‘protein mix’, which may, in turn, enhance the digestive dynamics of protein and starch in tandem.
The digestible amino acid profiles that are usually formulated on a least-cost basis essentially reflect the amino acid composition of muscle( Reference Wu 20 ), but perhaps the ‘functionality’ of amino acids is being partially overlooked. Several amino acids including arginine, aspartic acid, glutamic acid, glutamine, glycine, leucine and proline are involved in cell signalling, immune and oxidative responses, neurotransmission, modulation of gene expression, enhancement of small intestinal and skeletal muscle protein deposition, reduction in body lipid or serve as important energy substrates for gut function( Reference Wu 21 – Reference Wu, Wu and Dai 23 ). Such considerations, which are the ‘extra’ provisions of certain functional amino acids and alleviating amino acid deficiency with increased dietary protein, may explain the performance responses observed to ostensibly excessive dietary protein levels. Moreover, the dietary protein was a mix of casein, isolated soya protein and synthetic amino acids, which could be described as ‘rapidly digestible’ protein. Feed-conversion efficiency and nutrient utilisation may be improved by rapidly digestible protein( Reference Liu and Selle 24 ), and this was reflected in the elevated N retentions observed in the present study as the average N retention was 73·63 %, which ranged from 59·92 to 83·95 %. In typical broiler diets, N retentions of 61·97, 60·99 and 60·46 % have been reported in maize-, sorghum- and wheat-based diets, respectively( Reference Liu, Cadogan and Péron 25 ), which are substantially lower than the average N retention of 73·63 % recorded in the present study. Cant et al. ( Reference Cant, McBride and Croom 26 ) indicated that the gastrointestinal tract consumes at least 20 % of incoming dietary energy in digesting and absorbing nutrients, and much of this energy is derived from catabolism of amino acids rather than glucose in the gut mucosa( Reference Watford, Lund and Krebs 27 ).
Liu & Selle( Reference Liu and Selle 24 ) discussed the importance of rates and sites or the kinetics of nutrient digestion in comparison with the extents of nutrient digestion or static digestibility coefficients. These researchers concluded that the digestive dynamics of protein were more important than that of starch with respect to feed-conversion efficiency. Amino acids absorbed from the small intestine are used as an energy source and for protein synthesis, including regeneration of the gut lining and endogenous enzymes( Reference Fuller and Reeds 28 ). In contrast, the amount of glucose utilised by the small intestine is a relatively low proportion of intake, and glucose is absorbed more completely and rapidly from the intestinal lumen( Reference Reeds, Burrin and Stoll 29 ). Therefore, the apparent digestion of protein is usually slower and incomplete relative to starch, and the synchrony of glucose and amino acid availabilities at sites of protein synthesis is vitally important for the efficiency of protein utilisation( Reference Liu and Selle 24 ). Fleming et al. ( Reference Fleming, Zambell and Fitch 30 ) suggested that starch/glucose and glutamic acid/glutamine are approximately equally important energy substrates for small intestinal mucosal cells in rats and, importantly, net ATP production from glucose was greater than glutamine by a 2-fold factor. Therefore, rapidly digestible protein may be better utilised because glucose is still available as an energy substrate for gut mucosal cells in the anterior small intestine. Thus, it follows that the rapidly digestible protein mix contributed to the well above-standard N retention values observed in the present study.
It is straightforward that N retention increased with starch:protein ratios in broiler diets (Fig. 8). Consistently, Swennen et al. ( Reference Swennen, Janssens and Decuypere 31 ) reported that the efficiency of protein retention was significantly better in broilers offered low-protein diets. In addition, Liu et al. ( Reference Liu, Raubenheimer and Selle 32 ) found that N retention reduced with increased protein:energy ratios in the diet. The challenge is to determine the optimal dietary protein or amino acid concentrations for minimal N excretion and maximal weight gain and feed-conversion efficiency. Furthermore, dietary amino acid requirements and their profiles plus differences in the digestive dynamics of protein-bound v. synthetic amino acids need to be considered for optimising protein utilisation in broiler chickens. It is beyond this study’s scope to discuss the influence of individual amino acids on growth performance and nutrient utilisation, because diets were formulated to similar ideal protein ratios in the present study. Thus, total dietary protein concentration was discussed herein, and the influence of balance and inclusions of essential and non-essential amino acids on growth performance and nutrient utilisation certainly requires further investigation.
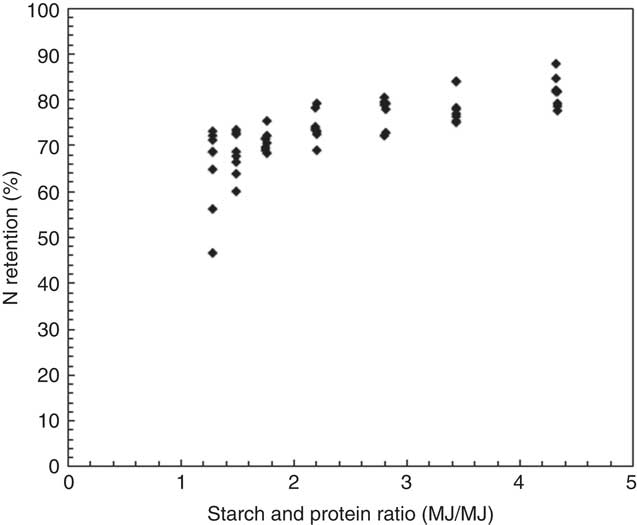
Fig. 8 Influence of dietary starch and protein ratios on nitrogen retention in all treatment.
Protein and metabolisable energy
The concept of protein:energy ratios in diets as they relate to protein accretion in animals was introduced decades ago( Reference Black and Griffiths 33 , Reference Campbell and Taverner 34 ), and it is straightforward in that both digestion of protein and starch and absorption of amino acids and glucose are required for muscle protein deposition( Reference Liu and Selle 24 ). In the present study, energy derived from both protein and non-protein sources was evaluated in an iso-energetic dietary context. Protein energy was more important as increasing protein energy increased weight gain in broiler chickens, which could be due to an alleviation in amino acid deficiency as dietary protein increased. This is also in agreement with Malheiros et al. ( Reference Malheiros, Moraes and Collin 35 ) who compared growth performance of broiler chickens offered low-protein, low-lipid or low-carbohydrate diets and concluded that dietary protein concentrations had the most pronounced impact on growth performance. Emmans( Reference Emmans 36 ) suggested that birds eat to satisfy their requirement for the most limiting nutrient in the ration; thus, on the other hand, non-protein energy could be limiting in diets with deficient non-protein energy and high protein. This was evident in the study by Liu et al. ( Reference Liu, Raubenheimer and Selle 32 ) where weight gain and feed-conversion efficiency were improved by increasing dietary protein:AME ratios, but growth performance was compromised by the diet with the highest protein:AME ratio. In addition, Kyriazakis & Emmans( Reference Kyriazakis and Emmans 37 ) found that protein retention in pigs depended on the level of energy supply at high dietary protein concentrations. There were quadratic relationships between AME and AMEn with dietary starch:protein ratios (Fig. 6(b) and (d)) in the present study. For example, the predicted maximum AMEn of 11·51 MJ/kg corresponds to a starch:protein energy density ratio of 2·981 MJ/MJ. Therefore, although protein energy is more important than non-protein energy for optimal growth performance and nutrient utilisation, a balance between protein and energy supplies is required for efficient muscle protein deposition.
The impact of lipid on growth performance
Commercial poultry diets usually contain 20–50 g/kg lipid depending on feed ingredient prices for tallow, vegetable oil and feed grains, and the influence of lipid inclusion levels on performance and energy utilisation in broiler chickens has not been clearly defined. Ravindran et al. ( Reference Ravindran, Tancharoenrat and Zaefarian 38 ) summarised the diet-related factors influencing lipid utilisation and growth performance of broiler chickens as the degree of saturation of fatty acids, the inclusion of lipid, the positional distribution of fatty acids within the glyceride molecule, the feed grain on which the diet is based, dietary Ca levels and feed processing. Moreover, it was considered that lipids may delay gastric empting and reduce food ingestion( Reference Tougas, Eaker and Abell 39 ); however, in the present study, both inclusion levels of lipid were within the range used in practice. Further investigations over a wider range of dietary lipid inclusions are required to clarify the impact of lipid on broiler performance.
Conclusions
This study is one of the few to use the principles of nutritional geometry to investigate interactions between macronutrients in relation to growth performance and nutrient utilisation in broiler chickens. The relative importance of protein, lipid and starch on growth performance was compared in iso-energetic diets. Lipid had a greater impact on feed intake than starch and protein. Starch and protein had similar impacts on feed intake because the equal distance rule was observed, which means birds consumed to the point on their respective nutritional rails where the shortage of starch exactly equalled the surplus of protein consumed. Energy derived from protein is more important than non-protein energy in terms of weight gain, and a balance between protein and energy supplies is required for efficient muscle protein deposition. For optimal protein utilisation or N retention in broiler chickens, future research needs to consider the digestion rate of different protein sources and the balance between conventionally defined ‘essential’ and ‘non-essential’ amino acids. The present study had substandard feed intake because purified diets were offered to broiler chickens in the mashed form. Future studies are required to confirm the findings from this preliminary assessment with regard to pelleted diets containing common feed ingredients.
Acknowledgements
The authors thank Greg Hargreave and Peter Chrystal from Baiada Poultry for their contributions for orientating this project from an industry perspective.
The present study was funded by the Celestino Baiada Research Fellowship in Poultry Science, a generous donation to The University of Sydney by Baiada Poultry Pty Limited, Sydney, Australia.
The authors’ contributions are as follows: S. Y. L. contributed to the study design, data collection and analyses and manuscript writing; P. H. S., D. R., D. J. C., S. J. S. and A. J. C. contributed to the experimental design and manuscript writing. All the authors read and approved the final version of the manuscript.
The authors have no conflicts of interest to declare.


