


The prevalence of type 2 diabetes (T2D) has increased rapidly in both developed and developing countries over the last few decades. The number of T2D incidences has globally reached 425 million (8·8 % of adults) with an additional 352 million at risk of developing T2D(1). Typically, the morbidity of T2D in China sharply increased from 2·5 % in 1994(Reference Pan, Yang and Li2) to 10·9 % in 2013(Reference Wang, Gao and Zhang3), which imposes a substantial disease toll and economic burden to patients and healthcare systems.
Epidemiological evidence has consistently demonstrated that diet is a key modifiable risk factor for T2D prevention(Reference Ley, Hamdy and Mohan4). Although prevailing dietary guidelines advocate substituting SFA with unsaturated fatty acids, including MUFA and PUFA, the recommendation is mainly based on the cardiovascular benefit and less is known about the effects of dietary unsaturated fatty acids, especially MUFA, on T2D prevention. Multiple studies showed that the Mediterranean diet improved glycaemic control, insulin sensitivity and lipid profiles probably due to the intakes of MUFA and PUFA(Reference Pablo, Antonio and Javier5). Meta-analyses of randomised controlled trials demonstrated that high-MUFA diets were effective in reducing glycated Hb (HbA1c) among individuals with glucose metabolism disorders(Reference Schwingshackl, Strasser and Hoffmann6) and improving metabolic risk factors including fasting plasma glucose among T2D patients(Reference Qian, Korat and Malik7). However, little evidence supported the beneficial effect of MUFA on glucose metabolism among healthy individuals(Reference Vessby, Uusitupa and Hermansen8,Reference Pérez-Jiménez, López-Miranda and Pinillos9) .
The associations of MUFA consumption with the risk of T2D development remain limited and controversial. Recently, the Tehran Lipid and Glucose Study found the intake of total MUFA was inversely associated with T2D incidence(Reference Mirmiran, Esfandyari and Moghadam10), whereas most of the previous cohort studies in European/American countries reported non-significant associations(Reference Guasch-Ferré, Becerra-Tomás and Ruiz-Canela11–Reference van Dam, Willett and Rimm16). A positive relationship between MUFA intake and T2D risk was even observed in the Australian Longitudinal Study on Women’s Health(Reference Alhazmi, Stojanovski and McEvoy17). These inconsistent findings might be ascribed to the MUFA from different food sources that have divergent health benefits. Dietary MUFA from plant-based foods, such as non-hydrogenated vegetable oils and nuts, may be protective against T2D(Reference Meyer, Kushi and Jacobs14). For example, olive oil consumption was overall associated with a lower risk of T2D(Reference Schwingshackl, Lampousi and Portillo18). In contrast, consumption of MUFA from animal sources such as meat and dairy products was accompanied by high consumption of SFA, which could confound the relationship between total MUFA consumption and risk of T2D(Reference Risérus, Willett and Hu19). Therefore, separating MUFA from plant and animal sources is needed to elucidate the role of MUFA in T2D development. China has one-fourth of the world’s diabetes patients, which will reach 120 million in 2045(1). However, the association of MUFA intake with T2D incidence has not been reported in the Chinese population. Therefore, we aimed to separate MUFA from animal and plant sources and prospectively assessed their long-term associations with T2D risk in the China Health and Nutrition Survey (CHNS) consisting of a nationwide oriental population.
Materials and methods
Study population
The CHNS is an ongoing, large-scale, longitudinal and household-based cohort initiated in 1989 to assess the relationships between the transformation of society and the economy and the resulting health and nutritional status of the Chinese population(Reference Popkin, Du and Zhai20). The survey has been successfully conducted in nine rounds (1989, 1991, 1993, 1997, 2000, 2004, 2006, 2009 and 2011), which was approved by the institutional review committees of the University of North Carolina at Chapel Hill and the National Institute of Nutrition and Food Safety at Chinese Center for Disease Control and Prevention. Since no information on T2D diagnosis was collected before 1997, data from six rounds thereafter were utilised for present analysis. A total of 26 889 participants were eligible between the 1997 and 2011 surveys. We excluded the participants aged <20 years at entry (n 6856) and those without complete dietary data (n 4549). After further excluding those with implausible energy intake (<3350 or >17 570 kJ/d for men and <2510 or >14 640 kJ/d for women, n 78), prevalent T2D cases (n 252), myocardial infarction or stroke (n 132) at baseline, a total of 15 022 participants (7035 men and 7987 women) were enrolled in the final analyses of the present study (online Supplementary Fig. S1).
Dietary assessment and covariates
Dietary intakes for individual participants were assessed using the daily interview to collect the information on at-home food consumption over three consecutive days and asking the participants to report all foods consumed away from home on a 24-h recall basis over the same periods. Household data on food consumption were also obtained using a weighing inventory during the same three consecutive days. Detailed procedures of dietary data collection have been described elsewhere(Reference Popkin, Lu and Zhai21,Reference Tee22) . Dietary intakes of nutrients were calculated using corresponding versions of Chinese Food Composition Table(23–25) for each round to track changes of nutrient composition in foods over a long-term period. Three-day average intakes of dietary protein, carbohydrate and fats including MUFA, PUFA and SFA in each round were calculated, and then cumulative averages of the intakes in all available rounds from entry to the diagnosis of T2D or the end of follow-up were further calculated to represent long-term diet and minimise within-person variation. For example, if a person entered the CHNS in 1997 and was diagnosed with diabetes in 2005, then the cumulative average of MUFA intake is the sum of MUFA intakes in 1997, 2000 and 2004 divided by three. We also separated MUFA into plant-derived MUFA (P-MUFA) and animal-derived MUFA (A-MUFA) according to different food sources. P-MUFA were from plant-based foods, such as vegetable oils, rice, bread, vegetables, fruits, legumes and nuts. A-MUFA were MUFA from animal foods, including animal fats for cooking, red meat, eggs, poultry, fish and dairy products. For a few mixed-food items, ingredients were identified according to the recipes for home-prepared items or product labels for manufactured foods. We also separated MUFA into fried MUFA and non-fried MUFA according to the cooking method used for MUFA-containing foods. Fried MUFA were derived from stir-fried, griddled and deep-fried foods, while non-fried MUFA were derived from boiled, steamed, raw and other non-fried foods. Intakes of oleic acid (OA) and palmitoleic acid (PA), two main subtypes of MUFA, were also calculated. In a validation study, the total energy intake calculated by the dietary assessment method in the CHNS was correlated with the total energy expenditure measured by the doubly labelled water method (r 0·56, P < 0·01 for men; r 0·60, P < 0·01 for women)(Reference Yao, McCrory and Ma26). Data on other demographic and lifestyle factors were also collected, including age, weight and height, education level, marital status, income, smoking, alcohol drinking, physical activity, history of hypertension, geographical location (south or north) and site (urban or rural)(Reference Popkin, Du and Zhai20).
Ascertainment of diabetes
Diabetes status was identified by the questionnaire inquiring whether the person had physician-diagnosed T2D. Detailed information on the diagnosis date and diabetes treatment, including the special diet, weight control, oral medication, insulin and Chinese traditional medicine, was collected to reconfirm the self-reported cases in each round interview. In the 2009 survey, overnight fasting blood samples of participants were collected, while plasma glucose and HbA1c levels were analysed with strict quality control. The participants with a fasting plasma glucose ≥7·0 mmol/l or HbA1c ≥ 6·5 % were then defined as diabetes in addition to self-reported diabetes based on the questionnaire. Among 15 022 individuals in the present analysis, 7708 (51·3 %) had available plasma glucose data collected in the 2009 round. A cross-sectional analysis of 10 215 participants in the 2009 survey was conducted to evaluate the specificity of self-reported diabetes. Of 9964 participants self-reporting no diabetes, 753 participants (7·6 %) were diagnosed with diabetes according to the levels of fasting plasma glucose and HbA1c. Thus, 92·4 % of participants who did not report diagnosed diabetes were below the blood glucose threshold for diabetes, indicating a low rate of undiagnosed diabetes in this population.
Statistical analysis
The intakes of protein, carbohydrate and fat were expressed as the percentages of total energy using the nutrient density method and divided into quartiles with the first quartile as the reference for analyses. Person-years of the follow-up were calculated from the round at entry to the year when participants were diagnosed with T2D, year of death or the year 2011, whichever came first. A median of 14 years of follow-up (mean 11·2 (sd 4·2) years; range 1–14 years) was documented for this study population. Hazard ratios (HR) and 95 % CI for T2D were estimated using Cox proportional hazards regression models with follow-up duration (years) as the timescale. The end point of T2D diagnosis was coded as 1, and censoring at death or not having diabetes during the follow-up was coded as 0. The multivariate model was adjusted for established and potential risk factors for T2D, including age, sex, BMI, education, marital status, income, physical activity, smoking, alcohol drinking status, history of hypertension, north–south position (north or south), site (urban or rural), intake of total energy, percentage of energy from dietary protein, SFA and PUFA. The comparison macronutrient for MUFA was total carbohydrates in this model because the increase in dietary fat consumption was often simultaneously accompanied by the reduction in carbohydrate consumption in practice. We created indicator variables for missing data in each covariate, if necessary. Standard errors and variance of the estimates were also adjusted by clustering at the community level to control for design effects. Tests for trend were computed using the median values of each category of MUFA as continuous variables in the regression models.
We also assessed the change of T2D risk for isoenergetically replacing SFA with MUFA by establishing the substitution models that included total energy, protein, carbohydrate, MUFA and PUFA. In an isoenergetic setting, total energy intake and all other macronutrient intakes are held constant, such that the reduction of one macronutrient as a percentage of total energy intake will be compensated by the same percentage of increment of energy from another macronutrient(Reference Kulldorff, Sinha and Chow27). When leaving SFA out of the isoenergetic model, the regression coefficients for MUFA bear the interpretation as the theoretical effect of substituting MUFA for the same amount of energy from SFA while holding the other nutrient intakes constant. Data on MUFA intake were continuous in this substitution model to estimate effects of SFA replacement by a fixed percentage of energy (5 %). Given the fact that A-MUFA and SFA derived from common food sources, the changes in risk of T2D by substituting P-MUFA for the sum of A-MUFA and SFA were also estimated.
Sensitivity analyses were also conducted to verify the robustness of our findings. We excluded persons who developed incident T2D during the initial 3 years of follow-up, further adjusted for fruit and vegetable consumption or dietary cholesterol intake to observe whether the results materially changed. Additionally, an alternative healthy eating index (2010)(Reference Wang, Adair and Cai28) was further adjusted to see whether the results were explained by the overall dietary pattern. We also restricted our analysis to participants with both blood glucose data and self-reported information on T2D (n 7708) to eliminate the possibility of underestimation of the cases caused by self-reported T2D alone. Subgroup analyses were also conducted according to important potential effect modifiers and stratified by age, sex, BMI, smoking status, alcohol consumption, physical activity, north–south position, site and individual income. P values for interactions were tested by likelihood-ratio test.
Statistical analyses were performed using the SAS statistical package (version 9.4; SAS Institute). Statistical tests were two-sided, and significance was defined as P < 0·05.
Results
Characteristics of the population from the China Health and Nutrition Survey
The baseline characteristics of the participants by quartiles of total MUFA consumption are shown in Table 1. Participants with higher intakes of MUFA, P-MUFA and A-MUFA were on average older, more often urban residents and southerners, more educated, less physically active and tended to consume more SFA and vegetables but fewer carbohydrates. Moreover, individuals with higher P-MUFA consumption tended to be female, fatter, non-smokers and non-alcohol drinkers, and earned less money and consumed more PUFA but less protein. Participants with higher intake of A-MUFA were more likely to be male, wealthier, alcohol drinkers and consumed more protein and fruits.
Table 1. Baseline characteristics and dietary consumption of participants in the China Health and Nutrition Survey by quartiles (Q) of MUFA consumption (n 15 022)
(Percentages; mean values with their standard errors)
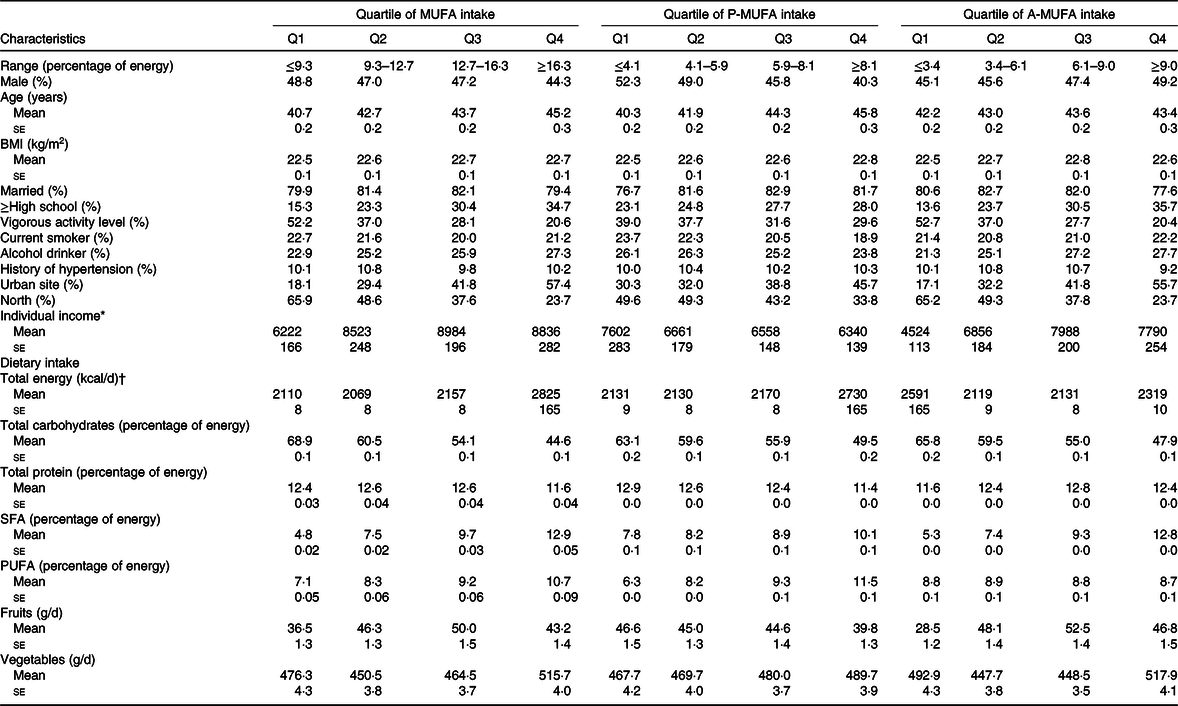
* Individual income was inflated to 2009.
† To convert kcal to kJ, multiply by 4·184.
Consumption of MUFA from animal and plant sources
In 1997–2011, the average intake of P-MUFA increased from 5·9 to 8·4 % of energy, while intake of A-MUFA ranged from 3·6 to 8·6 % (Fig. 1). Pork was the largest contributor of MUFA (21·6–38·9 % of total MUFA) from animal sources (online Supplementary Table S1), followed by lard, eggs, pork chops, pork side ribs and duck. P-MUFA were mainly consumed from vegetable oils, including peanut oil (4·3–17·8 % of total MUFA), rapeseed oil, soyabean oil, salad oil and tea-seed oil. Additionally, fried bread sticks and rice were also contributors to P-MUFA. For the individual MUFA, the food items contributing to OA were similar to those for total MUFA, while PA mainly came from pork, eggs, other animal products and soyabean oil.

Fig. 1. Trends in animal-derived MUFA (A-MUFA) and plant-derived MUFA (P-MUFA) intakes (% of energy) during a median of 14 years of follow-up. The numbers of enrolled participants were 12 844, 13 562, 11 779, 11 284, 11 600 and 14 996 in the 1997, 2000, 2004, 2006, 2009 and 2011 rounds in the China Health and Nutrition Survey, respectively.  , A-MUFA;
  , P-MUFA.
The intake of P-MUFA was weakly correlated with the intake of A-MUFA (r −0·05, P < 0·0001; online Supplementary Table S2). PUFA consumption was moderately correlated with P-MUFA consumption (r 0·51, P < 0·0001), whereas it was weakly correlated with A-MUFA consumption (r 0·05, P < 0·0001). The correlation coefficient was high between SFA and A-MUFA consumption (r 0·86, P < 0·0001) but was low between SFA and P-MUFA consumption (r 0·28, P < 0·0001).
Plant-derived MUFA, animal-derived MUFA and risk of type 2 diabetes
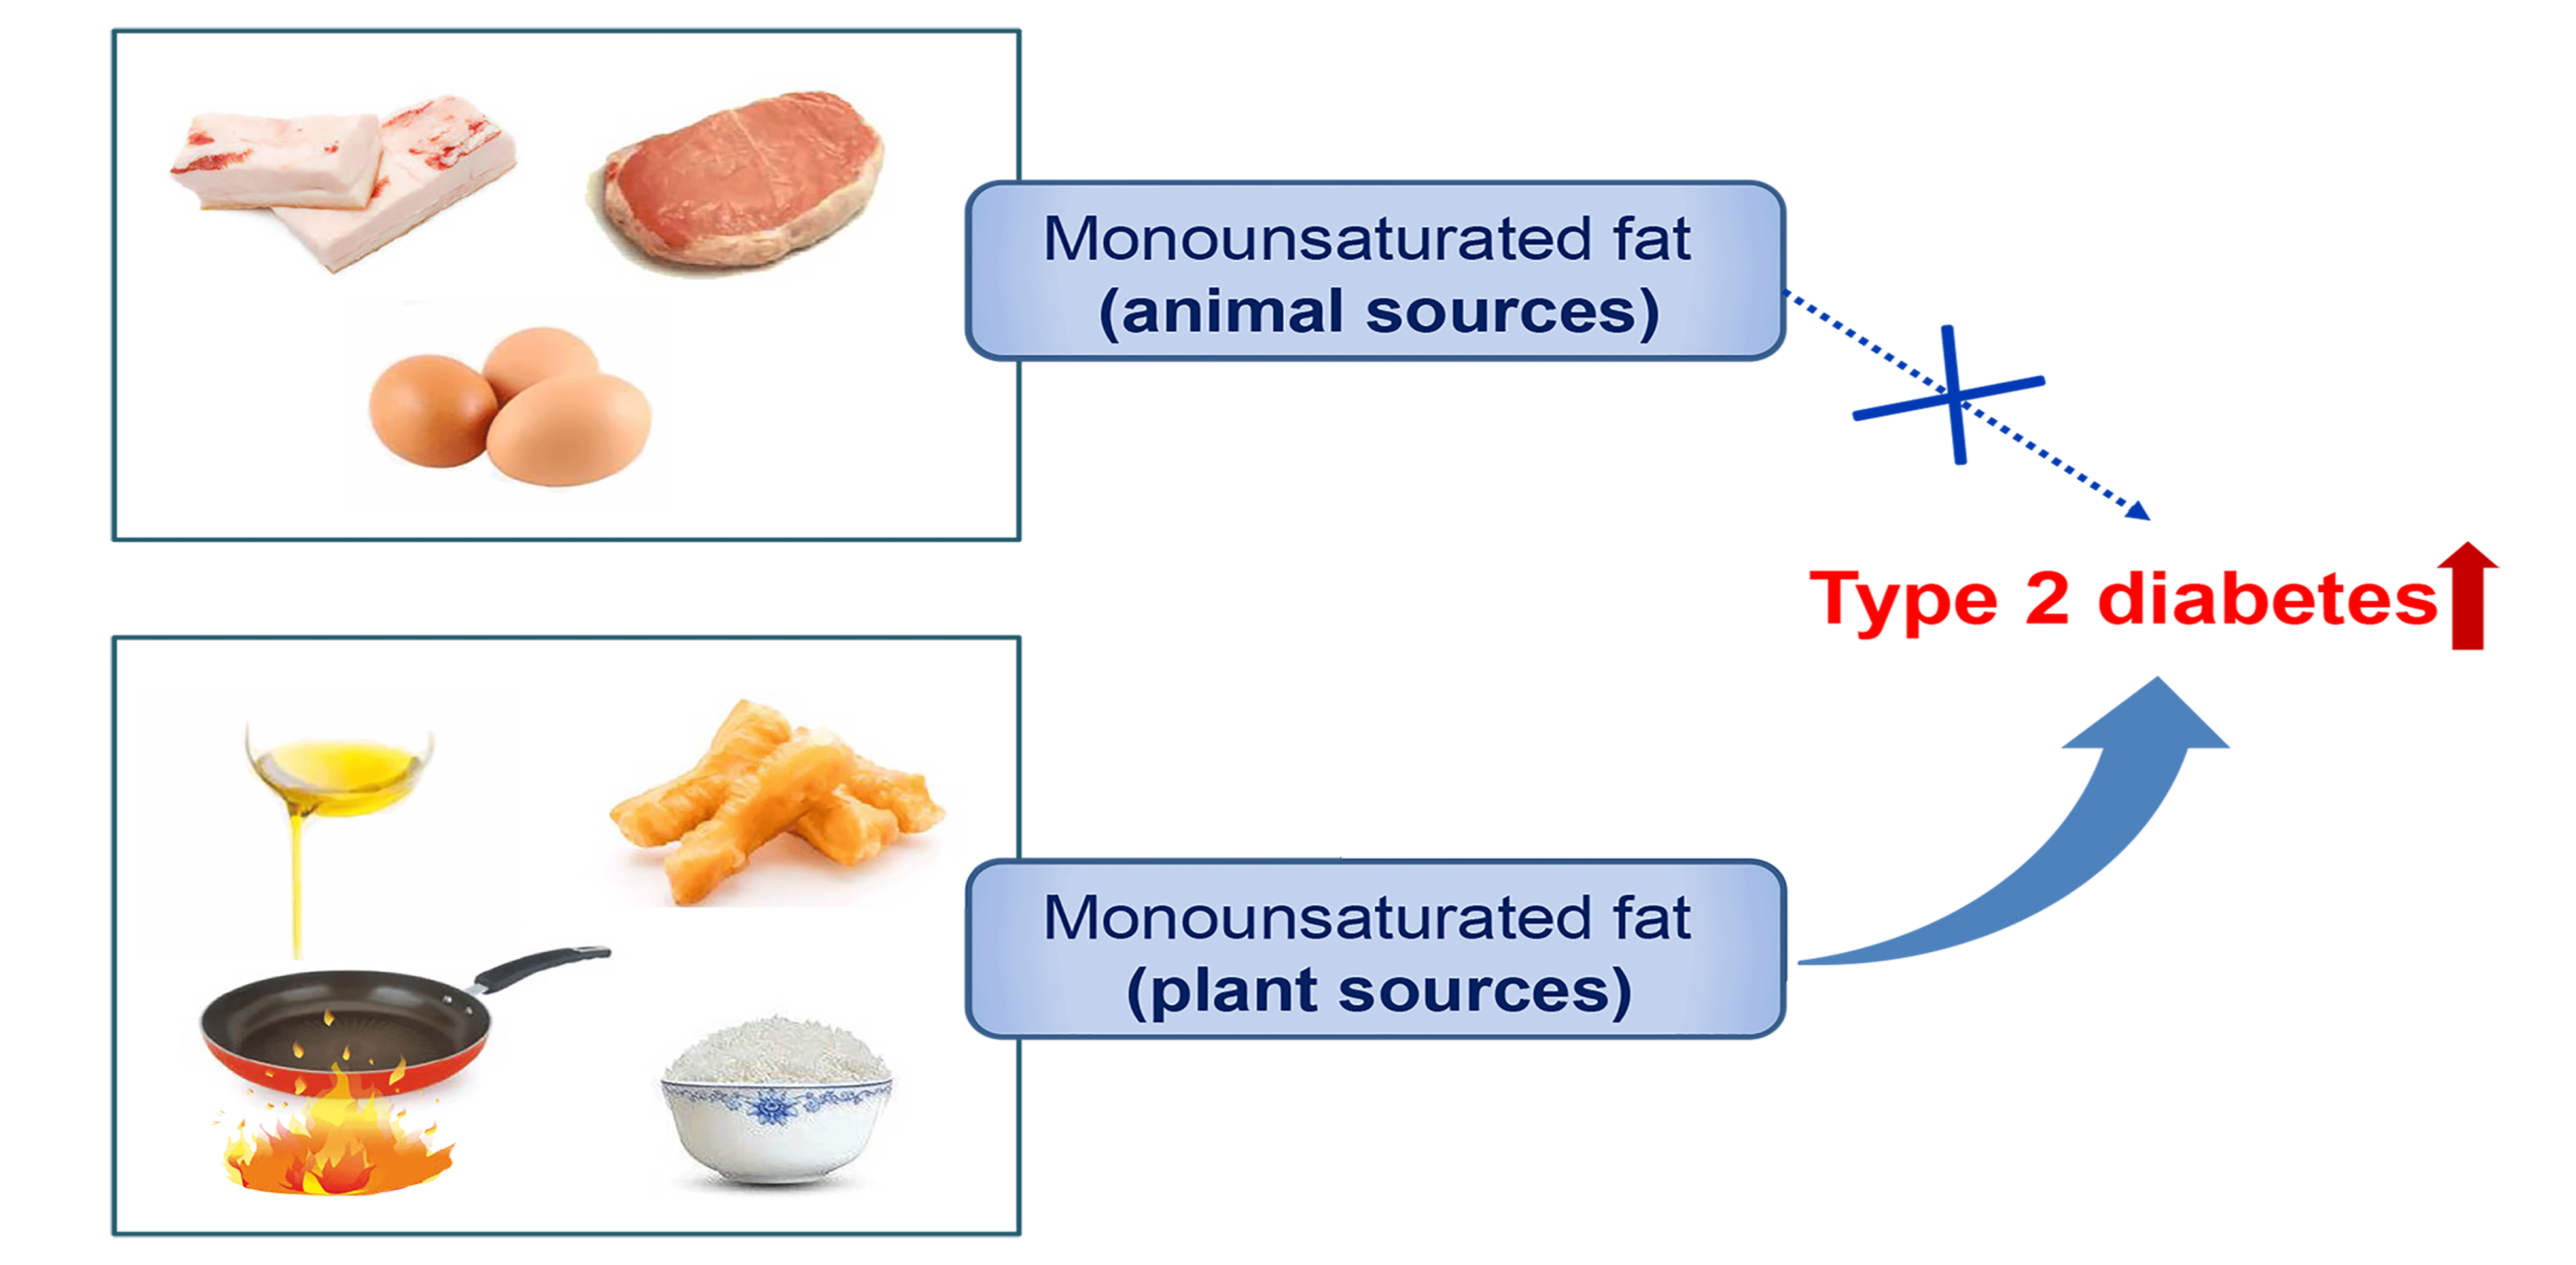
During a total of 167 698 person-years of follow-up, 1014 incident T2D cases were documented. Although the intake of total MUFA was not associated with T2D risk in the age- and sex-adjusted model, a positive association was observed after adjusting for other confounders in the multivariable-adjusted model (Table 2). Compared with the participants with the lowest quartile of MUFA intake, those in the highest quartile had an 81 % higher risk of T2D (HR 1·81; 95 % CI 1·28, 2·57; P trend = 0·0015). With regard to MUFA from different sources, P-MUFA intake was associated with a progressively higher T2D risk. The HR for the increasing quartiles were 1·22 (95 % CI 1·00, 1·50), 1·27 (95 % CI 1·02, 1·57) and 1·50 (95 % CI 1·18, 1·90) (P trend = 0·0013). However, A-MUFA did not show any association with T2D risk (P trend = 0·30).
Table 2. Associations between MUFA, plant-derived MUFA (P-MUFA) and animal-derived MUFA (A-MUFA) intakes and type 2 diabetes risk in the China Health and Nutrition Survey
(Numbers and percentages; hazard ratios (HR) and 95 % confidence intervals)
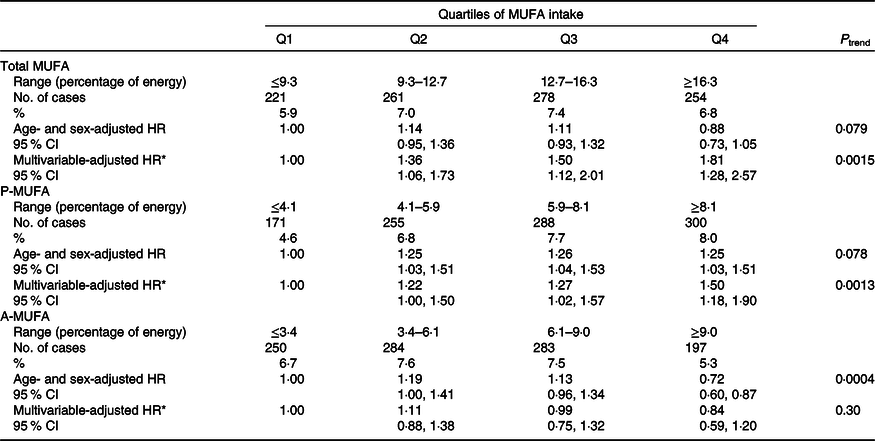
* Adjusted for age, sex, BMI (in kg/m2; <18·5, 18·5–23·9, 24–27·9 or ≥28), education (less than high school, high school, some college or at least college), marital status (never married, married or living as married, widowed/divorced/separated or unknown), income (quartile), north–south position (north or south), and site (urban or rural), physical activity (no regular activity, low to moderate activity or vigorous activity), smoking (never, former, current or unknown), alcohol drinking status (abstainer or drinker), history of hypertension (yes, no or unknown), intake of total energy, percentages of energy intake from protein, SFA, PUFA, and remaining MUFA where appropriate (P-MUFA and A-MUFA).
MUFA from fried and non-fried foods and risk of type 2 diabetes
Consumption of MUFA from fried foods was strongly associated with a higher T2D risk (P trend = 0·0001), which was driven by the positive association of fried P-MUFA with T2D risk (P trend = 0·0006) (Table 3). Multivariable HR comparing extreme quartiles of intake were 1·74 (95 % CI 1·31, 2·30) for fried MUFA and 1·60 (95 % CI 1·26, 2·02) for fried P-MUFA. Intakes of fried A-MUFA and non-fried MUFA, including non-fried P-MUFA and non-fried A-MUFA, were all not associated with the risk of T2D.
Table 3. Associations of MUFA from fried and non-fried foods with type 2 diabetes risk in the China Health and Nutrition Survey
(Numbers and percentages; hazard ratios (HR) and 95 % confidence intervals)
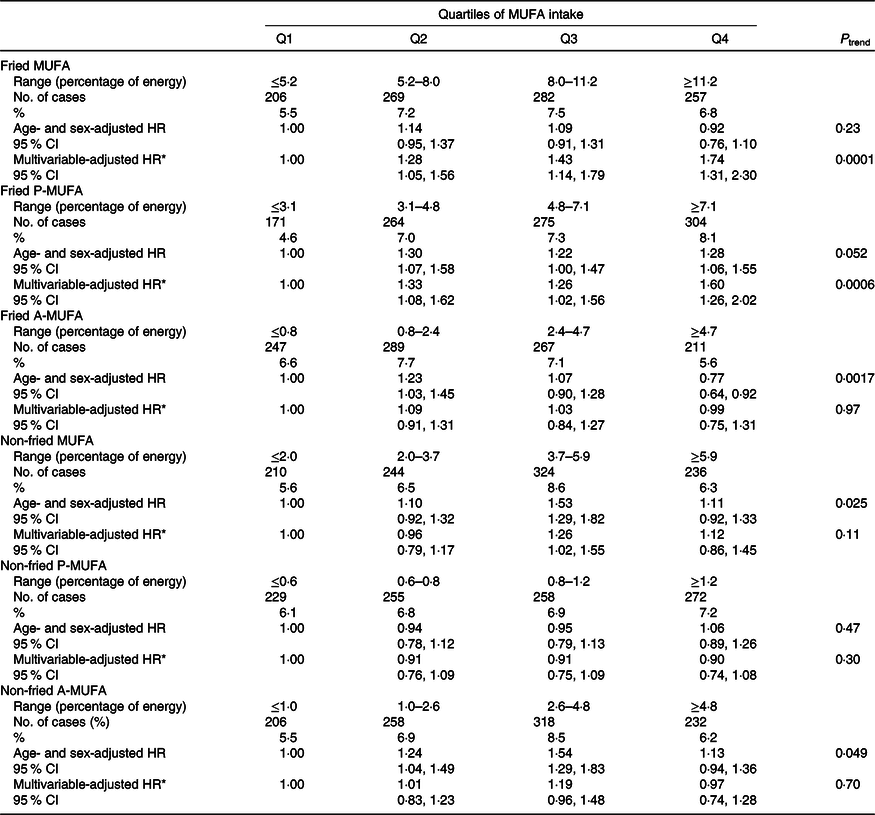
P-MUFA, plant-derived MUFA; A-MUFA, animal-derived MUFA.
* Adjusted for age, sex, BMI (in kg/m2; <18·5, 18·5–23·9, 24–27·9 or ≥28), education (less than high school, high school, some college or at least college), marital status (never married, married or living as married, widowed/divorced/separated or unknown), income (quartile), north–south position (north or south), and site (urban or rural), physical activity (no regular activity, low to moderate activity, or vigorous activity), smoking (never, former, current, or unknown), alcohol drinking status (abstainer or drinker), history of hypertension (yes, no, or unknown), intake of total energy, percentages of energy intake from protein, SFA, PUFA, and remaining MUFA where appropriate (fried MUFA, non-fried MUFA, fried P-MUFA, non-fried P-MUFA, fried A-MUFA and non-fried A-MUFA).
Oleic acid, palmitoleic acid and risk of type 2 diabetes
For individual MUFA, we observed a positive relationship between OA intake and T2D risk, whereas a negative association was detected between PA intake and T2D risk (P trend < 0·0001) (online Supplementary Table S3). Multivariable HR comparing extreme quartiles were 2·35 (95 % CI 1·59, 3·47) for OA intake (P trend < 0·0001) and 0·44 (95 % CI 0·32, 0·60) for PA intake (P trend < 0·0001). Furthermore, the intakes of plant-derived OA and plant-derived PA were both correlated with a higher risk of T2D. Animal-derived PA intake was related to a lower risk of T2D, whereas the association for animal-derived OA (A-OA) was not observed (P trend = 0·50).
Substitution for SFA
The results of substitution analyses show that the HR for isoenergetically replacing 5 % of energy from SFA with total MUFA was 1·06 (95 % CI 0·94, 1·20). Isoenergetically replacing 5 % of energy from SFA with P-MUFA or fried P-MUFA was associated with 16 and 24 % higher risk of T2D, respectively, whereas the same replacement with A-MUFA did not show significant changes in T2D risk. Finally, T2D risk was 26 % higher when isoenergetically substituting 5 % of energy from P-MUFA for the sum of SFA and A-MUFA. The same substitution using fried P-MUFA was related to a 33 % higher risk of T2D (online Supplementary Fig. S2).
Sensitivity analyses
In sensitivity analyses, the documented associations between MUFA consumption and T2D risk were not materially changed after further adjusting for the consumption of fruits and vegetables, dietary cholesterol or alternative healthy eating index and excluding the T2D cases within the first 3 years of follow-up (online Supplementary Tables S4–S7). Similar results were largely observed when we restricted the analysis to those with available data of blood glucose levels (online Supplementary Table S8).
Subgroup analyses
We detected a significant interaction between BMI and P-MUFA intake on the risk of T2D (P for interaction = 0·0011). The positive association of P-MUFA with T2D was restricted to normal-weight participants (P trend = 0·0002). The associations for A-MUFA intake with T2D risk were similar in all subgroups (online Supplementary Table S9).
Discussion
This prospective study is the first to assess the long-term associations of MUFA from different origins with the development of T2D. In this nationwide Chinese cohort, we found that intake of P-MUFA was positively associated with T2D risk, which was mainly driven by fried plant MUFA. The intake of MUFA from animal sources was not associated with T2D. T2D risk was higher when SFA or SFA combined with A-MUFA were isoenergetically replaced by fried P-MUFA.
Previous epidemiological data linking MUFA consumption to T2D development are conflicting. It has been speculated that the positive or null associations of total MUFA with T2D were attributed to the fact that MUFA and animal fat (SFA) were derived from shared food sources such as meat and dairy products in the Western diet and thus had a high correlation (online Supplementary Table S2). SFA and processed meat have been associated with higher T2D incidence in the Health Professionals Follow-up Study(Reference van Dam, Willett and Rimm16), while replacing SFA with MUFA was related to lower risk in the Nurses’ Health Study(Reference Salmerón, Hu and Manson15). On the contrary, the major plant sources of MUFA in Western countries, olive oil(Reference Schwingshackl, Lampousi and Portillo18,Reference Guasch-Ferré, Hruby and Salas-Salvadó29) and nuts(Reference Villegas, Gao and Yang30,Reference Jiang, Manson and Stampfer31) , have been correlated with a lower risk of T2D in multiple studies. Together, accumulating evidence indicates the importance of food sources of MUFA when evaluating the health benefit of MUFA.
Interventional studies supported the evidence of ameliorative effects of MUFA on glycaemic control and insulin resistance, wherein MUFA were from plant sources (e.g. olive oil, sunflower oil and rapeseed oil), compared with SFA or carbohydrates, and thus may not be confounded by animal fats(Reference Schwingshackl, Strasser and Hoffmann6–Reference Pérez-Jiménez, López-Miranda and Pinillos9). However, when MUFA were differentiated from plant and animal sources, here we found that P-MUFA were unexpectedly and strongly related to a higher risk of T2D. In addition, replacing SFA with P-MUFA showed a significantly higher risk of T2D. These findings could be due to distinctive food sources of P-MUFA and cooking methods in China.
In the CHNS, major sources of P-MUFA were peanut oil, rapeseed oil and soyabean oil but not olive oil or nuts. Although rapeseed oil could improve glycaemic control in a randomised controlled trial(Reference Jenkins, Kendall and Vuksan32) and peanut oil was able to enhance insulin secretion in diabetic mice(Reference Vassiliou, Gonzalez and Garcia33), soyabean oil treatment presented insulin resistance in Wistar rats(Reference Nunes, Peixoto and Louro34). Importantly, these types of vegetable oils are mainly used for cooking but not for salad dressing, with stir-frying and griddling applied as usual preparation methods in China. Frying of vegetable oils may produce harmful changes, including the increase in energy density, NEFA contents, the ratio of hypocholesterolaemic:hypercholesterolaemic fatty acids and the formation of trans-fatty acids, TAG polymers and dimers(Reference Narayanankutty, Manalil and Suseela35,Reference Sayon-Orea, Carlos and Martínez-Gonzalez36) . In addition, lipid peroxidation products from frying process could induce inflammation(Reference Miller and Shyy37), which plays a crucial role in the pathogenesis of diabetes(Reference Olefsky and Glass38). Fried food consumption was significantly associated with incident T2D(Reference Cahill, Pan and Chiuve39).
In the present study, 80 % of vegetable oils were used for frying, including deep-frying, stir-frying and griddling. Moreover, fried bread sticks, a Chinese traditional breakfast meal made from deep-frying of dough, is also a contributor to the intake of P-MUFA second to vegetable oils in the CHNS. Therefore, we further analysed the associations for P-MUFA from fried and non-fried foods and found a strong positive association between fried P-MUFA and T2D risk. Together, these results demonstrate that consumption of fried P-MUFA mainly from fried vegetable oils and fried bread sticks may elevate the risk of T2D in China.
Interestingly, we did not find significant associations of fried A-MUFA with T2D risk. MUFA from animal products may be more thermally stable due to the presence of a large amount of SFA that are relatively resistant to oxidation in animal foods, whereas MUFA from plant foods with a high degree of unsaturation are susceptible to oxidation or peroxidation when exposed to heat and O2(Reference Shahidi and Zhong40). Compared with other cooking oils, olive oil is more thermally stable and less prone to oxidation(Reference Cahill, Pan and Chiuve39,Reference Zotos, Kotaras and Mikras41) . The use of olive oil for frying was associated with a lower level of insulin resistance in a cross-sectional study(Reference Soriguer, Esteva and Rojo-Martinez42). However, olive oil consumption was rare in China during the present study period.
Few prospective studies have assessed the associations of individual MUFA like OA and PA with T2D risk. Dietary intake of OA, the primary MUFA from diet sources, showed neutral effects on T2D development in previous Western studies(Reference Ma, Wu and Wang13). Substituting OA for SFA exhibited beneficial effects on insulin sensitivity through exerting anti-inflammatory activity, inhibiting endoplasmic reticulum stress and improving β-cell survival and insulin signalling(Reference Palomer, Pizarro-Delgado and Barroso43). However, a gradient of T2D risk was apparent with an increasing intake of OA in our study. For the putative mechanism, treatment with a high level of OA was able to induce hyperinsulinaemia which may be a primary event in the pathogenesis underlying T2D in the previous in vitro study(Reference Zhang, Xiao and Niu44).
With regard to PA, the Cardiovascular Health Study reported no association of PA intake with T2D risk(Reference Ma, Wu and Wang13), while the positive association for PA was attenuated to a null relationship when BMI and waist:hip ratio were further adjusted in an Australian study(Reference Hodge, English and O’Dea45). However, we found a strong inverse relationship between PA intake and T2D risk. In line with our findings, plasma phospholipid trans-palmitoleate, a distinctive biomarker of exogenous PA, was independently related to lower insulin resistance and incident diabetes in US adults(Reference Mozaffarian, Cao and King46). Besides, PA could improve skeletal muscle insulin response, pancreatic β-cell survival, insulin secretion and adipocyte metabolism(Reference Everson Araujo and Alex47)in vitro and ameliorate hyperglycaemia and insulin sensitivity in vivo (Reference Yang, Miyahara and Hatanaka48).
When further separating OA and PA from plant and animal sources, the consistent findings for plant-derived OA, plant-derived PA and P-MUFA demonstrated that MUFA from plant-based foods were responsible for their promotion effects on T2D development. Moreover, the strong negative association with incident T2D for total PA was driven by animal-derived PA. Since the trace amount of PA was found in animal foods, residual confounding by other constituents could be possible and further corroboration of our results in larger studies is needed.
The strengths of our study included the nationally representative sample of the Chinese population, long follow-up duration and the cumulative average measurement of repeated MUFA intakes to reflect long-term diet. Since T2D cases might appear at baseline, we excluded incident T2D cases occurred during the initial 3 years of follow-up to further control for reverse causation and found the results unchanged. The present study also has some limitations. First, T2D incidence may be underestimated for those (49·0 % of all participants) with information only from questionnaire. In particular, participants with higher MUFA intake had higher socio-economic status and probably got better access to health care and thus might have fewer undiagnosed cases of diabetes. Nonetheless, when we restricted to those with available data of both plasma glucose and questionnaire information (n 7708), the positive associations of MUFA from plant sources with T2D incidence remained significant. Second, we could not adjust for trans-fatty acid intake due to lack of data. Nevertheless, the overall trans-fatty acid consumption in China was very low and might not appreciably change the documented findings(Reference Yu, Sun and Ye49). Third, although MUFA consumption was estimated using the combination of three consecutive 24-h recalls and a weighing technique, measurement error was still inevitable which might have attenuated the observed associations due to the prospective design. Moreover, the distinctive Chinese dietary pattern and cooking methods might limit the generalisability of currently established findings to other populations. Finally, reverse causation could not be ruled out because the observational nature and unmeasured and residual confounding, such as family history of diabetes, adipose tissue mass and distribution, glycaemic index and glycaemic load, were still possible even after full adjustment.
In conclusion, the intakes of MUFA from animal and plant origins were divergently associated with T2D risk. Replacing SFA with fried P-MUFA but not A-MUFA was associated with a higher risk of T2D. Our findings suggested a potential detrimental effect of MUFA from fried plant sources, such as fried vegetable oils and fried bread sticks, on the prevalence of T2D among the Chinese population.
Acknowledgements
We thank the National Institute for Nutrition and Health, China Center for Disease Control and Prevention.
This work was supported by the National Natural Science Foundation of China (grant number 81773419), Chinese Institute of Nutrition DSM Research Fund (grant number CNS-DSM-2017-035) and China National Program for Support of Top-Notch Young Professionals. This research uses data from the CHNS. We are grateful to research grant funding from the National Institute for Health, the Eunice Kennedy Shriver National Institute of Child Health and Human Development (R01 HD30880; P2C HD050924), the National Institute of Diabetes and Digestive and Kidney Diseases (R01 DK104371), the National Institute for Health Fogarty D43 TW009077 for financial support for the CHNS data collection and analysis files since 1989, the China-Japan Friendship Hospital, Ministry of Health for support for CHNS 2009, Chinese National Human Genome Center at Shanghai since 2009 and Beijing Municipal Center for Disease Prevention and Control since 2011. This research was supported by the National Natural Science Foundation of China (grant no. 81773419) and Chinese Institute of Nutrition DSM Research Fund (CNS-DSM-2017-035). The funders had no role in the design, analysis or writing of this article.
P. Z., Y. Z. and J. J. designed the study; P. Z., L. M., F. W. and L. C. provided statistical expertise; P. Z. wrote the manuscript; J. J. had full access to all of the data in the study and took responsibility for the integrity of the data and the accuracy of the data analysis; and all authors conducted the research, contributed to the interpretation of the results and critical revision of the manuscript for important intellectual content and read and approved the final manuscript.
The authors declare that they have no conflicts of interest.
Supplementary material
For supplementary material referred to in this article, please visit https://doi.org/10.1017/S0007114520000677


