



The notion of glycaemic index (GI) was introduced two decades ago to compare food exchanges within carbohydrate food categoriesReference Jenkins, Wolever, Taylor, Barker, Fielden, Baldwin, Bowling, Newman, Jenkins and Goff1. Two tables of GI values were successively published in 1995Reference Foster-Powell and Miller2 and 2002Reference Foster-Powell, Holt and Brand-Miller3 and referenced nearly 1300 foods and ingredients. The classification of carbohydrates into simple or complex carbohydrates is of little use for food GI prediction. GI is influenced by starch structure itself, manufacture and cooking processes, which play a considerable role in the final GIReference Bjorck, Liljeberg and Ostman4, Reference Wolever, Nuttall, Lee, Wong, Josse, Csima and Jenkins5. In fact, dietary carbohydrates influence metabolism by at least four mechanisms: nature of the monosaccharides absorbed; amount of carbohydrate consumed; rate of absorption; colonic fermentationReference Wolever6. Then, GI was proposed as a way to reduce postprandial glucose and insulin peaks – a situation that could have health benefits, in particular towards obesity, diabetes development and cardiovascular riskReference Jenkins, Kendall, Augustin, Franceschi, Hamidi, Marchie, Jenkins and Axelsen7–Reference Salmeron, Ascherio, Rimm, Colditz, Spiegelman, Jenkins, Stampfer, Wing and Willett12. Despite controversial literature data, dietary GI is potentially important in the treatment and prevention of chronic diseases and cancersReference Jenkins, Kendall, Augustin, Franceschi, Hamidi, Marchie, Jenkins and Axelsen7.
Many studies over the past two decades performed with diabetic subjects have shown that low-GI (LGI) regimens were able to improve glucose tolerance and plasma insulin sensitivity. LGI diets would also be beneficial through a more moderate insulin response (lower postprandial peak). Acute experiments in healthy subjects have shown a decrease in 24 h glucose concentrationsReference Brynes, Adamson, Dornhorst and Frost13, Reference Stevenson, Williams, Nute, Swaile and Tsui14. Improvement in the lipid profile with a decrease in total cholesterol, LDL-cholesterol and TAG concentrations and an increase in HDL-cholesterol were observed in longer-term studiesReference Ford and Liu15–Reference Jenkins, Wolever and Kalmusky18. A decrease in fat mass without weight modification was also found in one recent studyReference Bouche, Rizkalla, Luo, Vidal, Veronese, Pacher, Fouquet, Lang and Slama19. An increase in glucose oxidation during the first two postprandial hours was noted in healthy adults after a high-GI (HGI) breakfast consumptionReference Wursch, Acheson, Koellreutter and Jequier20. Conversely, LGI foods are responsible for an increase in fat oxidationReference Wee, Williams, Tsintzas and Boobis21, Reference Stevenson, Williams and Nute22.
Moreover, food intake may be influenced by the quality of carbohydrates, which could play a substantial role in satietyReference Roberts23. A LGI breakfast in an obese adolescent is associated with a lower food intake at lunchReference Ludwig, Majzoub, Al-Zahrani, Dallal, Blanco and Roberts24, Reference Ball, Keller, Moyer-Mileur, Ding, Donaldson and Jackson25. This suggests that the GI of foods could play a role in hunger regulation. Therefore, the prolonged satiety associated with LGI foods may be an effective method for reducing energy intake and achieving long-term weight controlReference Ball, Keller, Moyer-Mileur, Ding, Donaldson and Jackson25.
This trial assessed the metabolic effects of LGI and HGI regimens on body composition and blood parameters in overweight, non-diabetic subjects. Influence of a LGI diet and metabolic adaptations to a 5-week nutritional intervention were studied through the variation of anthropometric parameters (weight, BMI, body fat mass), fasting plasma glucose and lipid concentrations as well as substrate oxidation on day 1 and day 36. It is part of the European project, EUROSTARCH, designed to assess the nutritional benefits of starchy foods according to their nature, especially in patients at high risk for developing obesity and diabetes.
Subjects and methods
Experimental design
A 5-week nutritional, intervention trial was conducted using two types of dietary regimens. Subjects received either LGI or HGI foods in replacement of their usual starchy foods. It was a randomized, parallel group study. All participating subjects received written and oral information about the protocol and gave written informed consent. The study was approved by the Scientific Ethics Committee of Lyon and was in accordance with both the French ‘Huriet-Serusclat’ law and the Second Declaration of Helsinki. The two types of diets were randomly allocated according to the CONSORT guidelines.
On day 1 and day 36 of the study, body weight, body composition (impedance), energy and substrate oxidation (indirect calorimetry) were measured; fasting blood and urine samples were collected. Subjects also completed a 5-d dietary survey during the pre-inclusion period, as well as in weeks 3 and 5 of the study period.
Subjects
Subjects were recruited from the greater Lyon (France) area by advertisements. We performed a power calculation based on our primary study endpoint of change in bodyweight. Assuming a decrease in body weight of 1 (sd 1) kg for the LGI diet group and no change in body weight for the HGI diet group (sd 1), seventeen subjects per group provided >80 % power to detect a significant difference in weight loss between groups at the P < 0·05 level. The inclusion criteria for the study were men and women aged 20–60 years, BMI 25–30 kg/m2, stable body weight over the previous 3 months, non-pathological results for pre-inclusion biological tests, report of sedentary or moderate physical activity and a usual breakfast habit including cereals and representing 10–25 % of the daily energy intake. The exclusion criteria were pregnancy or women likely to become pregnant, post-menopausal women, any physiological or psychological illness that could influence the results, subjects likely to take medical drugs interfering with the biological parameters of the study, any metabolic disorders (including diabetes, dyslipidaemia and glucose intolerance), intense physical activity and report or evidence of excessive alcohol consumption or eating disorders. Subjects were also required not to have made any blood donation within the past 3 months before entering the study.
Approximately eighty people responded by telephone to the recruitment campaign; sixty-eight of these people were given further information about the study and underwent the pre-inclusion tests. Each subject had a screening test including measurements of body weight, height, blood pressure, waist:hip ratio (WHR), an interview regarding general health and a blood sample (blood differential count, glycaemia, transaminases, γGT, total cholesterol, HDL- and LDL-cholesterol, and TAG). Eating habits were also explored through dietary surveys, including consultation and advice by a trained dietitian and dietary records. Following the pre-inclusion tests, a total of forty suitable volunteers (twenty men and twenty women) were enrolled in the study.
The subjects were randomized into two groups as follows: twenty subjects in the LGI diet group (nine men and eleven women); twenty subjects in the HGI diet group (eleven men and nine women). Out of the forty enrolled subjects, only thirty-eight completed the study. Two subjects (women) – one in each diet group – could not perform the metabolic exploration on day 36 because of a viral infection (influenza) in one case and technical problems in the other case (inability to set catheters). Data from these two subjects were not analysed.
Experimental diets and assessment
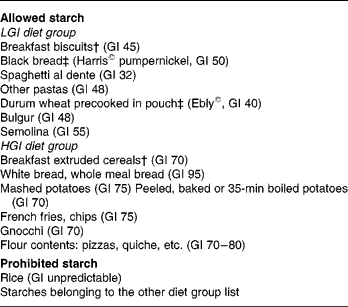
The present study consisted of ad libitum diets in which starches were replaced by either LGI or HGI starchy foods. Foods were considered as LGI whenever GI < 50 and HGI whenever GI>70 (relative to glucose). The subjects received individual guidance by a trained clinical dietitian during the pre-inclusion period, on day 1 and at the end of week 3 (day 21).
According to their dietary group, a list was given to the subjects indicating the starches they were allowed to eat and those prohibited in their group (Table 1). Lists of products were set using tables published by Foster-Powell et al. Reference Foster-Powell, Holt and Brand-Miller3. To increase subject compliance, part of the starches was provided for both groups throughout the study. Because of the relative availability of some food products, durum wheat precooked in pouches and black bread were provided by the Research Centre in Human Nutrition of Lyon to the subjects of the LGI group. Breakfasts were provided by Danone Vitapole© (Paris, France) and consisted of biscuits for the LGI group and extruded cereals for the HGI group. These breakfasts were isoenergetic, isoproteic, isoglucidic and isolipidic and their composition is reported in Table 2. Resistant starch, slowly and rapidly available glucose were estimated according to the method proposed by Englyst et al. Reference Englyst, Englyst, Hudson, Cole and Cummings26. Subjects were asked to consume the same amount of starch as usual and change only the type of starch. They were also asked not to modify their dietary habits regarding the food patterns and the amount of fruits and vegetables eaten.
* Glycaemic index (GI) was calculated using glucose as standard.
† Supplied by Danone Vitapole©, Paris, France.
‡ Supplied by the Centre de Recherche en Nutrition, Humaine, Lyon, France.
§ For details of subjects and procedures, see Subjects and methods.
LGI, low-GI; HGI, high-GI.
Table 2 Breakfast biscuits and extruded cereals composition†
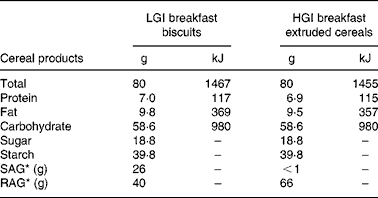
* Estimated types of nutritional carbohydrate fractions according to Englyst's methodReference Englyst, Englyst, Hudson, Cole and Cummings26.
† For details of subjects and procedures, see Subjects and methods.
LGI, low glycaemic index; HGI, high glycaemic index; SAG, slowly available glucose; RAG, rapidly available glucose.
The subjects were instructed to evaluate and record the amount of food and beverages eaten each day using a 5-d food diary during the pre-inclusion period (day 11–day 7) and in weeks 3 (day 16–day 20) and 5 (day 31–day 35) of the study. Ingested quantities were evaluated by the dietitian using a SU.VI.MAX© (SUpplémentation en VItamines et Minéraux AntioXydants) dietary photographic supportReference Le Moullec, Deheeger and Preziosi27. The macronutrient content of the test foods and 5-d dietary records were calculated using a computerized food database that included specific product-ingredient lists and recipes for test foods (latest release of GENI© software by MICRO 6© using CIQUAL tables (AFSSA, France)). Energy intake:BMR ratio was calculated on the basis of the 5-d dietary record periods for each subject to identify underreporting. Underreporting was researched using the Goldberg's cut-off limits (1·04 × BMR)Reference Goldberg, Black, Jebb, Cole, Murgatroyd, Coward and Prentice28. BMR was measured using indirect calorimetry at baseline and week 5. Mean GI of all meals taken in a day were determined using the following equation:

where Cfood is the amount of carbohydrate (g) contained in each ingested food product and Ctotal is the total amount of carbohydrate (g) ingested during the day. Mean GI targets were defined as < 50 for the LGI group and >70 for the HGI group. Mean glycaemic loads (GL) of all meals taken in a day were determined using the following equation:

Subjects were also asked to assess hunger sensations four times per d (in the morning, before lunch, in the afternoon and before dinner) by repeated ratings on 100 mm visual analogue scales anchored at either end with the words ‘none’ and ‘extreme’Reference Marmonier, Chapelot and Louis-Sylvestre29.
Measurements
Metabolic explorations and protocol sequence
Metabolic explorations were undertaken in the fasting state on day 1 and day 36 of the protocol. The body weight of subjects dressed in underwear was measured to the nearest 0·1 kg using a calibrated digital scale from SECA S.A. (Valenciennes, France). Body composition was assessed through monofrequency impedance measurement at 50 kHz (Star 50©; Spengler S.A., Antony, France)Reference Ellis30.
All blood samples were taken from an antecubital arm vein through a catheter. Blood samples were collected in tubes containing lithium heparinate and centrifuged at 3000 g and 4°C for 10 min; plasmas were stored at − 20°C. Glucose, TAG and NEFA concentrations were measured with an enzymatic colorimetric method (introduced by TrinderReference Trinder31) on a Cary 50 Bio© spectrophotometer from Varian Inc. (Palo Alto, California, USA) using a Glucose RTU© kit and a TG PAP© 150 kit from BioMérieux S.A. (Lyon, France) and a NEFA-C© kit from Oxoid Ltd. (Basingstoke, Hampshire, UK).
Plasma total cholesterol and HDL-cholesterol concentrations were measured on a MODULAR© Analytics P800 module from F. Hoffmann-La Roche Ltd. (Roche Diagnostics Division, Basel, Switzerland). Plasma LDL-cholesterol concentrations were calculated using the equation of Friedewald et al. Reference Friedewald, Levy and Fredrickson32.
Changes in mean serum total cholesterol between day 1 and day 36 were also estimated with equations developed by Keys et al. Reference Keys, Anderson and Grande33 and Hegsted et al. Reference Hegsted, McGandy, Myers and Stare34 respectively:


where S is SFA expressed as a percentage of total energy intake, P is PUFA expressed as a percentage of total energy intake, Z is dietary cholesterol expressed in mg/4200 kJ per d and C is dietary cholesterol expressed in mg/d. The results are then converted to mmol/l.
Plasma insulin and C-peptide concentrations were determined by RIA. Quantitative insulin sensitivity check index (QUICKI) was calculated using the formulas proposed by Katz et al. Reference Katz, Nambi, Mather, Baron, Follmann, Sullivan and Quon35. Homeostasis model assessment for estimate of relative insulin resistance (HOMA-IR) was calculated using the formulas proposed by Matthews et al. Reference Matthews, Hosker, Rudenski, Naylor, Treacher and Turner36.
![QUICKI = 1/(log[insulin] + log[glucose])](https://static.cambridge.org/binary/version/id/urn:cambridge.org:id:binary:20160321074506709-0300:S0007114507778674_eqnU5.gif?pub-status=live)
![HOMA\hyphen IR = ([glucose]\times [insulin])/22\cdot 5](https://static.cambridge.org/binary/version/id/urn:cambridge.org:id:binary:20160321074506709-0300:S0007114507778674_eqnU6.gif?pub-status=live)
where plasma glucose is expressed in mmol/l and serum insulin is expressed in mU/l.
Indirect calorimetry
Indirect calorimetry records were performed concomitantly with the metabolic explorations on day 1 and day 36 using a Deltatrac© calorimeter from Datex Instrumentation Corp. (Helsinki, Finland). Resting metabolism and energy expenditure as well as substrate oxidations (proteins, lipids and carbohydrates) were analysed. During explorations, VO2 ml/min and VCO2 ml/min were recorded every minute for 60 min. Substrate oxidations were calculated with Ferrannini's equationsReference Ferrannini37.
Statistical analyses
Differences between groups at baseline were calculated using Mann and Whitney test. Differences between groups in weight and cholesterol were assessed using analysis of covariance procedure with baseline as a covariateReference Vickers38. Mean GI and macronutrient distribution from dietary records at pre-inclusion, week 3 and week 5 were calculated on the basis of the amounts of foods eaten (self-reported compliance) and assessed by ANOVA procedure for repeated measures, testing for overall difference in level between diet groups (main effect of diet), change over time (main effect of time) and difference in time course between groups (diet × time interaction).
Differences between groups on days 1 and 36, changes in fasting blood samples, insulin resistance and sensitivity indexes and substrate oxidation values were analysed using analysis of covariance procedure using baseline as covariate.
All statistical analyses were performed using JMP© software, version 5.1.1 from SAS Institute Inc. (Cary, NC, USA). Statistical significance was inferred at P < 0·05. Results are reported as means with their standard errors.
Results
The characteristics of the thirty-eight subjects are presented in Table 3. There were no significant differences between groups at baseline. After statistical calculations, age did not interfere with any measured parameters.

* No significant difference between groups was found at baseline using a Mann and Whitney test.
† For details of subjects and procedures, see Subjects and methods.
WHR, waist:hip ratio; LGI, low-glycaemic index; HGI, high-glycaemic index.
Dietary intake
Dietary survey data and compliance
Self-reported data determined from the dietary records indicated good subject compliance. Nutritional intervention required a short-term adaptation but new regimens were completely accepted after a few days with good tolerance. A few cases of bloating were reported due to the use of black bread but without any impact on subject compliance. Only twenty hunger sensation reports (nine in the LGI group; eleven in the HGI group) were complete and suitable for analysis, and hunger sensation scale data revealed no differences between groups at baseline. In the LGI group, there was a trend towards an increased satiety before lunch when compared with the HGI group (P = 0·09 for diet × time interaction; data not shown).
Mean glycaemic index and glycaemic load
There were no significant differences in GI and GL between groups at baseline. After a 5-week nutritional intervention, dietary survey results showed that all subjects in the LGI group reached the defined LGI target (i.e. < 50) with a significant decrease in mean GI after 5 weeks of diet (LGI − 17·3 (sem 1·1), P < 0·001). In the HGI group the defined HGI target (i.e. >70) was not reached, GI remained at a high level but with no significant variation of their mean GI after 5 weeks of diet. The difference in mean GI between the LGI and HGI groups was significant after 5 weeks of treatment (P < 0·0001). GL were also decreased in the LGI diet group ( − 2·1 (sem 0·6), P = 0·002) but remained unchanged in the HGI group. There was no significant difference in GL between groups after 5 weeks of diet (Table 4).
Table 4 Dietary record data†
(Mean values with their standard errors)

* ANOVA for repeated measures testing the effects of diet, time and diet × time interaction between groups with baseline values as covariate. No significant difference was found at baseline between groups using a Mann and Whitney test.
† For details of subjects and procedures, see Subjects and methods.
LGI, low-glycaemic index; HGI, high-glycaemic index; EI, energy intake.
Macronutrient distribution
Dietary records showed that there was no significant variation in energy intake, protein, fat and carbohydrate distribution in both groups during the study period as well as between groups at baseline and after 5 weeks of nutritional intervention. There was also no difference in dietary fibre intake between groups at baseline (Table 4). However, the dietary surveys did show a significant increase in dietary fibre intake in the LGI group (+6·8 (sem 0·8) g, P < 0·0001) while no significant difference was noticed in the HGI group ( − 0·4 (sem 0·9) g, P = 0·33).
No differences in BMR were noted between groups at baseline (P = 0·50). No significant differences in BMR were observed within each group or between groups from week 0 to week 5. No subject was reported as underreporting when using Goldberg's cut-off limits. The calculated energy intake:BMR ratios were respectively 1·31 (sem 0·07) in the LGI diet group and 1·33 (sem 0·05) in the HGI diet group at baseline and no significant differences between groups, either at baseline or after intervention, were observed (Table 4).
Body weight, BMI, composition and waist:hip ratio
There were no significant differences in body weight and BMI between groups at baseline (P = 0·50 and P = 0·41 respectively). After a 5-week nutritional intervention, body weight measurements and BMI calculations were significantly decreased in the LGI group ( − 1·1 (sem 0·3) kg, P = 0·004 and − 0·4 (sem 0·1) kg/m2, P = 0·005 respectively), while no significant changes were reported in the HGI group (HGI − 0·2 (sem 0·2) kg, P = 0·41 and − 0·1 (sem 0·1) kg/m2, P = 0·39 respectively). These differences between groups for body weight and BMI were significant (P = 0·04 and P = 0·03 respectively) (Fig. 1).

Fig. 1 Changes in body weight, body composition and BMI after 5 weeks of an ad libitum low-glycaemic index (■; n 19) or high-glycaemic index (□; n 19) diet in overweight subjects. Fat mass values were obtained by using impedance. There were no differences in body weight and body composition at baseline between groups. Significant differences in body weight and BMI changes between groups were found by analysis of covariance using baseline as covariate (*P = 0·04 and **P = 0·03 respectively). For details of subjects and procedures, see Subjects and methods.
The subjects' body fat mass was similar between groups at baseline (P = 0·09). Changes in fat mass from week 0 to week 5 were not significant within the LGI group ( − 0·7 (sem 0·6) %, P = 0·15) nor within the HGI group ( − 0·2 (sem 0·4) %, P = 0·40). Furthermore, there were no differences between groups (P = 0·50) in percentage body fat mass (Fig. 1).
Mean WHR were higher than 0·8 in both groups, indicating that the type of body fat distribution was android. No change in mean WHR was observed after 5 weeks of nutritional intervention in both groups.
Fasting blood samples parameters
Plasma glucose, insulin and C-peptide concentrations, insulin resistance and sensitivity indexes
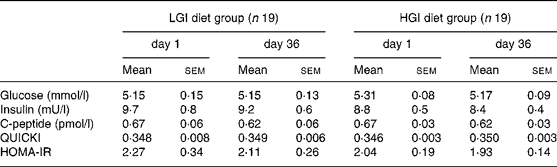
No significant differences in fasting glucose, insulin and C-peptide concentrations were noted between groups at baseline. After a 5-week nutritional intervention, fasting glucose and insulin concentrations did not change significantly in the LGI group, while C-peptide concentrations showed a significant decrease (P < 0·05). In the HGI group, fasting insulin and C-peptide concentrations did not change significantly while glucose concentrations showed a small but significant decrease ( − 0·15 (sem 0·04) mmol/l, P = 0·002). There were no significant differences in these three parameters after 5 weeks of diet. Quantitative insulin sensitivity check index and homeostasis model assessment for estimate of relative insulin resistance values revealed a non-significant decrease in insulin resistance in both groups (Table 5).
Table 5 Fasting plasma glucose, plasma insulin and C-peptide concentrations, quantitative insulin sensitivity check index (QUICKI) and homeostasis model assessment of relative insulin sensitivity (HOMA-IR) in both diet groups*†
(Mean values with their standard errors)
* No significant difference was found at baseline between groups using a Mann and Whitney test. No significant difference was found by analysis of covariance using baseline as covariate.
† For details of subjects and procedures, see Subjects and methods.
LGI, low-glycaemic index; HGI, high-glycaemic index.
Blood lipid concentrations
Significant decreases in fasting total cholesterol by 9·6 (sem 2·0) % ( − 0·52 (sem 0·12) mmol/l, P < 0·001) and LDL-cholesterol concentrations by 8·6 (sem 4·7) % ( − 0·36 (sem 0·13) mmol/l, P = 0·01) were observed in the LGI group after 5 weeks of nutritional intervention. No significant changes were found in the HGI group as regards fasting total cholesterol ( − 0·24 (sem 0·13) mmol/l, P = 0·12) and LDL-cholesterol concentrations ( − 0·22 (sem 0·11) mmol/l, P = 0·07) (Fig. 2).

Fig. 2 Changes in fasting plasma total, HDL- and LDL-cholesterol concentrations, total:HDL-cholesterol ratio and LDL-:HDL-cholesterol ratio after 5 weeks of an ad libitum low-glycaemic index (LGI, ■; n 19) or high-glycaemic index (HGI, □; n 19) diet in overweight subjects. No significant difference between groups was found in the baseline values between groups using Mann and Whitney test. In the LGI group, significant decreases were found in total cholesterol, LDL-cholesterol, total/HDL-cholesterol and LDL-/HDL-cholesterol compared with baseline using a Wilcoxon test (P = 0·001, P = 0·01, P = 0·003, P < 0·001 respectively). No significant differences were found between groups using an analysis of covariance using baseline as covariate. For details of subjects and procedures, see Subjects and methods.
HDL-cholesterol concentrations tend to decrease in both groups after 5 weeks of nutritional intervention ( − 0·05 (sem 0·03) mmol/l and − 0·05 (sem 0·04) mmol/l in LGI and HGI groups respectively) but was not significant. No difference in HDL-cholesterol between groups was reported.
LDL-:HDL-cholesterol and total:HDL-cholesterol ratios did not differ significantly between groups at baseline (P = 0·91 and P = 0·73 respectively), but a significant decrease in the LGI group ( − 0·22 (sem 0·08), P = 0·003 and − 0·31 (sem 0·09), P = 0·001 respectively) was observed between week 0 and week 5, while no significant changes were reported in the HGI group ( − 0·06 (sem 0·09), P = 0·68 and − 0·02 (sem 0·12), P = 0·83 respectively) (Fig. 2).
Predicted changes in serum total cholesterol using the equations of Keys et al. and Hegsted et al. were significantly lower in the LGI diet group than observed changes (P = 0·0004 and P = 0·0016 respectively), while no significant difference was observed in the HGI group (P = 0·12 and P = 0·19 respectively). No difference between groups was reported (Table 6).
Table 6 Predicted and observed changes in mean serum total cholesterol‡
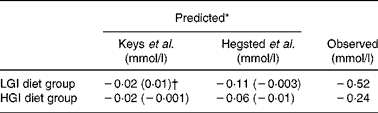
* Predicted changes in serum total cholesterol were calculated by using the equations of Keys et al. Reference Keys, Anderson and Grande33 and Hegsted et al. Reference Hegsted, McGandy, Myers and Stare34 respectively: Δcholesterol (mg/dl) = 2·7ΔS − 1·35ΔP+1·5ΔZ1/2 and Δcholesterol (mg/dl) = 2·16ΔS − 1·65ΔP+0·067ΔC − 0·53, where S is SFA (percentage total energy intake), P is PUFA (percentage total energy intake), Z is dietary cholesterol (mg/4200 kJ per d) and C is dietary cholesterol (mg/d). Then results are converted to mmol/l. No significant difference was found between groups.
† Values in parentheses were calculated assuming no change in mean dietary cholesterol intake between the two periods.
‡ For details of subjects and procedures, see Subjects and methods.
LGI, low-glycaemic index; HGI, high-glycaemic index.
Fasting plasma TAG was not different between groups at baseline (P = 0·93) and, furthermore, was not altered by dietary treatment (P = 0·32). Moreover, no significant differences in plasma NEFA concentrations were observed between groups either at baseline (P = 0·70) or over time, between week 0 and week 5, within each group or between groups (P = 0·79).
None of theses changes over time in lipid profile was significant between groups.
Carbohydrate and lipid oxidation
There were no differences in baseline values (LGI 1·16 (sem 0·13) mg/kg per min; HGI 1·26 (sem 0·13) mg/kg per min, P = 0·52) and no changes between week 0 and week 5 as regards fasting carbohydrate oxidation. Furthermore, no significant differences were observed within each group or between groups (P = 0·93). No significant differences in lipid oxidation were observed between groups either at baseline (LGI 0·68 (sem 0·06) mg/kg per min; HGI 0·73 (sem 0·07) mg/kg per min, P = 0·48) or between week 0 and week 5, within each group or between groups (P = 0·87).
Discussion
In view of the widespread concern about the obesity epidemic and associated health care costs, the development of effective weight management strategies has become a public health priority. As a consequence, considerable interest has been paid to carbohydrate qualities and particularly to GI and GL as potential tools for regulating weight and food intakeReference Roberts23–Reference Ball, Keller, Moyer-Mileur, Ding, Donaldson and Jackson25 and also for the prevention of diabetes and CVDReference Ludwig39. Although dozens of randomized controlled trials have already highlighted the impact of LGI diets on carbohydrate and lipid metabolism, frequently in association with energy restrictionReference Opperman, Venter, Oosthuizen, Thompson and Vorster11, Reference Sloth, Krog-Mikkelsen, Flint, Tetens, Bjorck, Vinoy, Elmstahl, Astrup, Lang and Raben17, Reference Bouche, Rizkalla, Luo, Vidal, Veronese, Pacher, Fouquet, Lang and Slama19, Reference Ebbeling, Leidig, Sinclair, Seger-Shippee, Feldman and Ludwig40, Reference Wolever, Jenkins, Vuksan, Jenkins, Wong and Josse41, few have focused on the feasibility of an intervention on feeding habits by simple dietary instructions and its impact on body weight, carbohydrate and lipid metabolism. Therefore, this trial was designed to assess the metabolic effects of lowered GI in overweight, non-diabetic subjects without energy restrictions. Indeed, our main finding demonstrates that a LGI diet results in a decrease in body weight and an improvement in the lipid profile.
Subjects were monitored by a trained clinical dietitian with the use of dietary surveys and visual scales. Validity and accuracy of surveys were verified with indirect calorimetry and calculation of energy intake:BMR ratios. This ratio was around 1·3 in both diet groups, which corresponds to what is usually found in sedentary peopleReference Black, Goldberg, Jebb, Livingstone, Cole and Prentice42. Energy intakes did not differ after 5 weeks, contrary to recent studies in which a significant decrease in energy intake likely interfered with weight lossReference Sloth, Krog-Mikkelsen, Flint, Tetens, Bjorck, Vinoy, Elmstahl, Astrup, Lang and Raben17, Reference Bouche, Rizkalla, Luo, Vidal, Veronese, Pacher, Fouquet, Lang and Slama19.
Replacing starches with LGI foods in daily meals was relatively simple to implement in the medium term and well accepted by all subjects despite the inevitable feeding strains. Reducing GI was rapidly obtained with only few modifications of food habits and could be maintained for 5 weeks. This is consistent with a recent study that showed that implementation of a LGI diet in overweight children was feasible on the basis of a 12-week nutritional intervention by giving brief instructions on categorizing foodReference Young, West, Ortiz and Carlson43.
The main finding was the significant decrease in body weight after a 5-week ad libitum LGI diet. The subjects of the LGI diet group did not lower their energy intake significantly more than those in the HGI diet group. The mean weight loss was around 1 kg. No change in body composition was observed but such a change is below the limit of sensitivity of impedance. Indeed, the energy deficit corresponding to 1000 g of weight decrease is lower than approximately 30 MJ (7000 kcal) (i.e. 1000 g of fat mass loss), which represents the equivalent of an energy deficit of approximately 0·8 MJ/d (200 kcal/d) over 5 weeks. This corresponds to the known limits of measuring daily energy intake using a dietary surveyReference Schoeller44.
Our hunger sensation scales have shown a trend to a decrease in hunger sensation between meals: before lunch and dinner in the LGI group. This effect may be due to the consumption of food richer in dietary fibre in this group and thus potentially more satiating than the subjects' usual foodsReference Howarth, Saltzman and Roberts45. However, its potential for associated weight loss may be minimized when compared with some other studies where the amount of dietary fibre ingested is highReference Sloth, Krog-Mikkelsen, Flint, Tetens, Bjorck, Vinoy, Elmstahl, Astrup, Lang and Raben17, Reference Wolever, Jenkins, Vuksan, Jenkins, Wong and Josse41, Reference Jarvi, Karlstrom, Granfeldt, Bjorck, Asp and Vessby46. Therefore, the present data tend to support the argument that LGI diets are more satiating and result in lower ad libitum energy intake than do HGI dietsReference Ludwig9, Reference Roberts23–Reference Ball, Keller, Moyer-Mileur, Ding, Donaldson and Jackson25, Reference Pawlak, Ebbeling and Ludwig47. Weight loss may not be explained by an increase in energy expenditure because BMR did not change after 5 weeks of regimen when assessed by indirect calorimetry. The observed decrease in body weight in the LGI diet group is not in agreement with two other studies showing no significant difference in body weight after a 5- or 10-week LGI diet compared with a HGI regimenReference Sloth, Krog-Mikkelsen, Flint, Tetens, Bjorck, Vinoy, Elmstahl, Astrup, Lang and Raben17, Reference Bouche, Rizkalla, Luo, Vidal, Veronese, Pacher, Fouquet, Lang and Slama19. However, these two studies both included reduced energy intake. So far, no appropriate long-term studies have been undertaken to assess the effects of a LGI diet on appetite and energy intake, although evidence from short-term studies is availableReference Ludwig, Majzoub, Al-Zahrani, Dallal, Blanco and Roberts24, Reference Ball, Keller, Moyer-Mileur, Ding, Donaldson and Jackson25.
We found no evidence of improvement of risk markers for type 2 diabetes. Fasting glucose concentrations did not change in the LGI group after 5 weeks, while a slight and unexpected decrease was observed in the HGI diet group. Although this change was small (from 5·3 to 5·1 mmol/l), it could thus be of clinical benefit given that impaired fasting glucose is frequently associated with overweight. There were no differences in fasting insulin and C-peptide concentrations observed between groups; also, a trend towards a decrease in insulin resistance was noted in both dietary groups. Previous studies show that LGI diets are able to lower fasting glucose and insulin concentrations and therefore to increase insulin sensitivityReference Brynes, Adamson, Dornhorst and Frost13, Reference Stevenson, Williams, Nute, Swaile and Tsui14, Reference Stevenson, Williams and Nute22, Reference Jarvi, Karlstrom, Granfeldt, Bjorck, Asp and Vessby46, Reference Wolever and Mehling48. However, evaluation of insulin sensitivity would have required the use of an insulin clamp procedure. In addition, mean WHR were higher than 0·8 in both groups indicating that the type of body fat distribution was android. Thus, subjects, and especially women, could be potentially at risk of insulin resistance even if ratios remained lower than 1·0. This could partially explain the lack of sensitivity necessary to observe improvement of risk markers for type 2 diabetes.
A significant decrease in total and LDL-cholesterol was seen in the LGI diet group. Thus, the 5-week LGI diet resulted in an 8·6 % decrease in LDL-cholesterol ( − 0·36 (sem 0·13) mmol/l), whereas a much smaller decrease (3·7 %) was seen in the HGI diet group. Despite a similar decrease in HDL-cholesterol, a difference could still be observed when LDL-cholesterol was expressed relative to HDL-cholesterol. Therefore, the present results are in accordance with previous studies, performed in diabetic, hyperlipidaemic or healthy subjects, showing lower LDL-cholesterol and total cholesterol after LGI diets than after HGI dietsReference Opperman, Venter, Oosthuizen, Thompson and Vorster11, Reference Sloth, Krog-Mikkelsen, Flint, Tetens, Bjorck, Vinoy, Elmstahl, Astrup, Lang and Raben17–Reference Bouche, Rizkalla, Luo, Vidal, Veronese, Pacher, Fouquet, Lang and Slama19. Moreover, according to very recent studies, a reduction in LDL-cholesterol of 1 mmol/l leads to a decrease in overall mortality by 15 %, in coronary mortality by 24 % and in the incidence of strokes by 24 %, independently of the prior LDL levelReference Genser and Marz49, Reference Baigent, Keech and Kearney50. Thus, a reduction of one third of mmol/l in LDL concentration in the LGI diet group may also have a beneficial impact on cardiovascular risk factors, the more so as it is reasonable to estimate that the reduction in LDL continues beyond 5 weeks of LGI diet. On the other hand, a trend towards a decrease by 2·5 % in HDL-cholesterol was also observed following the LGI diet. This is not in accordance with previous studies, where LGI diets have been associated with higher HDL-cholesterol concentrationsReference Ford and Liu15, Reference Frost, Leeds, Dore, Madeiros, Brading and Dornhorst16, Reference Liu, Manson, Stampfer, Holmes, Hu, Hankinson and Willett51.
This global decrease in the cholesterol fraction could be due to a decrease in total energy intake or fat intake, which is in accordance with the decrease in body weight but not with our dietary records. Predicted changes in serum total cholesterol using the equations of Keys et al. and Hegsted et al. showed indeed that observed cholesterol changes were not due to a modification of cholesterol intake during the nutritional intervention. The increase in dietary fibres that characterized the LGI diet did not contribute to lower cholesterol concentrations either. Nevertheless, the decrease in LDL-cholesterol was more than twice the decrease in HDL-cholesterol and, thus, lipid ratios indicate the benefit in terms of decreased cardiovascular riskReference Anderson, Castelli and Levy52, Reference Lemieux, Lamarche, Couillard, Pascot, Cantin, Bergeron, Dagenais and Despres53.
Finally, although mean GI and GL were reduced in the LGI diet group as expected, there was no significant difference in GL between groups after 5 weeks of nutritional intervention. According to some authors, GL seems to be a better indicator of the glycaemic response to mixed meals than either GI or carbohydrate intake aloneReference Atkinson, McMillan-Price, Petocz and Brand-Miller54, Reference Brand-Miller, Thomas, Swan, Ahmad, Petocz and Colagiuri55. However, one can argue that GI is a better measure of carbohydrate quality than is GL, because any given overall dietary GL value is driven by both GI and carbohydrate quantity. Moreover, in observational studies of habitual diets, LGI diets may be more likely to reflect a prudent nutrient-rich, fibre-rich diet than are low-GL dietsReference Salmeron, Ascherio, Rimm, Colditz, Spiegelman, Jenkins, Stampfer, Wing and Willett12, Reference Salmeron, Manson, Stampfer, Colditz, Wing and Willett56. Thus, even if changes in GL do not correspond with changes in GI, beneficial effects on carbohydrate and probably on lipid metabolism can still be observed with LGI diets. Additionally, in the HGI group the defined GI target (i.e. >70 %) was not reached. This may have decreased the power of the present study to observe a difference between dietary groups and, furthermore, have contributed to the relatively weak effects of low GI diet observed in the present study.
In conclusion, this study shows that lowering the GI of daily meals with simple dietary recommendations is relatively simple to implement in the medium term with few constraints: simplicity of provisioning and low costs of LGI foods; no impact on food patterns and the amount of fruits and vegetables eaten; few social constraints; rare digestive disorders. It supports previous findings on the beneficial effects of LGI diets on body weight regulation as well as on cardiovascular risk factors. The effects of such a minor intervention remain subtle, but nonetheless important if the effect is cumulative with time. However, it does not support the argument that LGI diets are more beneficial than HGI diets regarding carbohydrate metabolism. Thus, further long-term studies are needed to consolidate these findings and assess whether adverse metabolic adaptations arise. However, the present study emphasizes the feasibility of such interventions. These are required to develop practical dietetic advice for overweight/obese subjects and diabetics and possibly contribute to the prevention of such pathologies or decrease the associated comorbidities.
Acknowledgements
We thank Christine Maîtrepierre and Jocelyne Peyrat for their management of the subjects during the metabolic exploration days, Corinne Louche-Pélissier for the management of the biological analyses and Yann Salerio for his assistance in the translation of the manuscript. This study was supported by the European Union (EUROSTARCH project). Contract no. QLK1-2001-00 431. Breakfast cereals were supplied by Danone Vitapole, Paris, France. The authors declare no conflict of interest in the conduction of the study and the writing of the manuscript.



