The 2020–2025 Dietary Guidelines for Americans recommends a daily total dietary fibre (TDF) intake of 14 g/1000 kcal, which equates to approximately 25 g/d for adult females and 38 g/d for adult males. However, most Americans fall far below this recommendation, with an average daily intake of only 16 g of fibre(Reference Hoy and Goldman1,2) . Fibre consumption is inversely associated with risk of some chronic diseases, including CHD, colon cancer, inflammatory bowel disease and type 2 diabetes(Reference Yao, Fang and Xu3–Reference Liu, Wu and Li6). Additionally, some dietary fibres can beneficially modulate gastrointestinal (GI) function by delaying gastric emptying and slowing glucose absorption, increasing faecal bulk, and improving laxation and alleviating constipation(Reference Müller, Canfora and Blaak7,Reference Yang, Wang and Zhou8) . In an effort to shift average daily intake of fibre towards recommendations, the Dietary Guidelines for Americans suggests increasing servings of fruits, vegetables and whole grains(2).
While eating whole fruit provides a source of some dietary fibre, consuming fruit juice alone does not provide a substantial amount. This is because the residue or pomace of fruit is often removed and discarded or repurposed in animal feed during the industrial production of fruit juice(Reference Mamma and Christakopoulos9). Orange and apple pomaces are fibrous materials that contain mostly fermentable pectin, as well as cellulose, lignin and hemicelluloses. Combinations of these extracted non-digestible carbohydrates are classified as mixed plant cell wall fibres and are recognised as dietary fibre for nutrition facts labelling purposes by the US Food and Drug Administration(Reference Grigelmo-Miguel and Martín-Belloso10,11) . In addition to fibre, fruit pomace also contains antioxidative phenolic compounds, which are well known to exert beneficial bioactions(Reference Mamma and Christakopoulos9,Reference Lu and Yeap Foo12) . Thus, incorporation of fruit pomace back into juice would likely provide more physiological benefits than juice alone.
Given the fermentability of pectin, a possible mechanism for any beneficial effects of pomace on GI function may be, in part, metabolic actions by and alterations to the GI microbiota or bile acid (BA) pool. Production of SCFA from microbial fibre fermentation is associated with several physiological benefits, including GI health(Reference Alexander, Swanson and Fahey13). In humans, 6 g/d of pectin increased faecal SCFA concentrations, and supplementation with OJ and orange pomace increased relative abundance of Lachnospiraceae and Ruminococcaceae, both known SCFA producers(Reference Dennis-Wall, Burns and Solch14,Reference Spiller, Chernoff and Hill15) . Stool consistency has also been strongly associated with overall species richness and abundance of specific microbial taxa in healthy adult women(Reference Vandeputte, Falony and Vieira-Silva16). Additionally, some GI bacteria can metabolise BA, changing the physiochemical, and thus signalling, properties(Reference Ridlon, Kang and Hylemon17). Alterations to the faecal BA pool composition have been linked to improved GI function and bowel habits and reduced risk of GI disease(Reference Ridlon, Harris and Bhowmik18–Reference Jia, Xie and Jia20). This is likely due to the fact that BA are potent signalling molecules that have been demonstrated to influence gastric emptying and intestinal transit time(Reference Appleby and Walters19). These points signify a complex relationship between dietary fibre, GI microbiota and the BA pool that remains to be fully elucidated and may be a potential mechanism by which mixed plant cell wall fibres may improve GI function. Consumption of orange juice (OJ) and orange pomace (providing 10 g/d fibre) has previously been reported to increase stool frequency and alter stool consistency in healthy young adults(Reference Dennis-Wall, Burns and Solch14). However, the participant age range was comparatively narrow, and faecal BA were not analysed.
The present studies investigated the effects of enzyme-treated orange and apple pomace consumption on measures of GI function, the faecal microbiota and the faecal BA pool in healthy individuals with self-reported normal GI function. It was hypothesised that healthy individuals consuming daily servings of either OJ or apple juice (AJ) with added orange pomace (OJ + P) or apple pomace (AJ + P), respectively, providing 10 g/d fibre for 4 weeks would have an increased bowel movement (BM) frequency compared with OJ or AJ alone. Secondary outcomes included total daily fibre intake, stool consistency, ease of stool passage and GI tolerance measures. Potential mechanisms were explored by assessing the faecal microbiota community and faecal BA pool composition. The general relationships between habitual TDF intake and both faecal microbial and BA composition were also explored a posteriori.
Materials and methods
Ethical approval
Both two-arm, randomised, double-blinded, placebo-controlled trials (PEP-1805/BIO-1808) were registered at clinicaltrials.gov, registration number NCT03749031. This study was conducted according to the guidelines laid down in the Declaration of Helsinki, and all procedures involving human subjects/patients were approved by an Independent Review Board (IntegReview, Austin, TX). Written voluntary informed consent were obtained from all participants.
Subjects
Healthy adults aged 18–61 years from the Chicago metropolitan area were recruited for this study and compensated for participation. The study clinic site was at Biofortis Innovation Services in Addison, IL. Exclusion criteria included significant GI disease, chronic disorders; recent history of constipation or diarrhoea, regular use of non-steroidal anti-inflammatory drugs, antacids, proton pump inhibitors, or H2 blockers, recent antibiotic use (within 3 weeks), extreme dietary habits, recent history of alcohol abuse, and pregnancy. Participants were asked to refrain from intake of orange, apple, grapefruit, and tomato fruits and products, probiotics or probiotic foods, prebiotic supplements, and medications known to influence GI function over the course of the study. Participants were also asked to maintain their habitual diet and physical activity pattern throughout the study.
Study design and products
The studies were conducted between fall 2018 and spring 2019. Fig. 1 depicts the study timelines and sample collection points. The studies consisted of a 2-week run-in period followed by a 4-week intervention period (Intervention 1), a minimum 3-week washout period and a final 4-week intervention period (Intervention 2). Clinic assessments were conducted at all visits and included measurements of height (baseline only), body weight, vital signs, evaluation of prior and concomitant medication and supplement use, and a review of inclusion/exclusion criteria (for eligibility and for potential protocol deviations).

Fig. 1. Study timeline and sample collection points. Clinical assessments were also conducted at each visit. GI: gastrointestinal.
After the run-in period, participants were stratified by baseline BM frequency (>7 BM/week and ≤7 BM/week) and randomly assigned to a test sequence (juice → juice + pomace, or juice + pomace → juice) on a 1:1 basis. Randomisation was performed by selecting the next sealed sequential randomisation envelope, containing randomisation number and treatment assignment, derived from a computer-generated randomisation list by a statistician not associated with the trial. All subjects, investigators and outcome assessors were blinded, study products were coded, and containers were labelled with the product code, instructions, a reminder of foods to avoid, and an expiration date. In each respective study, participants were instructed to consume either 16 oz of juice (Tropicana Pure Premium 100 % Orange Juice or Tropicana Pure Premium 100 % Apple Juice, Tropicana Products, Inc., Bradenton, FL) or 16 oz of combined juice + 180 g enzyme-treated orange or apple pomace (10 g of fibre from pomace) daily without timing restrictions during the intervention periods. An amount of 180 g/d pomace was chosen due to efficacy for increasing BM frequency in a previous study(Reference Dennis-Wall, Burns and Solch14).
All study products were prepared at PepsiCo, Bradenton, FL, and were subject to extensive microbiological testing prior to shipment in clear plastic bottles. Participants picked up their assigned product at the beginning of each intervention period at the study clinic. In order to reduce viscosity to a palatable level for beverages while retaining fibre content, orange and apple pomaces were treated with food-grade pectinases that are also found in the human digestive tract (US patent WO2017035458A1) and further processed to reduce the particle size and were pasteurised to deactivate the added enzymes during the manufacturing process. Enzyme-treated orange and apple pomaces are proprietary ingredients from PepsiCo, Inc. Nutrition information for the study products are listed in online Supplementary Table 1. The orange and apple pomace contains cellulose, pectin and hemicellulose. In addition, orange pomace contains vitamin C, folate, potassium and phenolic compounds.
Diaries, questionnaires and diet records
Participants completed bowel habit diaries every day during the run-in period, the Intervention 1 period, the Intervention 2 period and the final week of the washout period. The diary recorded the day, time of day, ease of passage and consistency of BM. Participants were asked to record ease of passage (scale of 1 to 5) and consistency of BM (scale of 1 to 7) based on the Bristol Stool Scale(Reference Lewis and Heaton21). Participants completed GI tolerance questionnaires(Reference Vester Boler, Rossoni Serao and Bauer22) daily during the run-in period (2 week), the first 2 week and the final 3 d of Week 3 and 4 of Intervention 1, the final week of washout, and the first 2 week, and the final 3 d of Week 3 and 4 of Intervention 2. The questionnaires scored presence and severity of gas/flatulence, nausea, vomiting, abdominal cramping, abdominal distention/bloating, borborygmus/stomach rumbling, burping and/or reflux (0 = none, 1 = mild, 2 = moderate and 3 = severe). The daily composite score was calculated as the sum of all individual component scores and averaged over the final 3 d of Week 3 and 4. Three-day diet records were completed on any 2 weekdays and 1 weekend day during the last week of each study period and reviewed by study clinic staff for completeness. In the event that participants consumed excluded foods, the deviation was recorded. Nutrient intakes were analysed using the Food Processor Nutrition Analysis & Fitness Software (version 10.4 or later, ESHA Research). Participants were also sent daily reminder emails and recorded daily study product consumption in a diary, which was used to calculate compliance (percentage of daily intakes). Compliance was defined as 80–120 %. Compliance was defined as 80–120 %. Participants were provided more product in the event the treatment window needed to be extended. If the window was extended, compliance would be expected to be >100 % of the total target amount since the participant remained on product until the scheduled clinic visit.
Stool sample collection and processing
Home collection of stool samples occurred during the last 3 d of each of the four periods by the first fifty subjects of each study who voluntarily agreed to be part of a sub-study investigating the impact of the pomace interventions on faecal microbiota and BA composition. Stool samples were aliquoted into OMNIgene-GUT tubes (DNA Genotek Inc.) for microbiota analysis and sterile 50 ml of conical tubes for BA analysis. Samples were placed immediately in participants’ freezers until the next scheduled clinic visit. Upon delivery, samples were stored at −80°C until analysis.
DNA extraction and microbiota analysis
Faecal bacterial DNA was extracted using the PowerLyzer PowerSoil Kit (Qiagen) with bead-beating using a vortex adaptor (cat. no. 13 000-V1-24, Qiagen). The concentration of extracted DNA was quantified using a Qubit® 3·0 fluorometer (Life Technologies). 16S rRNA gene amplicons of the V4 region were generated, pooled and sequenced for each sample as previously described by our laboratory(Reference Alexander, Cross and Devendran23). Sequencing was performed at the W. M. Keck Center for Biotechnology at the University of Illinois using an Illumina MiSeq with v3 reagents (Illumina Inc.).
Forward reads were trimmed using the FASTX-Toolkit (version 0.0.14), and QIIME 2.2019.4 was used to process the resulting sequence data(Reference Bolyen, Rideout and Dillon24). An average of 50 595 reads per sample were obtained before processing. Briefly, high-quality (quality value ≥ 20) sequence data derived from the sequencing process were demultiplexed. Data were then denoised and assembled into a feature table of amplicon sequence variants using DADA2(Reference Callahan, McMurdie and Rosen25). Taxonomy was assigned using the SILVA 132 database(Reference Quast, Pruesse and Yilmaz26). An even sampling depth of 24 462 sequences per sample was used for assessing α- and β-diversity measures. α-diversity was estimated using observed operational taxonomic unit (OTU), Shannon’s index and Faith’s PD metrics. β-diversity was assessed using weighted and unweighted UniFrac distance measures and presented with principal coordinates analysis plots(Reference Lozupone and Knight27).
Faecal microbial-targeted quantitative PCR (qPCR) was performed by the Gastrointestinal Laboratory at Texas A&M University according to previously published methods(Reference Blake, Guard and Honneffer28). Primers targeting both total bacteria (universal) and highly abundant, potentially pathogenic, and metabolically relevant taxa (Blautia, C. hiranonis, C. scindens, Enterococcus, E. coli, Fusobacterium, Lactobacillus, Streptococcus and Turicibacter) were used. Primer sequences and conditions are listed in online Supplementary Table 2.
Bile acid extraction and quantification
Faecal BA extraction was adapted from Zheng 2017(Reference Zheng, Huang and Zhao29). Briefly, faecal samples were lyophilised and manually ground into powder. Approximately 20 mg of sample was extracted by homogenising with 400 μl of methanol:water [1:1], containing 200 nM of nordeoxycholic acid (internal standard) followed by centrifugation. The supernatant was removed and saved, and the pellet was further extracted by vortexing with 400 μl of methanol:acetonitrile (1:4, containing 200 nM of nordeoxycholic acid) followed by centrifugation. Supernatants were combined and further centrifuged to remove solid particulate. Samples were then sterile-filtered using a 0·2 μm filter and diluted in methanol for analysis using LC-MS.
BA concentrations were quantified using a LC-MS (Synapt G2Si Mass Spectrometer with Acquity UPLC system, Waters Corp) equipped with an Acquity UPLC HSS T3 Column (186003539, Waters Corp) and an Acquity UPLC HSS T3 VanGuard Pre-column (186003976, Waters Corp). The elution solvents were water + 0·01 % formic acid (A) and acetonitrile + 0·01 % formic acid (B), and the elution gradient was linear from 100 % A to 100 % B over 28 min at a flow rate of 500 μl/min. The MS was operated at a negative electrospray ionisation mode. Standard curves were generated, and linear ranges were identified using a combined standard solution at ten different concentrations, each spiked with 2 μM nordeoxycholic acid. BA included in the standard curve were cholic acid, glycocholic acid, taurocholic acid, chenodeoxycholic acid, glycochenodeoxycholic acid, taurochenodeoxycholic acid, deoxycholic acid, glycodeoxycholic acid, taurodeoxycholic acid, lithocholic acid, glycolithocholic acid, taurolithocholic acid, ursodeoxycholic acid, glycoursodeoxycholic acid and tauroursodeoxycholic acid at concentrations ranging from 0·1 to 25 uM.
Statistical analysis
Sample size calculations were performed under the paired t-test assumptions using the following estimates for the primary outcomes (weekly total BM) from a previous study: control (mean = 8·95, sem = 0·40) and treatment (mean = 10·52, sem = 0·44)(Reference Dennis-Wall, Burns and Solch14). At a 0·05 level of significance and a correlation between groups of 0·50, a sample size of 75 is required to attain 80 % power. Assuming a 20 % attrition rate, a total sample size of 90 for each study was required.
Statistical analyses were performed using SAS (version 9.4) and MaAsLin2(Reference Mallick, Rahnavard and McIver30) in R(31). Significance was set as P < 0·05 or q < 0·25, and P < 0·10 was considered as trends. Bowel habits and GI intolerance scores were analysed on a modified intent-to-treat (mITT) basis. The number of BM/week was defined as the average number of BM of reported days multiplied by 7 if at least 4 out of 7 d were completed in a given week and rounded to the larger integer. Weekly stool consistency and ease of passage scores were calculated as the sum of reported scores divided by the total number of BM. Due to the high proportion of subjects with at least 1 BM every day in a given week, the number of days with 0 BM was dichotomised to none v. at least 1 in a week. Due to the high number of subjects with no GI tolerance issues, scores were dichotomised to represent subjects with, on average, at least mild issue(s) (score ≥1) and subjects with no issue(s) (scores <1). Dichotomised and count data were analysed with a generalised linear mixed model following a binary distribution with a logit link and a Poisson distribution with a log link, respectively. Continuous data were analysed with a linear mixed model. Test group, period, sequence and sex were considered fixed effects. For models over time, the week and group by week interaction was also included. For each outcome, a final model was selected with the backwards elimination method where test group retained in the model. A program was written to perform the backward elimination in an iterative process. All candidate variables were specified a priori. The overall F test was used to evaluate the significance of a factor, and only significant factors were retained.
Microbial community and BA data were analysed on a sub-study per protocol basis. Response of microbial relative abundances and faecal BA proportions from baseline to intervention periods was analysed using a generalised linear mixed model assuming a β-distribution and a logit link; microbial qPCR results and α-diversity were analysed using a generalised linear mixed model assuming a normal distribution and a log link. For microbial α-diversity, relative abundances and faecal BA proportions, fixed effects of group by week interaction and TDF intake were included, and a random effect of subject nested within sequence was included. When an effect or interaction was significant, post hoc pairwise comparisons were performed using Tukey’s multiple comparison tests. Differences in microbial β-diversity were analysed using unweighted and weighted UniFrac distances and pairwise PERMANOVA in QIIME 2.0(Reference Bolyen, Rideout and Dillon24). The relationship between high and low baseline TDF intake and relative abundances of bacteria phylotypes and faecal BA proportions was investigated a posteriori by stratifying intake data from the run-in and washout periods into TDF quintiles. The highest and lowest (Q5 and Q1) intake quintiles were compared using a generalised linear mixed model assuming a β-distribution and a logit link. Linear associations between baseline TDF intake and relative abundances of bacteria phylotypes were investigated a posteriori using MaAsLin2(Reference Mallick, Rahnavard and McIver30). Parameters included arcsine transformation and total-sum scaling normalisation with TDF and age as fixed effects.
Results
A total of 122 subjects were screened for participation, and ninety-one subjects were enrolled between October 2018 and January 2019 in the orange study and ninety subjects were enrolled between October 2019 and May 2019 in the apple study. Subjects who completed the orange study were provided the option to also participate in the apple study, but not required. In total, sixty-nine subjects completed both studies. In the orange study, two subjects were removed from the mITT population because they did not provide any outcome data, leaving eighty-nine subjects in the analysis of primary and secondary outcomes (Fig. 2(a)). In the apple study, four subjects were removed from the mITT population because they did not provide outcome data, leaving eighty-six subjects in the analysis of primary and secondary outcomes (Fig. 2(b)). Participant baseline demographics are listed in Table 1 and were similar between mITT and sub-study participants. Compliance ranged from 95·3 to 100 % over the course of the orange study and from 80·4 to 103·6 % in the apple study. Dietary intakes at the start and end of intervention periods in both studies are reported in online Supplementary Tables 3 and 4. TDF intakes, excluding the study beverages, were not significantly different between arms at the end of the interventions in the apple (P = 0·24) or orange (P = 0·67) studies. In the orange mITT population, TDF intake, excluding study beverages, ranged from 0·94 to 75·04 g/d over the course of the study, whereas the sub-study group ranged from 4·87 to 40·47 g/d. In the apple mITT population, TDF intake, excluding study beverage, ranged from 1·21 to 40·38 g/d over the course of the study, whereas the sub-study group ranged from 5·31 to 30·83 g/d. Additionally, intra-individual variation in TDF intake was substantial, with 65 % and 61 % of participants exhibiting >20 % CV over the course of the orange and apple studies, respectively.

Fig. 2. Participant flow diagram. Subjects were analysed on a mITT and PP basis for all outcomes except microbiota and faecal bile acids. aDue to product shortages, fifteen subjects were asked to repeat the second 4-week intervention arm or reschedule their second intervention to a later date. Six subjects declined to repeat the intervention. bSub-study refers to the subset of participants that collected fresh faecal samples for microbiota and bile acid analyses. mITT, modified intent to treat; PP, per protocol.
Table 1. Baseline demographics of study populations*
(Numbers and percentages)

mITT, modified intent to treat; BM, bowel movement.
* Data are expressed as n (%) unless otherwise stated.
The primary outcome was BM frequency (Fig. 3). There was no significant product*time interaction observed for number of BM/week in either studies (orange: P = 0·46, apple: P = 0·61). There tended (P = 0·052) to be an overall effect of product, with the OJ + P group having greater BM frequency than the OJ group in general. When analysed as a change in BM frequency from start of each intervention, there was no difference between arms at Week 3 (orange: P = 0·84, apple: P = 0·31) or Week 4 (orange: P = 0·20, apple: P = 0·88). In a subgroup analysis defined by baseline BM frequency (Fig. 3b and (d)), no effect of product*time interaction was observed in participants with ≤7 BM/week at baseline (orange: P = 0·45, apple: P = 0·93). In contrast, a significant product*time interaction for BM frequency was observed in the orange study in participants with >7 BM/week at baseline (P = 0·008), but not in the apple study (P = 0·69). Post hoc analysis did not reveal any significant differences between the orange arms at any individual time point. There were no differences (P > 0·05) observed in stool consistency (online Supplementary Table 5) or ease of passage (online Supplementary Table 6) between the arms in either study at any time point. There was an overall effect of product (P = 0·002) with the OJ arm exhibiting a greater proportion of subjects that had least 1 d with no BM/week, independent of time (online Supplementary Table 7).

Fig. 3. Bowel movement (BM) frequency in all subjects (a, c) and in subjects stratified by baseline BM frequency (b, d) consuming fruit juice or juice + pomace. Panels a and b represent orange arm data. Panels c and d represent apple arm data. Data are expressed as LS means ± sem and were analysed using a generalised linear mixed model assuming a Poisson distribution and a log link. A final model was selected with the backwards elimination method where test group was required to be retained in the model, n 84–89 per group in (a), n 54–59 and n 30–31 in (b), n 77–86 per group in (c), and n 50–55 and n 29–21 in (d).
At Week 3, there was no difference between apple arms in the odds of experiencing GI symptoms of any kind (online Supplementary Table 8); however, subjects in the OJ + P arm tended to have greater odds of experiencing GI symptoms of any kind than subjects in the OJ arm both at Week 3 (P = 0·092) and at Week 4 (P = 0·066), as indicated by the composite score (Table 2, online Supplementary Table 8). In the apple study, AJ + P arm tended (P = 0·089) to have greater odds of experiencing flatulence compared with the AJ arm at Week 4 only.
Table 2. Gastrointestinal tolerance questionnaire composite and component dichotomised scores for the mITT population during Week 4 of the intervention period*
(Numbers and percentages)

mITT, modified intent to treat; OJ, orange juice; OJ + P, orange juice + orange pomace; AJ, apple juice; AJ + P, apple juice + apple pomace.
* Data are from the end of period calculation (i.e. average of the last 3 d in Weeks 3 and 4) expressed as n (%), n 79–87.
† Score ≥1 represents at least mild issue and scores <1 represent less than mild issue.
‡ Due to the small number (≤ 6) of subjects reporting at least mild intensity for most components, statistical analysis was only performed for composite score, flatulence and burping.
Data were analysed with a generalised linear mixed model fit to a binary distribution with a logit link, and a final model was selected with the backwards elimination method where test group was required to be retained in the model.
Values with different superscripts (x,y) tended to be different from one another (P < 0·10).
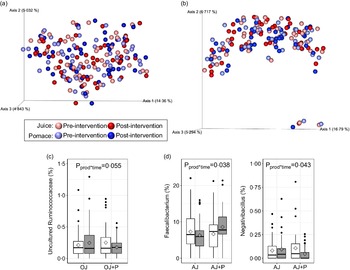
The faecal microbiota was assessed using α- and β-diversity metrics, relative abundances of individual genera, and targeted qPCR. No product*time interactions were observed for Faith’s PD (orange: P = 0·64, apple: P = 0·60), observed OTU (orange: P = 0·94, apple: P = 0·93) or Shannon’s index (orange: P = 0·63 apple: P = 0·44) metrics of α-diversity (online Supplementary Fig. 1(a) and (b)). Additionally, there were no differences in β-diversity, as measured by unweighted (Fig. 4(a) and (b)) and weighted (online Supplementary Fig. 1(c) and (d)) UniFrac distances. No differences (P > 0·05) in relative abundance were observed at the phylum level in either study. At the genus level, there tended to be a product*time interaction (P = 0·055) for the relative abundance of an uncultured genus of Ruminococcaceae, where the OJ arm exhibited a marginal increase from the start of intervention and the OJ + P arm exhibited a decrease from the start of intervention (Fig. 4(c)). In the apple study, relative abundance of Faecalibacterium increased (P = 0·038) and Negativibacillus decreased (P = 0·043) during the AJ + P intervention, whereas a marginal decrease or no change, respectively, was observed during AJ intervention alone (Fig. 4(d)). However, these effects were no longer significant following FDR correction. There were no other differences in relative abundance of individual genera. Targeted qPCR did not reveal any product*time interactions (P > 0·05) for the abundance of total bacteria (universal primer), Turicibacter, Streptococcus, E. coli, Blautia, Fusobacterium, Lactobacillus, Enterococcus, and C. scindens, or for the presence/absence of C. hiranonis in either study (online Supplementary Tables 9 and 10).

Fig. 4. β-diversity as measured by unweighted UniFrac distances in the orange (a) and apple (b) study arms, and differentially abundant genera in the orange (c) and apple (d) study arms. Data in (a) and (b) are presented as principal coordinate analysis plot where each sphere represents one sample, data were analysed using default parameters in QIIME 2.0. Diamonds in (c) and (d) represent means, data were analysed using a generalised linear mixed model assuming β-distribution and a logit link. n 49 per group, per time point in the orange arm and n 41 per group, per time point in the apple arm.
Changes in the concentration of total faecal BA and the proportion of fifteen BA species were analysed in faecal samples over the course of the studies. There was no product*time interaction observed for concentration (μmol/g stool, dry weight basis) of total BA (orange: P = 0·80, apple: P = 0·72); thus, individual BA species were analysed as a proportion of the total BA pool (online Supplementary Table 11). A product*time interaction was not observed for proportion of any of the individual BA species in each of the study arms (Tables 3 and 4). Additionally, no differences were observed when BA were grouped by primary v. secondary, conjugated v. unconjugated or glycine-conjugated v. taurine-conjugated.
Table 3. Proportions of faecal bile acid (BA) species and groups pre- and post-intervention*
(Mean values with their standard errors)

OJ, orange juice; OJ + P, orange juice + orange pomace; CA, cholic acid; GCA, glycocholic acid; TCA, taurocholic acid; CDCA, chenodeoxycholic acid; GCDCA, glycochenodeoxycholic acid; TCDCA, taurochenodeoxycholic acid; DCA, deoxycholic acid; GDCA, glycodeoxycholic acid; TDCA, taurodeoxycholic acid; LCA, lithocholic acid; GLCA, glycolithocholic acid; TLCA, taurolithocholic acid; UDCA, ursodeoxycholic acid; GUDCA, glycoursodeoxycholic acid; TUDCA, tauroursodeoxycholic acid.
* P-values for product*time interaction were determined using a generalised linear mixed model fit to a β-distribution with total dietary fibre intake as a fixed effect, and data are expressed as LS means ± sem, n 48–49.
Table 4. Proportions of faecal bile acid (BA) species and groups pre- and post-intervention*
(Mean values with their standard errors)
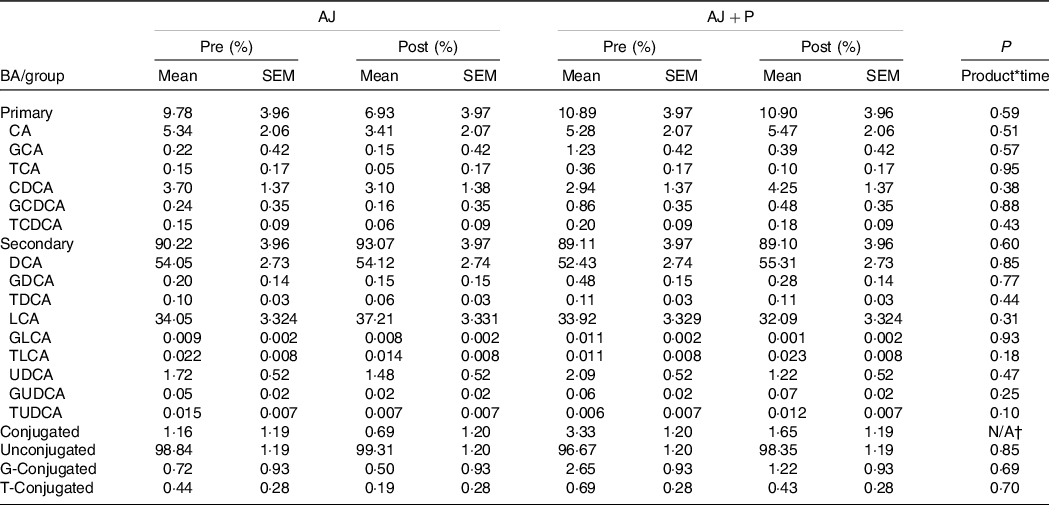
AJ, apple juice; AJ + P, apple juice + apple pomace; CA, cholic acid; GCA, glycocholic acid; TCA, taurocholic acid; CDCA, chenodeoxycholic acid; GCDCA, glycochenodeoxycholic acid; TCDCA, taurochenodeoxycholic acid; DCA, deoxycholic acid; GDCA, glycodeoxycholic acid; TDCA, taurodeoxycholic acid; LCA, lithocholic acid; GLCA, glycolithocholic acid; TLCA, taurolithocholic acid; UDCA, ursodeoxycholic acid; GUDCA, glycoursodeoxycholic acid; TUDCA, tauroursodeoxycholic.
* P-values for product*time interaction were determined using a generalised linear mixed model fit to a β-distribution with total dietary fibre intake as a fixed effect, and data are expressed as LS means ± sem, n 40.
† The model did not converge, and therefore a P-value was not estimated.
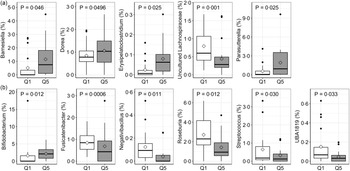
Due to the range and variability of TDF intake data within the study population, the relationship between pre-intervention (run-in and washout) TDF intake and both the microbiota community and faecal BA pool was investigated in each study. First, linear relationships between TDF intake and relative abundance of microbial phyla and genera was assessed using MaAsLin2. In the orange study, a significant linear association was observed for relative abundance of Erysipelatoclostridium, Ruminococcaceae UCG-014 and Parasutterella (Fig. 5(a)), whereas associations for Bifidobacterium, an uncultured genus of Lachnospiraceae, Lactococcus, Negativibacillus, Roseburia, Ruminococcus torques, Sellimonas, Slackia and UBA1819 were observed in the apple study (Fig. 5(b)). Highest and lowest TDF intake quintiles (Q5 and Q1) were also compared for differences in relative abundance of individual microbial genera and BA proportions. In the orange study, the TDF intake range of Q1 was 4·87–9·01 g/d and the range of Q5 was 21·11–40·47 g/d, whereas in the apple study, the TDF intake range of Q1 was 5·31–9·28 g/d and the range of Q5 was 19·84–30·83 g/d. A total of five genera differed between Q1 and Q5 in the orange study (Fig. 6(a)) – relative abundances of Barnsiella, Dorea, Erysipelatoclostridium and Parasutterella were greater in participants in Q5 than those in Q1, whereas the relative abundance of an uncultured genus of Lachnospiraceae was greater in participants in Q1 than those in Q5. Following FDR correction, no differences remained significant; however, the uncultured genus of Lachnospiraceae tended (q = 0·08) to be greater in participants in Q1. In the apple study, relative abundance of Bifidobacterium was greater in participants in Q5 than in Q1, whereas relative abundances of Fusicatenibacter, Negativibacillus, Roseburia, Streptococcus and UBA1819 were greater in participants in Q1 than in Q5 (Fig. 6(b)). Following FDR correction, no differences remained significant; however, Fusicatenibacter tended (q = 0·067) to be greater in participants in Q1. No differences in individual or grouped BA were observed between highest and lowest TDF quintiles in either study.

Fig. 5. Linear associations between baseline total dietary fibre (TDF) intake and microbial relative abundances in the orange (a) and apple (b) study arms. Data were analysed using MaAsLin2 and arcsine transformation. Data points represent arcsine transformed values. Grey areas represent 95 % CI, q-values represent FDR-corrected P-values, n 98 in (a) and n 82 in (b).

Fig. 6. Differentially abundant microbial genera between the highest and lowest quintiles of baseline total dietary fibre (TDF) intake in the orange (a) and apple (b) study arms. Significance was lost following FDR correction. Diamonds represent means, data were compared using a generalised linear mixed model assuming a β-distribution and logit link, n 20 per group in (a), n 17 per group in (b).
In the orange study, a total of twenty-seven mild or moderate adverse events and one severe event were reported by twenty-one subjects during the study. Of these, one (body weight gain, less than 5 % initial body weight) occurred after the completion of the OJ + P arm and was judged to be likely related to the study product. Three events (cramping, bloating and diarrhoea; all in one subject) occurred during the OJ + P intervention and were judged to be possibly related to the study product. All other adverse events reported by nineteen subjects were judged unlikely or not related to study product. In the apple study, a total of twenty-three mild or moderate adverse events were reported by seventeen subjects during the study. Of these, one (stomach uneasiness for 3 h after juice consumption) occurred during the AJ intervention and was judged to be definitely related to the study product. All other adverse events were judged unlikely or not related to study product.
Discussion
More than 40 years ago, Denis Burkitt hypothesised that deficiency in fibre intake may play an important role in the increased prevalence of many modern diseases, including diverticular disease, colon cancer, ulcerative colitis, CHD and obesity(Reference Burkitt32). In the years since, numerous studies have established a relationship between dietary fibre and many modern diseases(Reference O’Keefe33). Thus, it is important to identify novel dietary fibre interventions and determine the associated health benefits in humans. Additionally, it is necessary to understand the mechanisms by which dietary fibres elicit health benefits. Such mechanisms could include modification of the GI microbiota or BA pool. To our knowledge, these are the first randomised, placebo-controlled clinical trials to investigate the relationship between intake of novel orange and apple pomaces and both the faecal microbiota and BA pool.
Previously, enzyme-treated orange pomace (10 g/d fibre) was demonstrated to increase BM frequency by about 1 BM/week in healthy adults after 1–2 weeks of consumption and to marginally increase stool consistency scores (softer stool)(Reference Dennis-Wall, Burns and Solch14). In the present studies, OJ + P intervention appeared to increase BM frequency by about 0·5 BM/week after 1–2 week of intervention but did not reach statistical significance. Additionally, no differences were observed in BM frequency following AJ + P intervention. Compared with the previous trial(Reference Dennis-Wall, Burns and Solch14), subjects in the present study were, on average, approximately 20 years older (42–44 years v. about 23 years). However, baseline total energy and TDF intake were comparable between the two study populations. Interestingly, a product*time interaction was observed in subjects in the orange study arm with >7 BM/week at baseline, but not ≤7 BM/week in the present study. However, there were no differences between the groups at any individual time point. Results from smaller clinical trials testing pectin or other fruit fibre interventions corroborate our findings. In five adult men (baseline BM frequency of ≤7 BM/week), intervention with 0·5 g pectin/kg BW for 9 d did not influence BM frequency(Reference Fleming, Marthinsen and Kuhnlein34). Another study in five adult men (baseline BM frequency of 4·2 BM/week) also reported no effect of pectin on BM frequency or transit time at a dose of 36 g/d(Reference Cummings, Southgate and Branch35). Wallace et al. demonstrated that intervention with 7·5 g/d of apple fibre mixed in fruit juice did not influence BM frequency; however, baseline frequency was not reported and sample size was small (n 10)(Reference Wallace, Eady and Hunter36). Even in adequately powered clinical trials, it may be difficult to elicit changes in BM frequency or stool consistency with increased consumption of dietary fibre in individuals with normal bowel habits. On the other hand, intervention with chicory inulin, another fermentable fibre, at 12 g/d for 4 weeks increased BM frequency in constipated but otherwise healthy adults(Reference Micka, Siepelmeyer and Holz37). Future studies testing fruit fibres may benefit from specifically considering subjects with reduced BM frequency or clinical constipation.
Overall, intervention with both orange and apple pomaces were well tolerated as measured by assessment of eight GI symptoms. The OJ + P intervention only tended to cause a greater composite GI tolerance score at Week 3 and Week 4 compared with OJ, and the AJ + P intervention only tended to result in a greater incidence of flatulence at Week 4 compared to AJ. Though there were no significant differences in individual symptoms, the most commonly reported were burping and flatulence in both study arms. This is concurrent with previous findings following OJ + P(Reference Dennis-Wall, Burns and Solch14). The lack of significant bloating, cramping or flatulence suggests a more sustained microbial fermentation of the pomaces rather than proximal and rapid fermentation. Comparable doses of other fibres, such as inulin or short-chain fructo-oligosaccharides may be fermented more proximally as suggested by significant increases in individual and total GI intolerance symptoms(Reference Holscher, Doligale and Bauer38–Reference Bonnema, Kolberg and Thomas40). Additionally, Swanson et al. reported that apple, carrot, grape and tomato pomaces are less fermentable in vitro – as measured by organic matter disappearance, total gas production and SCFA production – compared with a citrus pectin control using faecal samples from canine donors(Reference Swanson, Grieshop and Clapper41). However, it is unclear if these pomaces were enzymatically treated prior to use.
In agreement with previous orange pomace intervention, OJ + P did not elicit any changes in faecal microbial α- or β-diversity metrics in this study. Unexpectedly, relative abundances of microbial taxa were also unaffected by both pomace interventions after correcting for multiple comparisons. Prior to FDR correction, only one genus tended to be differentially abundant between pre- and post-intervention in OJ + P compared with OJ only – an uncultured genus of Ruminococcaceae. Previously, five members of Ruminococcaceae were reported to have increased relative abundance following orange pomace intervention(Reference Dennis-Wall, Burns and Solch14), whereas in the present study, one member was demonstrated to decrease. While few human clinical trials have investigated the effects of citrus pectins on the GI microbiota, in mice, a diet containing citrus pectin (15 %) has been reported to decrease cecal relative abundance of the phylum Firmicutes compared with controls(Reference Shtriker, Hahn and Taieb42).
Similar to the orange study, intervention with apple pomace did not elicit any changes to faecal α- or β-diversity. However, two genera were differentially abundant between pre- and post-intervention of AJ + P compared with AJ prior to FDR correction – Faecalibacterium and Negativibacillus. Interestingly, Negativibacillus relative abundance decreased from baseline following AJ + P intervention and was also inversely correlated with baseline TDF intake in our cross-sectional analysis. In canines, an increase in relative abundance of Faecalibacterium was observed following consumption of a diet containing 9 % dried apple pomace(Reference de Brito, Menezes Souza and Bastos43). Faecalibacterium, one of the most abundant human gut microbes, is a known butyrate-producer and has been inversely associated with various GI disorders, suggesting potential application as a biomarker(Reference Lopez-Siles, Duncan and Garcia-Gil44).
Minor observed effects on the microbiota and conflicting results with previous trials may be in part due to variability in pre-intervention microbiota and/or fibre intake between study populations or within our own study population. Healey et al. reported that subjects habitually consuming a high-fibre diet (38·6 g/d) had a more robust microbial response to inulin-type fructan intervention compared with subjects habitually consuming a low-fibre diet (18·0 g/d)(Reference Healey, Murphy and Butts45). These findings suggest that habitual fibre intake may dictate responsiveness to fibre intervention and explain some of the difficulty in predicting outcomes. Previous intervention with orange pomace reported an average TDF intake of approximately 16 g/d at baseline, but a range was not described(Reference Dennis-Wall, Burns and Solch14). TDF intake in our sub-study populations averaged approximately 15–16 g/d, but ranged from 4·87 to 40·47 g/d and 5·31– to 30·83 g/d in orange and apple studies, respectively, with a large extent of intra-individual variation. Both within- and between-subject TDF intake variations may have confounded the effects of pomace intervention on microbial community composition and GI function outcomes.
In addition to the microbiota, dietary fibres are known to interact with and influence the BA pool(Reference Singh, Metrani and Shivanagoudra46). Alterations in faecal BA composition have been implicated in functional GI disorders due to their potent signalling capabilities and effects on water and mucus secretion(Reference Appleby and Walters19). However, no differences in total faecal BA concentrations, both on a DM basis or proportion of BA species and groups, were observed in either the orange study or apple study. In agreement with our findings, Ross et al. demonstrated that 15 g/d of citrus pectin did not alter faecal total BA concentrations on a DM basis in healthy men fed identical diets for 18 d(Reference Ross and Leklem47). Previous studies report no effect of pectin on proportion of faecal primary BA, but an increase in total daily faecal BA excretion(Reference Ross and Leklem47,Reference Miettinen and Tarpila48) . While those findings could be explained by an increase in total daily faecal output in the pectin groups compared with controls, no changes were observed. Cummings et al., however, reported an increase in both daily total faecal output and total faecal BA excretion following intervention with 36 g pectin/d(Reference Cummings, Southgate and Branch35). Additionally, rats fed a diet containing 5 % colloids from apple pomace extraction juices (about 8–10 % fibre by dry weight) resulted in total faecal excretion of BA and a reduction in secondary BA concentrations in Wistar rats(Reference Sembries, Dongowski and Mehrländer49). Future trials testing orange and/or apple pomace would benefit from assessing total faecal output and BA excretion in addition to BA pool composition.
Despite the apparent potential for some dietary fibres to influence both faecal microbiota and BA composition, the associations between habitual TDF intake and these outcomes remain largely uncharacterised in randomised, placebo-controlled clinical trials and often rely on dietary fibre intake data derived from FFQ rather than 3-d dietary records. In a sample of eighty-two adults, TDF intake derived from FFQ was not associated with microbial relative abundances; however, specific fibre groups were associated with odds of having higher relative abundances of certain microbial taxa. In particular, fruit and vegetable fibre intake was associated with Clostridia relative abundance, whereas bean fibre intake was associated with Actinobacteria relative abundance(Reference Dominianni, Sinha and Goedert50). Reddy et al. reported that women who switched from a Western-style diet to a high-fibre (37 g/d), largely plant-based diet for 26 d exhibited increased faecal deoxycholic acid, lithocholic acid and total BA concentrations compared with baseline(Reference Reddy, Engle and Simi51). Conversely, subjects habitually consuming <20 g fibre/d exhibited reduced faecal deoxycholic acid concentrations, but not total excretion, after transitioning to a diet with >30 g fibre/d(Reference Nagengast, van den Ban and Ploemen52). However, sample sizes in both of these studies were small (n 7 and n 12, respectively). Unlike Dominianni et al., we observed associations between TDF intake and a number of microbial taxa(Reference Dominianni, Sinha and Goedert50). Additionally, the observed associations were at the genus level as opposed to the phylum or class level. While clinical trials assessing short-term effects offer valuable information, characterisation of the relationships between habitual dietary fibre intake and GI microbiota and BA in larger, controlled trials paints a bigger picture. Our cross-sectional results add to this limited literature by describing potential relationships between habitual TDF intake and faecal microbiota and BA using pre-intervention data from our sub-study populations (orange: n 98 samples from n 49 subjects, apple: n 82 samples from n 41 subjects).
Strengths and limitations
The present studies were well designed (randomised, double-blinded, placebo-controlled), though a high degree of within- and between-subject variation in TDF intake may have confounded both primary and secondary outcomes. Additionally, though the study products exhibited similar appearance, participants may have been able to identify control v. experimental products based on differences in beverage consistency despite blinding. However, potential identification of intervention products likely did not influence objective physiological outcomes such as BM frequency (primary outcome), faecal microbiota and faecal BA. It is possible that there was an adaptive effect in faecal microbial and BA composition over the course of the interventions; however, stool samples were not collected until the intervention periods were complete.
Conclusions
Here, we have demonstrated that intervention of either orange pomace in OJ or apple pomace in AJ (both 10 g/d fibre), though well tolerated, did not have a robust impact on bowel habits, the faecal microbial community or faecal BA composition in healthy adults with self-reported normal bowel habits. Eliciting changes in BM characteristics in subjects with normal bowel habits may be difficult to achieve. Cross-sectional analysis from our own study identified several faecal microbial genera that were associated with habitual TDF intake. Future studies aiming to modulate BM habits or faecal microbiota and BA should consider both baseline BM frequency and habitual dietary fibre intake during recruitment and/or data analysis.
Acknowledgements
The authors would like to thank the Gastrointestinal Laboratory at Texas A&M University for performing targeted qPCR analysis. Views expressed in this manuscript are those of the authors and do not necessarily reflect the position or policy of PepsiCo, Inc.
This work was supported by PepsiCo Inc., Barrington, Illinois, USA. MB, TWB and KSS designed the study.
The authors’ contributions are as follows: M. B., T. W. B., and K. S. S. formulated the research questions and designed the study, C. A., K. D. S., T. M. B., G. N. M., E. M., K. K. G., O. C., D. J. L. and J. E. S. organised the study and carried out the measurements, C. A., K. D. S., and T. M. B. analysed the data, and C. A. drafted the manuscript. All authors contributed to the discussion and approved the final manuscript.
C. A., K. D. S., T. M. B., G. N. M., E. M., K. K. G., O. C. and D. J. L. conducted the study and analyses. C. A. and T. M. B. performed statistical analyses. C. A. wrote the manuscript. All authors edited and approved the final manuscript.
C. A., G. N. M. and K. S. S. report no conflicts of interest. C. A. is now employed at the Department of Microbiology and Immunology, University of Michigan Medical School, Ann Arbor, MI 48109. T. W. B., M. B. and J. E. S. are employed by PepsiCo, Inc. K. D. S., T. M. B., E. M., K. K. G., O. C. and D. J. L. are employees of Biofortis Research, Merieux NutriSciences and report no other competing conflicts of interest. The sponsors contributed to the design of the study but did not influence the collection, analyses, or interpretation of data, the writing of the manuscript, or the decision to publish the results.
Supplementary material
For supplementary material/s referred to in this article, please visit https://doi.org/10.1017/S0007114522002951