

The chronic blood pressure (BP)-lowering effects of n-3 long-chain PUFA (LCP), primarily of EPA (20 : 5n-3) plus DHA (22 : 6n-3) supplementation, are well established(Reference Geleijnse, Giltay and Grobbee1), with DHA possibly being the main contributor to this effect(Reference Mori, Bao and Burke2, Reference Mori and Woodman3). Evidence to date suggests that the effect is a result of a decrease in systemic vascular resistance (SVR) rather than in cardiac output(Reference Demaison, Blet and Sergiel4, Reference Mozaffarian, Gottdiener and Siscovick5). Possible mechanisms for this effect include increased NO bioavailability, changes in endothelium-derived hyperpolarising factor (EDHF) and altered eicosanoid profiles(Reference Li, Zhang and Wang6–Reference Matsumoto, Nakayama and Ishida10).
Relatively few studies have investigated the acute effects on vascular function of meals rich in EPA and DHA. There is some evidence for a positive effect of EPA and DHA on endothelial and vascular function when added to high-fat meals(Reference West, Hecker and Mustad11–Reference Newens, Thompson and Jackson14). Improvements in arterial stiffness have been reported following meals enriched with 4·7 g EPA(Reference Hall, Sanders and Sanders15) or a mixture of 4·7 g EPA and DHA(Reference Chong, Lockyer and Saunders16). However, there have been no systematic comparisons between EPA- and DHA-rich meals.
Sympathetic nerve activity increases in response to exercise to facilitate increases in BP. However, sympathetic vasoconstriction is attenuated in the exercising skeletal muscle vasculature, with NO, PG and a cytochrome P450-derived product (possibly involved in the EDHF-mediated response) being partially responsible for exercise hyperaemia(Reference Hillig, Krustrup and Fleming17, Reference Dinenno and Joyner18) and the exercise-induced reduction in SVR(Reference Boushel, Langberg and Gemmer19). Impaired endothelial function and exercise-induced vasodilation have been associated with an exaggerated BP response to exercise(Reference Stewart, Sung and Silber20, Reference Wilson, Sung and Pincomb21), which may contribute to the development of future hypertension and its complications(Reference Singh, Larson and Manolio22, Reference Brett, Ritter and Chowienczyk23). The acute effects of EPA and/or DHA on cardiovascular haemodynamics in response to dynamic exercise are currently uncertain. We hypothesised that meals containing n-3 LCP, EPA or DHA would improve exercise-induced vasodilation, as indicated by a decrease in exercise SVR, and attenuate the increase in exercise BP.
Subjects and methods
Participants and screening procedure
Healthy men, aged 18–45 years, were recruited from staff and students of King's College London (London, UK). Exclusion criteria were as follows: current smoking habit; consumption of more than one portion of oily fish per week and/or regular fish oil supplementation within the past 3 months; BMI ≤ 18·0 or ≥ 30 kg/m2; BP ≥ 140/90 mmHg; plasma total cholesterol >7·8 mmol/l; plasma TAG >3·0 mmol/l; diabetes mellitus (fasting plasma glucose >7·0 mmol/l); abnormal haematology or liver function tests; self-reported history of myocardial infarction, angina, venous thrombosis, stroke, cancer, presence of gastrointestinal disorder; self-reported weekly alcohol intake of >28 standard units of alcohol (1 unit = 10 ml ethanol); systematic use of any medication. The study was conducted according to the guidelines laid down in the Declaration of Helsinki and all procedures involving human subjects were approved by the National Research Ethics Service (07/H0809/54). Participants were given a detailed outline of the study requirements and all provided written informed consent. The trial was registered at clinicaltrials.gov as ISRCTN62232400.
Body weight, BP, fasting plasma lipoprotein lipid concentrations, glucose, haematology and liver function were confirmed to be within the prescribed limits before entry into the study as described previously(Reference Rontoyanni, Chowienczyk and Sanders24). To identify and exclude those with a high consumption of oily fish, a short FFQ was used, which consisted of fifteen questions related to fish consumption. Waist circumference was measured to the nearest 0·1 cm using a plastic tape measure and percentage of body fat was estimated using bioelectrical impedance (model: BC-418 MA; Tanita UK Limited, Middlesex, UK). In order to ensure that participants were suitable to undertake the exercise test, VO2max, an index of cardiorespiratory fitness, was estimated using the Astrand-Rhyming cycle ergometer test, nomogram and age correction factor(Reference Astrand and Ryhming25, Reference Astrand26), as detailed elsewhere(Reference Rontoyanni, Chowienczyk and Sanders24).
Experimental design
A single-blind, randomised, cross-over study design was undertaken to test the effects of high-fat meals (50 g total fat) containing high-oleic sunflower oil enriched with 4·7 g of either EPA or DHA, compared with control (high-oleic sunflower oil only). Subjects were allocated to one of six treatment sequences in random order (ABC, ACB, BAC, BCA, CAB, CBA – orthogonal Latin square design). Each study day lasted for approximately 8 h and study days were separated by at least 1 week during which subjects were instructed to avoid fish consumption, especially oily fish. On the day before the test meal, subjects were asked to avoid alcohol, fish intake, foods high in fat, caffeine from midday and to refrain from vigorous exercise, and they were provided with a standardised low-fat dinner ( ≤ 10 g fat) for their evening meal. They were further asked to fast from 22.00 hours the previous night, avoiding everything apart from water and to refrain from exercise in the morning of the study.
Participants attended the metabolic research unit between 08.00 and 11.00 hours, weight was measured and percentage of body fat was estimated. Following a 20 min quiet, seated rest period, measurements of BP, heart rate (HR) and cardiac output were made in duplicate and a fasting venous blood sample was obtained for the measurement of plasma lipids, glucose and 8-isoprostane-F2α (8-iso-PGF2α). Participants then consumed the high-oleic acid test meal (either EPA, DHA or control) within 10 min. Further seated measurements of BP, HR and cardiac output were repeated 1, 2, 3 and 5 h postprandially. Between measurements, participants rested quietly in living room areas of the research unit, where they could read or use a laptop computer. A further venous blood sample was obtained at 5 h following the meal, followed by a 12 min multi-stage exercise stress test of moderate intensity on a programmable electrically braked cycle ergometer, which has previously been used in similar study protocols(Reference Brett, Ritter and Chowienczyk23, Reference Rontoyanni, Chowienczyk and Sanders24, Reference Brett, Jiang and Turner27). Workload increased by 25 W in 3 min intervals, starting at 25 W and pedalling frequency was kept constant at 60 rpm. During exercise, further measurements of BP, HR and cardiac output were determined at 3, 6, 9 and 12 min. Immediately post-exercise, a further venous blood sample was collected. Then, the subjects were allowed to recover seated and further measurements of BP, HR and cardiac output were determined at 15, 30 and 45 min post-exercise. An outline of the study protocol is shown in Fig. 1.

Fig. 1 Outline of the study days. BP, blood pressure; HR, heart rate; CO, cardiac output.
Formulation of the test meals
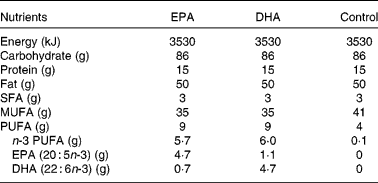
The test meals were matched for volume, energy, total fat, protein and carbohydrate content, consisted of a muffin and a milkshake and were similar, except for the type of fat, to those described previously(Reference Rontoyanni, Chowienczyk and Sanders24). The oil in the control meal was provided by high-oleic sunflower oil (Archer Daniel Mills Limited, Erith, Kent, UK) and the oil in the EPA and DHA-rich meals was formulated by blending 42 g high-oleic sunflower oil with 8 g of the respective concentrate (Incromega EPA 500TG SR and Incromega DHA 500TG SR; Croda Chemicals Europe Limited, Goole, UK). Fatty acid analyses of the test fats were performed and the nutrient content of the test meals were estimated as described previously(Reference Rontoyanni, Chowienczyk and Sanders24). The nutrient composition of the test meals is shown in Table 1.
Table 1 Nutrient composition of the test meals
Haemodynamic measurements
A single trained investigator (V. G. R.) conducted all measurements with the subject relaxing in an upright, seated position in a quiet and temperature-controlled (23°C) room. Cardiac output was measured non-invasively using an inert gas rebreathing device (InnoCor™; Innovision A/S, Odense, Denmark). A finger arterial BP monitor, the Finometer™ Model-1 (Finapres Medical Systems BV, Amsterdam ZO, The Netherlands), was used to measure systolic and diastolic BP, mean arterial pressure (MAP) and HR on a beat-to-beat basis. The Finometer offers continuous monitoring of the finger arterial pressure waveform and has been shown to provide reliable data during exercise(Reference Gizdulich, Imholz and van den Meiracker28). Application of corrective measures, such as waveform filtering and level correction, a height correction system and arm-cuff return-to-flow calibration provides accurate BP measurement(Reference Imholz, Wieling and van Montfrans29). The finger cuff was applied on the index finger of the left hand and the arm cuff wrapped around the left arm. Values for BP, MAP and HR represent means for 30 s epochs for resting and post-exercise measures and means for 5–15 s epochs during exercise, all recorded immediately before each cardiac output rebreathing manoeuvre to avoid overestimation due to forced rebreathing. Stroke volume was calculated from cardiac output divided by HR values. SVR was estimated from MAP divided by cardiac output.
Blood sample collection, handling and analysis
Venous blood samples were collected into evacuated tubes with minimal compression necessary to display the vein. Blood for the analysis of 8-iso-PGF2α was collected into pre-chilled 4·5 ml tubes (catalogue no. 369714; Becton Dickinson, Plymouth, Devon, UK) containing 0·5 ml trisodium citrate (0·105 mol/l) and processed as described previously(Reference Rontoyanni, Chowienczyk and Sanders24), and the samples were stored at − 80°C until analysis by GC/negative chemical ionisation MS, as detailed elsewhere(Reference Hall, Sanders and Sanders15). Blood for plasma total fatty acids, TAG and NEFA was collected into 6 ml EDTA-containing tubes (catalogue no. 367863; Becton Dickinson) and for plasma glucose into a 4 ml fluoride/oxalate tube (catalogue no. 367922; Becton Dickinson). Blood was then centrifuged at 2400 g for 15 min at 2–4°C and plasma samples were stored at − 40°C until analysis. Plasma TAG, NEFA and glucose were measured on an automated chemistry analyser (ILAB-650; Instrumentation Laboratory, Warrington, Cheshire, UK) using colorimetric assays (TAG and glucose: catalogue no. 0018255640 and catalogue no. 00018250740, Instrumentation Laboratory; NEFA C: catalogue no. 999-75 406, Wako Chemicals GmbH, Neuss, Germany). Plasma total fatty acids were analysed by GLC as described previously(Reference Rosell, Lloyd-Wright and Appleby30).
Statistical analysis
Sample size calculations were based on a within-subject standard deviation of 1·09 litres/min and a correlation coefficient of 0·88 for cardiac output and a within-subject standard deviation of differences of 4·9 mmHg for diastolic BP; these gave 80 % power at P < 0·05 for a sample size of twenty-two subjects to detect a 0·32 litres/min and 3·1 mmHg change in cardiac output and diastolic BP, respectively. Data were log-transformed for plasma TAG and 8-iso-PGF2α before analysis. Incremental area under the curve was calculated using the trapezoid rule. Data were analysed using repeated-measures ANOVA in SPSS (version 17.0; SPSS Inc., Chicago, IL, USA), with meal and time as within-subject factors. The Greenhouse–Geisser correction for sphericity was employed. Specific comparisons between the treatments were adjusted using the Bonferroni correction factor when there was a significant meal effect or meal × time interaction effect. Differences were considered significant at P < 0·05. Results are presented as means and 95 % CI, unless otherwise specified.
Results
Of the thirty-eight subjects who were screened, twenty-four were enrolled in the study and data of twenty-two subjects were finally available for analysis, whose details are presented in Table 2. A CONSORT (Consolidated Standards of Reporting Trials) flow chart of the study participants (Fig. 2) is provided.
Table 2 Details of the male participants
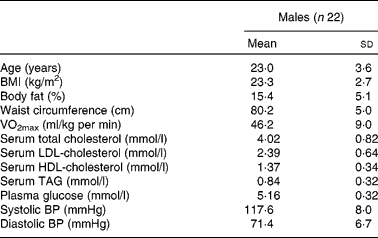
BP, blood pressure.

Fig. 2 CONSORT (Consolidated Standards of Reporting Trials) flow chart of the study participants. BP, blood pressure; SVR, systemic vascular resistance.
Plasma fatty acid, TAG, NEFA, glucose and 8-isoprostane-F2α concentrations
At 5 h following the EPA- and DHA-rich test meals, plasma EPA and DHA concentrations increased above fasting values by 321 and 131 %, respectively, and were significantly different from the control (P < 0·001). There were no significant differences between the meals in plasma TAG, NEFA, glucose and 8-iso-PGF2α concentrations 5 h following the test meals or immediately post-exercise (Table 3). However, average plasma TAG and NEFA concentrations were higher than fasting values 5 h following all test meals by 82 and 73 %, respectively (P < 0·001). Plasma 8-iso-PGF2α concentrations were higher than fasting values 5 h following the test meals and immediately post-exercise (overall effect, P < 0·001).
Table 3 Changes in plasma EPA, DHA and oleic acid concentrations (n 22), plasma TAG, NEFA, glucose and 8-isoprostane-F2α (8-iso-PGF2α; n 21) after the EPA, DHA and control meals from fasting (0 h) at 5 h and immediately post-exercise
(Mean values and 95 % confidence intervals)

a,b,c Mean values within a column with unlike superscript letters were significantly different (P < 0·001; Bonferroni's multiple comparison test).
d,e,f Mean values within a column with unlike superscript letters were significantly different (P < 0·01; Bonferroni's multiple comparison test).
* Repeated-measures ANOVA of the changes at 5 h and immediately post-exercise from fasting (0 h): P < 0·001, meal effect.
† Repeated-measures ANOVA of the changes at 5 h and immediately post-exercise from fasting (0 h): P = 0·01, meal × time effect.
‡ Repeated-measures ANOVA of the changes at 5 h and immediately post-exercise from fasting (0 h): P = 0·066, meal effect.
§ Geometric mean.
Cardiovascular haemodynamics
Fasting cardiac output, stroke volume and HR were on average 5·6 (95 % CI 5·3, 6·0) litres/min, 87·6 (95 % CI 80·1, 95·1) ml and 65·4 (95 % CI 62·3, 68·6) beats/min, respectively. Fasting systolic BP, diastolic BP, MAP and SVR were on average 116·2 (95 % CI 114·2, 118·2) mmHg, 71·8 (95 % CI 69·5, 74·2) mmHg, 88·5 (95 % CI 86·4, 90·5) mmHg and 16·1 (95 % CI 15·1, 17·2) Wood units, respectively. Fig. 3 shows the changes in (a, b) systolic and diastolic BP, (c) HR and (d) cardiac output following the meals at rest and during exercise. Resting measures of BP and cardiac output did not significantly differ between the meals. There was a sustained increase in systolic BP over 5 h following the meals. Exercise resulted in a marked increase in systolic and diastolic BP, and there were statistically significant meal × time interactions for the changes from 5 h in diastolic BP (P = 0·007) and MAP (P = 0·008) during exercise.

Fig. 3 Changes in (a) systolic blood pressure (BP; n 19), (b) diastolic BP (n 19), (c) heart rate (n 22) and (d) cardiac output (n 22) after the EPA (□), DHA (●) and control (Δ) meals from fasting (0 h) over a 5 h rest and during 12 min exercise in healthy men. Values are means, with their standard errors represented by vertical bars. Repeated-measures ANOVA of 5 h and 25, 50, 75, 100 W exercise values: (a) meal effect, P = 0·020; (b) meal effect, P < 0·001, meal × time effect, P = 0·049; (c) meal and meal × time effect, NS; (d) meal × time effect, P = 0·045; (a–d) time effect, P < 0·001. (a) DHA v. control, P < 0·025; (b) DHA v. control, P < 0·001; EPA v. DHA, P < 0·025 (applied Bonferroni correction for three comparisons). Analysis of the changes from 5 h showed a significant meal × time effect (P = 0·007) only for diastolic BP.
The test meals caused similar sustained increases in cardiac output over the 5 h resting postprandial period (at 5 h: 0·4 (95 % CI 0·1, 0·8) litres/min; P = 0·017) due to an effect mainly in stroke volume (P < 0·001; data not shown). Exercise resulted in distinct increases in HR, with no differences between the meals, while for the increase in exercise cardiac output, there was a significant meal × time interaction effect (P = 0·045) for a comparison of the 5 h and 25, 50, 75 and 100 W exercise values, but this became non-significant when the changes from the 5 h were compared. Fig. 4 shows mean SVR values 5 h postprandially and during exercise. Repeated-measures ANOVA of the 5 h, 25, 50, 75 and 100 W values for SVR showed a significant meal effect (P = 0·003), with lower values after the DHA meal compared with the control meal by 0·57 (95 % CI 0·16, 0·99) Wood units (P < 0·01). Repeated-measures analysis of the changes in SVR from the 5 h resting value did not reveal any significant meal effect or meal × time interaction effect. At 15 min post-exercise, all haemodynamic variables were close to the pre-exercise and fasting values after all meals, with no significant differences observed between the meals. No other significant differences were observed.

Fig. 4 Systemic vascular resistance (SVR) at 5 h of rest and during 12 min exercise after the EPA (□), DHA (●) and control (Δ) meals in healthy men (n 19). Values are means, with their standard errors represented by vertical bars. Repeated-measures ANOVA of 5 h and 25, 50, 75, 100 W exercise values: meal effect, P = 0·003; meal × time effect, NS; time effect, P < 0·001. DHA v. control, P < 0·01 (applied Bonferroni correction for three comparisons). Analysis of the changes from 5 h showed no significant meal effect or meal × time interaction effect.
Discussion
To our knowledge, this is the first study to investigate the acute effects of a single dose of EPA or DHA on haemodynamics at rest and in response to exercise. The decision to provide 4·7 g EPA or DHA was based on earlier reports showing their beneficial effects on vascular tone with such intakes(Reference West, Hecker and Mustad11, Reference Armah, Jackson and Doman12, Reference Hall, Sanders and Sanders15, Reference Chong, Lockyer and Saunders16), equivalent to 200–400 g oily fish, depending on the type of fish consumed(Reference Simopoulos31). In a previous report(Reference Rontoyanni, Chowienczyk and Sanders24), cardiac output was shown to increase following meals primarily due to an increase in stroke volume, as observed in the present study. It has also been demonstrated that exercise-induced changes in cardiac output and HR measured 3 h following a high-fat meal of similar composition to the control meal used in the present study did not differ from those after a low-fat, high-carbohydrate meal(Reference Rontoyanni, Chowienczyk and Sanders24). In the present study, measurements were made in response to exercise 5 h after test meal consumption to correspond with the time of peak plasma concentrations of n-3 LCP(Reference Hall, Sanders and Sanders15); plasma EPA and DHA concentrations were 321 and 131 % greater than fasting values at 5 h following the EPA- and DHA-rich meals, respectively. There were no differences in cardiac output between the treatments. However, the DHA- but not EPA-rich meal v. control led to an attenuated increase in MAP at 5 h and during exercise. Calculation of SVR (MAP/cardiac output) suggests that the DHA-rich meal promoted vasodilation.
A number of mechanisms have been proposed for exercise vasodilation in response to n-3 LCP. Evidence from chronic studies suggests(Reference Monahan, Wilson and Ray32) that it might be via the action of locally produced factors whereby EPA and DHA attenuate noradrenaline-induced forearm vasoconstriction(Reference Chin, Gust and Nestel33, Reference Mori, Watts and Burke34) and enhance dilatation and blood flow to contracting skeletal muscle(Reference Walser, Giordano and Stebbins35). These local factors may include increased NO bioavailability(Reference Li, Zhang and Wang6, Reference Li, Zhang and Wang7), increased PGI2 and PGI3 production(Reference Abeywardena, Fischer and Schweer8, Reference DeCaterina, Giannessi and Mazzone9), and changes in EDHF(Reference Matsumoto, Nakayama and Ishida10). Since these endothelium-derived relaxing factors are also involved in exercise hyperaemia and the exercise-induced reduction in SVR(Reference Hillig, Krustrup and Fleming17–Reference Boushel, Langberg and Gemmer19), their action might be enhanced by increases in their levels following the intake of n-3 LCP.
Plasma 8-iso-PGF2α concentration was measured as an index of lipid peroxidation. The increase in 8-iso-PGF2α following the high-fat meals is in agreement with previous reports(Reference Hall, Sanders and Sanders15, Reference Rontoyanni, Chowienczyk and Sanders24, Reference Berry, Tucker and Banerji36). This is in contrast to meals high in carbohydrate where plasma 8-iso-PGF2α concentrations fall postprandially(Reference Rontoyanni, Chowienczyk and Sanders24). A limitation of the present study is that the assay used in the study was specific for measuring 8-iso-PGF2α, the peroxidation product of arachidonic acid, and would not have detected any isoprostane metabolites derived from EPA or DHA which might exert physiological effects on the vascular system(Reference Gao, Yin and Milne37).
Changes in exercise postprandial haemodynamic responses may be of greater physiological significance in relation to the risk of cardiovascular events than fasting resting measures. Supplementation with n-3 LCP for 5–12 weeks has been reported to reduce HR during exercise and improve HR variability during exercise in healthy athletes and overweight adults with CVD risk factors(Reference Buckley, Burgess and Murphy38–Reference Peoples, McLennan and Howe40) and enhance stroke volume and cardiac output responses to exercise in healthy adults(Reference Walser and Stebbins41). However, a recent randomised controlled trial(Reference Sanders, Hall and Maniou42) in 312 adults aged 45–70 years found no effect on resting HR or 24 h ambulatory BP of supplementation with n-3 LCP up to 1·8 g/d, which was supplied mainly as EPA rather than DHA.
In conclusion, the present study shows no effect of an EPA- or DHA-rich meal on cardiac output or stroke volume and provides tentative evidence for a vasodilator effect occurring 5 h following a high intake of DHA that appeared to be sustained during exercise.
Acknowledgements
This study was supported by the State Scholarships Foundation (I.K.Y.), Greece. The authors acknowledge financial support from the Department of Health via the National Institute for Health Research comprehensive Biomedical Research Centre award to Guy's and St Thomas’ NHS Foundation Trust in partnership with King's College London. We thank Croda Chemicals Europe Limited, who donated the EPA-enriched oil (Incromega EPA 500TG SR) and DHA-enriched oil (Incromega DHA 500TG SR) used in the study. V. G. R. contributed to the design of the study, conducted the research (including cardiovascular measurements, phlebotomy, plasma 8-iso-PGF2α and glucose analysis), statistically analysed and interpreted the data, and wrote the manuscript; W. L. H. contributed to the design of the study and test meal composition, and made critical revisions of the manuscript; S. P.-R., A. A. and R. C. participated in subject recruitment, assisted in data collection, and performed blood handling, TAG and NEFA analysis; S. P.-R. performed the plasma fatty acid analyses; T. A. B. S. conceived the hypothesis and contributed to the design of the study, contributed to data interpretation and made critical revisions to the manuscript. All authors read and approved the final version of the manuscript. The funders played no part in the study design, the collection or analysis of the data, the writing of the report or the decision to submit for publication. All authors are independent of the funders. The authors declare that they have no conflict of interest.


