


The prevalence of childhood obesity has increased exponentially over the last three decades, having almost tripled in Canadian youth( Reference Shields 1 ). There is growing evidence to suggest that impaired fasting glucose (IFG) and impaired glucose tolerance (IGT) are also on the rise in North American children and adolescents( Reference Li, Ford and Zhao 2 ). Furthermore, the prevalence of these pre-diabetic states is particularly high in obese youth( Reference Sinha, Fisch and Teague 3 , Reference Lambert, Delvin and Levy 4 ). The high prevalence of abnormal glucose homeostasis in this population suggests that IFG and IGT probably represent a significant health burden in Canadian youth.
There is extensive evidence showing that lifestyle modifications prevent or delay the transition from IFG/IGT to type 2 diabetes (T2D) mellitus in adults. In the Diabetes Prevention Program study, intensive lifestyle interventions that included physical activity and dietary modifications decreased the rate of progression from abnormal glucose homeostasis to frank T2D by 58 %( Reference Knowler, Barrett-Connor and Fowler 5 ). Studies on the association between dietary macronutrients and insulin sensitivity (IS) and insulin secretion in youth, however, is sparse and largely inconclusive. Lindquist et al.( Reference Lindquist, Gower and Goran 6 ) found that dietary fat was not independently associated with IS or insulin secretion in ninety-five pre-pubertal/early pubertal African-American and white children. Conversely, Arslanian and colleagues found that a higher fat:carbohydrate ratio was associated with lower IS in forty-four pre-pubertal children (twenty-two African-American and twenty-two white)( Reference Arslanian, Saad and Lewy 7 ). These studies focused on relatively small samples of children and did not account for other lifestyle habits that might act as confounders.
Similarly, the limited data considering protein intake and insulin dynamics in childhood have led to conflicting conclusions. Two studies on milk consumption in relation to IS and insulin secretion have drawn opposite conclusions concerning their association( Reference Hoppe, Molgaard and Vaag 8 , Reference Hirschler, Oestreicher and Beccaria 9 ). Hoppe et al. ( Reference Hoppe, Molgaard and Vaag 8 ) also found that the addition of meat to children's diet led to unchanged IS and increased β-cell function. These studies, however, did not account for total protein intake, considered exposure over a short time frame and were conducted on relatively small sample sizes.
In the same way, data obtained from studies examining associations between dietary carbohydrate and insulin dynamics in youth are conflicting, and these studies assessed the acute effects of these diets in randomised trials on very small sample sizes, with exposure being over a short period of time (maximum 12 weeks). Sunehag et al. ( Reference Sunehag, Toffolo and Treuth 10 ) examined the effect of high-carbohydrate/low-fat diets in a sample of thirty-six healthy, non-obese pre-pubertal and adolescent youth for a 7 d period. They found that in these children, high-carbohydrate diets were not associated with any changes in IS in the pre-pubertal youth, but associated with improved IS in the adolescent group. Furthermore, pancreatic β-cell insulin secretion remained unchanged in both the pubertal and pre-pubertal youth. Davis et al. ( Reference Davis, Ventura and Shaibi 11 ) examined the association between carbohydrate and adiposity and insulin dynamics in a cohort of 120 obese Latino youth (mean age 14·1 years) with a family history of T2D. They found that total dietary sugar intake was inversely related to IS and insulin secretion, independent of sex, sexual maturation, total energy intake, body composition and non-carbohydrate macronutrient intake.
Studies examining chronic dietary exposures, in large numbers of youth, taking into consideration other lifestyle habits are lacking. The objectives of the present study were to determine the associations of macronutrient intake with insulin and glucose dynamics in children, taking into consideration physical activity, fitness and sedentary behaviour. Understanding dietary influences on glucose homeostasis will be useful for clinical practice and public health management if they are studied within the context of overall lifestyle habits and how these habits interact.
Methods
Participants of the QUebec Adipose and Lifestyle InvesTigation in Youth (QUALITY) cohort were studied using the baseline evaluation for the present study( Reference Lambert, Van Hulst and O'Loughlin 12 ). QUALITY is an ongoing longitudinal study of Caucasian youth aged 8–10 years at risk of obesity and its metabolic consequences because of a history of obesity in one or both biological parents. Parental obesity was defined as a BMI >30 kg/m2 or an elevated waist circumference (>102 cm in males and >88 cm in females( Reference Grundy, Cleeman and Daniels 13 )). Children with a history of type 1 diabetes or T2D were considered ineligible.
The recruitment process and study design have been extensively described elsewhere( Reference Lambert, Van Hulst and O'Loughlin 12 ). Briefly, children in third, fourth and fifth grades from elementary schools located in the proximity of three major urban centres in the province of Quebec (Canada) were approached to participate in the study. Data on 630 families were available for the present study. All the participants underwent the following assessments: blood sample assessment; anthropometric measurements; sexual maturity stage assessment; lifestyle habit assessment using questionnaires; physical activity measurements using accelerometers. The present study was conducted according to the guidelines laid down in the Declaration of Helsinki, and all procedures involving human participants were approved by the Ethics Boards of the Centre Hospitalier Universitaire Sainte-Justine, McGill University and Université Laval. Written informed assent and consent were obtained from all the participants and their parents, respectively.
Dietary intake was assessed using three non-consecutive 24 h dietary recalls completed by a dietitian with a child (with help from a parent where needed) on different days of the week including one weekend day. To minimise the response burden on families, the recalls were conducted by telephone with each participant using small disposable kits containing food portion models (e.g. graduated cup and bowl), which the participant received before the interview. During the clinical visit, the participants were given a short training session on the use of the kits. Outliers in the analysis of the distribution of each nutrient were examined. Records of intakes with very high or low values of a nutrient were examined for any data entry mistakes (e.g. a whole pie was entered when a slice of pie of a certain dimension was noted as consumed by the child). The recalls were done by dietitians, and children reporting unreasonable intakes were questioned further to ascertain their intake. In the analyses, no high or low values were excluded.
The dietary data were entered into a program that uses the 2007 version of the Canadian Nutrient File. The nutrient analysis program (CANDAT; Godin and Assoc, London, ON) provided daily nutrient intake data, including the participant's total daily intake of carbohydrate, protein, and saturated and unsaturated fat. The calculated average daily percentage of energy from dietary fat, protein and carbohydrate was used, as well as total fibre and energy intake. In terms of foods, measures of sugar-sweetened beverages (SSB, in ml) and portions of fruits and vegetables were also calculated. SSB included soft drinks, sports drinks and fruit drinks, but not chocolate milk and 100 % fruit juices.
Physical activity was assessed using an Actigraph LS 7164 activity monitor (Actigraph LLC). Valid wear time was considered to be a minimum of 10 h/d. Non-wear time was defined as any period of 60 min or more of zero counts, accepting 1 min or two consecutive minutes where count values were >0 and ≤ 100( Reference Troiano, Berrigan and Dodd 14 ). Moderate-to-vigorous physical activity (MVPA) was computed by adding the total minutes spent daily on moderate and vigorous physical activities and averaging over the total number of valid days of wear( Reference Evenson, Catellier and Gill 15 , Reference Trost, Loprinzi and Moore 16 ). Fitness was estimated using peak VO2, the gold standard for measuring aerobic fitness in youth. VO2 peak was determined during an adapted standard incremental exercise test( Reference Skinner 17 ), on an electromagnetic bicycle, to volitional exhaustion with indirect calorimetric measurements throughout the test. Attainment of at least one of the following two criteria was required to consider VO2 peak as a true maximum value: (1) a RER (VCO2/VO2) of or greater than 1·0 and (2) a heart rate of or above 185 beats per min( Reference Docherty 18 ). VO2 peak is expressed in ml/kg of lean body mass per·min. Screen time (ST) was assessed using an interviewer-administered questionnaire, documenting self-reported habitual daily hours spent on television viewing and leisure computer/video game use. There were separate questions addressing weekday and weekend ST. From these questions, we calculated the average daily hours of leisure ST.
All the participants underwent a 2 h oral glucose tolerance test (OGTT) following a 12 h overnight fast. Blood samples were collected in tubes containing 1 g K2EDTA/l 30, 60, 90 and 120 min after consumption of an oral glucose dose of 1·75 g/kg body weight (to a maximum of 75 g). Plasma insulin concentrations were measured using the ultrasensitive Access® immunoassay system (Beckman Coulter, Inc.), which has no cross-reactivity with proinsulin or C-peptide( Reference Allard, Delvin and Paradis 19 ). Plasma glucose concentrations were computed on the Beckman Coulter Synchron LX®20 (Beckman Coulter, Inc.) automat using the glucose oxidase method. Analyses were performed in batches at a single site (Centre Hospitalier Universitaire, Sainte-Justine Clinical Biochemistry Laboratory) twice monthly. IFG was defined as a fasting blood glucose value ≥ 5·6 mmol/l but < 7·0 mmol/l, and IGT was defined as a 2 h post-load glucose value ≥ 7·8 mmol/l but < 11·1 mmol/l. Diabetes was defined as a fasting blood glucose value ≥ 7·0 mmol/l or a 2 h post-load glucose value ≥ 11·1 mmol/l; at least two such values at different time points, or symptoms consistent with diabetes mellitus, are required to make this diagnosis( 20 ).
We used both OGTT-derived indices and fasting-based indices to measure IS and insulin secretion. The fasting-based measure of IS was the homeostasis model assessment of insulin resistance (HOMA-IR), calculated as fasting insulin (mU/l) × fasting glucose (mmol/l)/22·5(
Reference Matthews, Hosker and Rudenski
21
). HOMA-IR has been extensively validated against the hyperinsulinaemic–euglycaemic clamp, the gold standard method for assessing IS, in adults and children(
Reference Henderson, Rabasa-Lhoret and Bastard
22
,
Reference Gungor, Saad and Janosky
23
). We used the Matsuda IS index (Matsuda ISI) as an OGTT-derived measure of IS. The Matsuda ISI is computed as
 $$10\,000/\sqrt {((fasting\,glucose\times fasting\,insulin)} $$
 $$\sqrt {\times (mean\,OGTT\,glucose\times mean\,OGTT\,insulin))} $$
(
Reference Matsuda and DeFronzo
24
), and it has been validated against the current gold standard method of estimating IS in children(
Reference Henderson, Rabasa-Lhoret and Bastard
22
,
Reference Yeckel, Weiss and Dziura
25
). As a measure of fasting insulin secretion, we used HOMA2 %-β, the updated computer version of the HOMA model. We had previously shown that HOMA2 %-β correlated well with the acute insulin response to glucose derived from a frequently sampled intravenous glucose tolerance test(
Reference Henderson, Baillargeon and Rabasa-Lhoret
26
) in healthy children. HOMA2 %β, as well as the corresponding fasting-based measure of IS (HOMA2-IS), was calculated using the HOMA2 calculator version 2.2 (available at http://www.dtu.ox.ac.uk/homa). OGTT-derived measures of insulin secretion included the ratio of the AUC of insulin:glucose over the first 30 min (AUC I/G
t= 30
min) of the OGTT (first-phase insulin secretion) and the AUC of insulin:glucose over the complete 2 h (AUC I/G
t= 120
min) of the OGTT (second-phase insulin secretion). The AUC I/G
t= 30
min has previously been shown to have a good correlation with the acute insulin response to glucose in healthy children(
Reference Henderson, Baillargeon and Rabasa-Lhoret
26
). Body composition was determined using dual-energy X-ray absorptiometry (Prodigy Bone Densitometer System, DF+14664; GE Lunar Corporation)(
Reference Goran
27
). The percentage of total body fat mass was used as the measure of adiposity. Pubertal development, based on Tanner stages, was assessed by the inspection of genitalia and pubic hair development in boys and breast and pubic hair development in girls by a trained nurse(
Reference Marshall and Tanner
28
,
Reference Marshall and Tanner
29
). Children were then categorised as pre-pubertal (Tanner stage 1) or pubertal (Tanner stages 2–5).
$$\sqrt {\times (mean\,OGTT\,glucose\times mean\,OGTT\,insulin))} $$
(
Reference Matsuda and DeFronzo
24
), and it has been validated against the current gold standard method of estimating IS in children(
Reference Henderson, Rabasa-Lhoret and Bastard
22
,
Reference Yeckel, Weiss and Dziura
25
). As a measure of fasting insulin secretion, we used HOMA2 %-β, the updated computer version of the HOMA model. We had previously shown that HOMA2 %-β correlated well with the acute insulin response to glucose derived from a frequently sampled intravenous glucose tolerance test(
Reference Henderson, Baillargeon and Rabasa-Lhoret
26
) in healthy children. HOMA2 %β, as well as the corresponding fasting-based measure of IS (HOMA2-IS), was calculated using the HOMA2 calculator version 2.2 (available at http://www.dtu.ox.ac.uk/homa). OGTT-derived measures of insulin secretion included the ratio of the AUC of insulin:glucose over the first 30 min (AUC I/G
t= 30
min) of the OGTT (first-phase insulin secretion) and the AUC of insulin:glucose over the complete 2 h (AUC I/G
t= 120
min) of the OGTT (second-phase insulin secretion). The AUC I/G
t= 30
min has previously been shown to have a good correlation with the acute insulin response to glucose in healthy children(
Reference Henderson, Baillargeon and Rabasa-Lhoret
26
). Body composition was determined using dual-energy X-ray absorptiometry (Prodigy Bone Densitometer System, DF+14664; GE Lunar Corporation)(
Reference Goran
27
). The percentage of total body fat mass was used as the measure of adiposity. Pubertal development, based on Tanner stages, was assessed by the inspection of genitalia and pubic hair development in boys and breast and pubic hair development in girls by a trained nurse(
Reference Marshall and Tanner
28
,
Reference Marshall and Tanner
29
). Children were then categorised as pre-pubertal (Tanner stage 1) or pubertal (Tanner stages 2–5).
Statistical analyses
Descriptive statistics, including means and standard deviations, as well as proportions, were used to describe the baseline characteristics of the participants and their dietary intake of major macronutrients. Measures were analysed as continuous variables where possible. Age- and sex-adjusted BMI z-scores were computed from Centers for Disease Control and Prevention (2000) data( 30 ). A BMI z-score < 5th percentile for age and sex defined underweight, a BMI z-score ≥ 5th percentile but < 85th percentile for age and sex defined normal weight, and a BMI z-score ≥ 85th percentile but < 95th percentile for age and sex defined overweight, while a BMI z-score ≥ 95th percentile for age and sex defined obesity. Univariable and multivariable linear regressions were used to examine the associations between macronutrient intake and measures of insulin secretion and IS (outcome variables). All multivariable models were adjusted for physical activity, fitness, sedentary behaviour and adiposity, as well as sex, age and stage of pubertal development. We assessed the linearity of the associations using a test of non-linearity( Reference Hastie and Tibshirani 31 ) and modelled all non-linear associations using non-parametric smoothing splines with four degrees of freedom, in which the shape of the association was estimated directly from the data, using generalised additive models( Reference Hastie and Tibshirani 31 ). For parsimony, and given that physical activity is reduced primarily in the winter months( Reference Belanger, Gray-Donald and O'Loughlin 32 ), we defined two periods: ‘winter’, from November to March, and ‘non-winter’, from April to October. We included season in models that included physical activity. Outcome variables had non-symmetric distributions and were log-transformed using 100 × ln of the variable, such that β-coefficients represent the percentage change in the outcome associated with a one-unit increase in the exposure variable( Reference Cole 33 ). Interaction terms were introduced one at a time into the models to examine whether the association between physical activity and IS, between fitness and IS, or between ST and IS varied as a function of sex. All analyses were performed using Statistical Analysis Systems statistical software package version 9.2 (SAS Institute, Inc.).
Results
Of the 630 participants in the QUALITY cohort, 215 participants were excluded due to missing dietary data or not having adequate accelerometer or fitness test data (based on our predefined criteria of a minimum accelerometer wear time of 10 h/d for a minimum of 4 d and a maximal fitness test value). There were no statistically significant differences between these participants and those included in the analyses in terms of sex and BMI z-scores (data not shown). The excluded participants were slightly younger (mean age 9·3 v. 9·7 years) than those included in the analyses (P< 0·0001). We had found previously that participants with a sub-maximal fitness test value were younger than those with a maximal fitness test value, probably due to a greater difficulty in younger children to meet the strenuous demands of a cycling test, such as pedalling against an increasing workload while following an imposed rhythm( Reference Henderson, Gray-Donald and Mathieu 34 ). The selected characteristics of the 415 participants retained for the analyses are presented in Table 1. Of the participants, 55 % were of normal weight for their age and sex, 20 % were overweight and 23 % were obese, with 2 % being underweight. Table 2 outlines the nutrient intake data by sex across participants of the QUALITY cohort. Overall, boys consumed more energy daily as well as higher quantities of dietary vitamin D and fibre than girls. Girls tended to drink less SSB than boys (P= 0·087).
Table 1 Baseline characteristics of the participants aged 8–10 years, according to sex (QUebec Adipose and Lifestyle InvesTigation in Youth cohort) (Mean values and standard deviations; number of participants and percentages; medians and ranges)
MVPA, moderate-to-vigorous physical activity; LBM, lean body mass.
* The P value indicates the statistical significance of a t test comparing mean values between boys and girls for normally distributed variables or a Mann–Whitney U test for variables with a skewed distribution. χ2 test or Fisher's exact test was used for categorical variables.
Table 2 Baseline nutrient intake data by sex for the participants of QUebec Adipose and Lifestyle InvesTigation in Youth (Mean values and standard deviations; medians and ranges)
SSB, sugar-sweetened beverages.
* The P value indicates the statistical significance of a t test comparing mean values between boys and girls for normally distributed variables or a Mann–Whitney U test for variables with a skewed distribution.
In our sample, fifteen children had IFG, thirty-one youth had IGT and five children had both IFG and IGT. Although four children met the definition of diabetes based on either their fasting or 2 h post-load glucose values, at least two such values at different time points, or symptoms consistent with diabetes mellitus, are required to make this diagnosis.
When examining the univariable association between macronutrient intake and indices of IS, only protein and fibre intakes had significant associations. For every 1 % increase in daily protein intake, HOMA-IR increased by almost 2 %. Conversely, for every additional gram of fibre consumed, HOMA-IR decreased by 1·66 % (Table 3). However, these associations were no longer significant when adjusting for other lifestyle habits, such as physical activity and ST, as well as adiposity. Similarly, for every additional gram of fibre consumed daily, the Matsuda ISI increased by 1·5 %. There was a similar trend of decreased IS measured by the Matsuda ISI with higher protein intake (P= 0·051). No association between dietary macronutrient intake and the Matsuda ISI remained significant when accounting for MVPA, fitness, ST, adiposity and other covariates (Table 3).
Table 3 Association between dietary components and measures of insulin sensitivity* (β-Coefficients and standard errors)
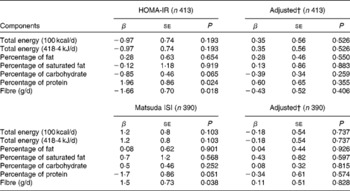
HOMA-IR, homeostasis model assessment of insulin resistance; Matsuda ISI, Matsuda insulin sensitivity index.
* Models on the left are univariable linear regression models and models on the right are multivariable models. For HOMA-IR, splines were used to model the association between adiposity and screen time, while only adiposity was modelled using splines for Matsuda ISI.
† Models adjusted for moderate-to-vigorous physical activity, fitness, screen time, adiposity, age, sex, Tanner stage and season.
The percentage of protein also appeared to be associated with first-phase insulin secretion: for every 1 % increase in daily protein intake, first-phase insulin secretion decreased by 1·1 %, after controlling for MVPA, fitness, ST, adiposity and other covariates (data not shown). This association, however, did not hold true for HOMA2 %-β or second-phase insulin secretion. Moreover, although higher intakes of SSB appeared to be associated with lower second-phase insulin secretion (β = − 0·02; P= 0·030), this association did not hold when controlling for potential confounders (data not shown). The intake of no other macronutrients, or total daily energy intake, was associated with insulin secretion (across all indices).
Discussion
In this cohort of youth with a family history of obesity children with higher protein content in their diet appeared to have lower first-phase insulin secretion requirements, even after controlling for other lifestyle habits and adiposity. Otherwise, the intake of no other dietary macronutrient was associated with the measures of IS or insulin secretion after adjusting for MVPA, fitness, ST and adiposity.
Studies examining the association between protein intake and insulin dynamics in youth are limited and have reported conflicting results. Hoppe et al. ( Reference Hoppe, Molgaard and Vaag 8 ) studied the effect of the intake of animal protein in the form of milk or meat on insulin dynamics in twenty-four 8-year-old Caucasian boys. They found that milk was associated with decreased IS and increased β-cell function, while the addition of meat to the diet led to unchanged IS and increased β-cell function. Comparison of the present results with those reported by Hoppe et al. ( Reference Hoppe, Molgaard and Vaag 8 ) remains difficult, given the different study designs and the fact that their study examined very high protein intakes. In contrast, a study of 365 school-aged children (age: 10 (sd 2·3) years) from poor suburbs of Buenos Aires examined the association of milk consumption, lifestyle and insulin resistance cross-sectionally( Reference Hirschler, Oestreicher and Beccaria 9 ), and found an inverse association between milk consumption and insulin resistance (measured by HOMA-IR) after adjusting for blocks walked daily, television viewing, soft drink consumption, parental education level, sex, age, HDL-cholesterol levels and systolic blood pressure( Reference Hirschler, Oestreicher and Beccaria 9 ). This study did not consider protein intake from other sources, making comparisons of its results with those of the present study difficult.
On the whole, there are limited data regarding the association of dietary protein intake with insulin dynamics in children, and while it has been suggested – at least acutely – that high dietary protein intakes from dairy products may be more deleterious to IS than meat protein intakes, epidemiological data suggest that exposure to dairy products is beneficial for IS. Further studies are required to examine the influence of dietary protein and its various sources (dairy products v. meat) on insulin dynamics.
Dietary intake is critical for the development of obesity: an imbalance between dietary intake and energy expenditure leads to increases in adiposity. We sought to determine whether dietary intake, independently of its established effect on adiposity, is associated with IS and insulin secretion. The low variability of macronutrient intakes across youth in the present study might explain the overall absence of an association between dietary composition and insulin dynamics in youth. Alternatively, the absence of an association may be related to metabolic plasticity in this age group. Indeed, Sunehag et al. ( Reference Sunehag, Toffolo and Treuth 10 ) examined the impact of adopting various diets in a small group (n 36) of healthy, non-obese pre-pubertal and adolescent youth using a randomised cross-over design. Specifically, they examined the effect of a high-fat/low-carbohydrate diet and three different high-carbohydrate/low-fat diets: one with low fructose content (where fructose content was 10 % of daily carbohydrate intake); another with moderate fructose content (where fructose represented 20 % of daily carbohydrate intake); the last one with high fructose content (where fructose accounted for 40 % of daily carbohydrate intake). The results suggested that the children adapted rapidly to large changes in carbohydrate and fat intakes by adjusting carbohydrate or fat oxidation, respectively. IS was not different across diets in pre-pubertal children, but was lower in adolescents on the high-fat diet, compared with those on the high-carbohydrate diet. Furthermore, first- and second-phase insulin secretion remained similar across diets, regardless of age and sex( Reference Marshall and Tanner 29 ). Similarly, in these children, high-carbohydrate diets were not associated with any changes in IS in the pre-pubertal youth, while they were associated with improved IS in the adolescent group. Moreover, pancreatic β-cell function was not adversely affected by such high-carbohydrate diets: indices of first- and second-phase insulin secretion remained unchanged among the pubertal and pre-pubertal youth( Reference Sunehag, Toffolo and Treuth 10 ). It may be that dietary composition has little effect on insulin and glucose dynamics early in life, but that its relevance becomes more important with age. Adolescents in Sunehag's study tended to exhibit changes in IS based on dietary composition, suggesting that changes may occur in adolescence, but not in pre-pubertal youth. Longitudinal studies are required to determine whether dietary macronutrient composition exerts an effect on IS and insulin secretion independently of its effects on adiposity.
The findings of the present study are complementary to those of our previous work examining how SSB consumption is associated with the components of the metabolic syndrome( Reference Wang, Mark and Henderson 35 ). In our previous work, we found that among overweight children ( ≥ 85th BMI percentile), a 100 ml increase in SSB consumption was associated with 0·10 unit higher HOMA-IR, after controlling for age, sex, adiposity and overall physical activity (measured in counts per min). In the present study, we furthered our understanding of the association of lifestyle habits with metabolic health by taking into consideration additional or more specific aspects of lifestyle habits. Specifically, we adjusted for MVPA, which has been reported to be more closely associated with metabolic health than with overall physical activity. Furthermore, we adjusted for fitness, which reflects the body's potential for substrate utilisation. Finally, we also adjusted for sedentary behaviour, recently found to have an independent association with metabolic health by our group( Reference Henderson, Gray-Donald and Mathieu 34 ). Considering these lifestyle factors jointly suggest that fitness, and lifestyle habits other than dietary habits, may be more important to metabolic health in children.
The strengths of the present study lie in its relatively large sample size and the high quality of measures obtained, specifically physical activity, fitness, adiposity and dietary composition. The use of three consecutive 24 h dietary recalls optimises data collection on habitual dietary habits. This method has been validated using the gold standard of doubly labelled water( Reference Burrows, Martin and Collins 36 ). In addition, the telephone interview method has been used in several settings with good results in adults( Reference Conway, Ingwersen and Moshfegh 37 ) and children( Reference Baxter, Thompson and Litaker 38 ). Furthermore, we attempted to adjust for other lifestyle factors, such as fitness, physical activity and sedentary behaviour, for determining the association between dietary macronutrient content and insulin dynamics. The limitations of the present study include its cross-sectional nature, which prevents causal inference. Also, the findings of the present study are generalisable only to Caucasian youth with a parental history of obesity; however, this group comprises a large segment of the Canadian population and constitutes a relevant ‘at-risk’ group. While there are no population-based prevalence rates for children with IGT, population-based prevalence rates for IFG tend to be those of older adolescents and various at-risk ethnic groups, making comparisons with our sample difficult. Based on the findings of the present study, we report prevalence rates of 3·6 % for children with IFG alone, 1·2 % for those with both IFG and IGT, and 7·5 % for those with IGT alone, rates which are in keeping with a recent study that has examined the prevalence rates of IFG in overweight and obese 6–10-year-olds( Reference Moadab, Kelishadi and Hashemipour 39 ).
In conclusion, our findings suggest that in children with a parental history of obesity, higher protein intake is associated with lower first-phase insulin secretion requirements. Overall, while long-term excess of energy has been shown to lead to overweight and obesity, dietary macronutrient composition does not appear to be directly correlated with IS and insulin secretion. This may be due to metabolic plasticity in youth and suggests that strategies to prevent T2D mellitus in youth should focus on lifestyle modifications other than dietary composition (e.g. MVPA).
Acknowledgements
The authors thank Dr Marie-Ève Mathieu (Université de Montréal) for her editorial support. Dr Marie Lambert (July 1952–February 2012), paediatric geneticist and researcher, initiated the QUALITY cohort. Her leadership and devotion to QUALITY will always be remembered and appreciated. They are also grateful to all the families that participated in QUALITY.
QUALITY is funded by the Canadian Institutes of Health Research, the Heart and Stroke Foundation of Canada and the Fonds de la recherche en santé du Québec. The Canadian Institutes of Health Research, the Heart and Stroke Foundation of Canada and the Fonds de la recherche en santé du Québec had no role in the design and analyses of the study or writing of this article.
The authors' contributions are as follows: M. H. researched the data, performed the analyses and wrote the manuscript; K. G.-D. researched the data, contributed to the discussion and reviewed/edited the manuscript; A. B. assisted with the analyses and reviewed/edited the manuscript.
The authors have no conflicts of interest to disclose.


