


Obesity prevalence has increased worldwide and according to the WHO it is considered a global epidemic, reaching all population groups, including pregnant women( Reference Mitchell, Catenacci and Wyatt 1 ). Both overweight and obese women have a higher risk of excessive gestational weight gain (GWG) compared with normal-weight women( Reference Godoy, Nascimento and Surita 2 ). Excessive GWG has been associated with undesirable pregnancy outcomes, such as Caesarean delivery, fetal macrosomia, preterm delivery, gestational diabetes and pre-eclampsia( Reference Godoy, Nascimento and Surita 2 – Reference Liu, Hong and Zhang 4 ).
Although obesity is considered a multifactorial disorder, the main determinant related to GWG seems to be positive energy balance, that is high energy intake, found mainly in diets rich in refined foods, sugar and saturated fats and poor in fibre (often named as ‘Western diet’ or ‘fast food’), and a lifestyle characterised by low levels of physical activity( Reference Popkin and Gordon-Larsen 5 ). The ‘Western diet’ is associated with overweight and obesity and possibly with excessive GWG( Reference Popkin and Gordon-Larsen 5 ). These findings reinforce the efficacy of the dietary patterns (DP) approach to assessing the overall diet, which is more closely related to real consumption, as it does not consider each food or nutrient in isolation( Reference Hu 6 ). In this regard, reduced rank regression (RRR) is a hybrid method that takes into account the a priori knowledge of the relationship between nutrient intakes and the outcome of interest, and also includes a posteriori data-driven analysis( Reference Hoffmann, Schulze and Schienkiewitz 7 ).
Studies have investigated DP that may be associated with GWG. A higher adherence to a ‘New Nordic diet’, composed largely of healthy foods, was associated with 7 % lower odds of excessive GWG in 66 597 Norwegian pregnant women with normal weight( Reference Hillesund, Bere and Haugen 8 ). In contrast, a higher adherence to a ‘fast food’ pattern was associated with a faster GWG (10th–40th week)( Reference Uusitalo, Arkkola and Ovaskainen 9 ). However, another study found no significant associations between DP and total GWG after adjustment for confounders( Reference Tielemans, Erler and Leermakers 10 ).
During pregnancy, women are exposed to several physiological adaptations, such as increased insulin resistance and changes in hormone circulation at different stages of pregnancy, including leptin and adiponectin, known as appetite-regulating hormones( Reference Newbern and Freemark 11 ). The literature has also shown that DP are associated with leptin, adiponectin and insulin concentrations( Reference Izadi, Saraf-Bank and Azadbakht 12 , Reference Kashino, Nanri and Kurotani 13 ). A ‘healthy’ DP may be positively associated with adiponectin concentrations( Reference Izadi, Saraf-Bank and Azadbakht 12 ) and negatively with insulin resistance( Reference Sommer, Sletner and Jenum 14 ), whereas an ‘unhealthy’ DP such as a ‘Western diet’ may be associated with higher leptin concentrations among adults( Reference Kashino, Nanri and Kurotani 13 ). Nevertheless, to the best of our knowledge, no studies have investigated the relationship between DP and adipokines during pregnancy.
Considering the limited results regarding GWG and the lack of the studies relating DP and the variation of adipokines and insulin concentrations throughout pregnancy, the aim of this study was to evaluate the association between the adherence to derived DP and maternal adiposity indicators, leptin, adiponectin and insulin concentrations during pregnancy among healthy Brazilian pregnant women.
Methods
Study design and sample
The present study comprised a prospective cohort of pregnant women followed up at the 5th–13th, 20th–26th, 30th–36th gestational weeks and 30–40 d postpartum. The study was conducted at a public healthcare centre located in Rio de Janeiro, Brazil, between November 2009 and October 2011. Those women who met the following eligibility criteria (n 299) were invited to participate in this study: between 5 and 13 weeks of gestation at baseline, aged 20–40 years and free from infectious and chronic diseases (except obesity).
Criteria for exclusions after the baseline clinical evaluation consisted of the following: confirmed pre-gestational diagnosis of infectious or chronic non-communicable diseases (except obesity) (n 14), gestational week≥14 at the first visit (n 15), multiple gestation (n 4), miscarriage or stillborn (n 30) and missing the baseline interview (n 12). Thus, our sample in the first trimester comprised 224 pregnant women.
For this study, we excluded fifty participants owing to moving out of the study programme area (n 11), consent removal (n 4), abandonment of prenatal care at the study unit (n 5), missing the follow-up interview (n 9), without data of gestational dietary intake at the third trimester (n 10) and with self-reported blood glucose alterations during pregnancy (n 11). After these exclusions, our baseline sample comprised 173 pregnant women (Fig. 1).
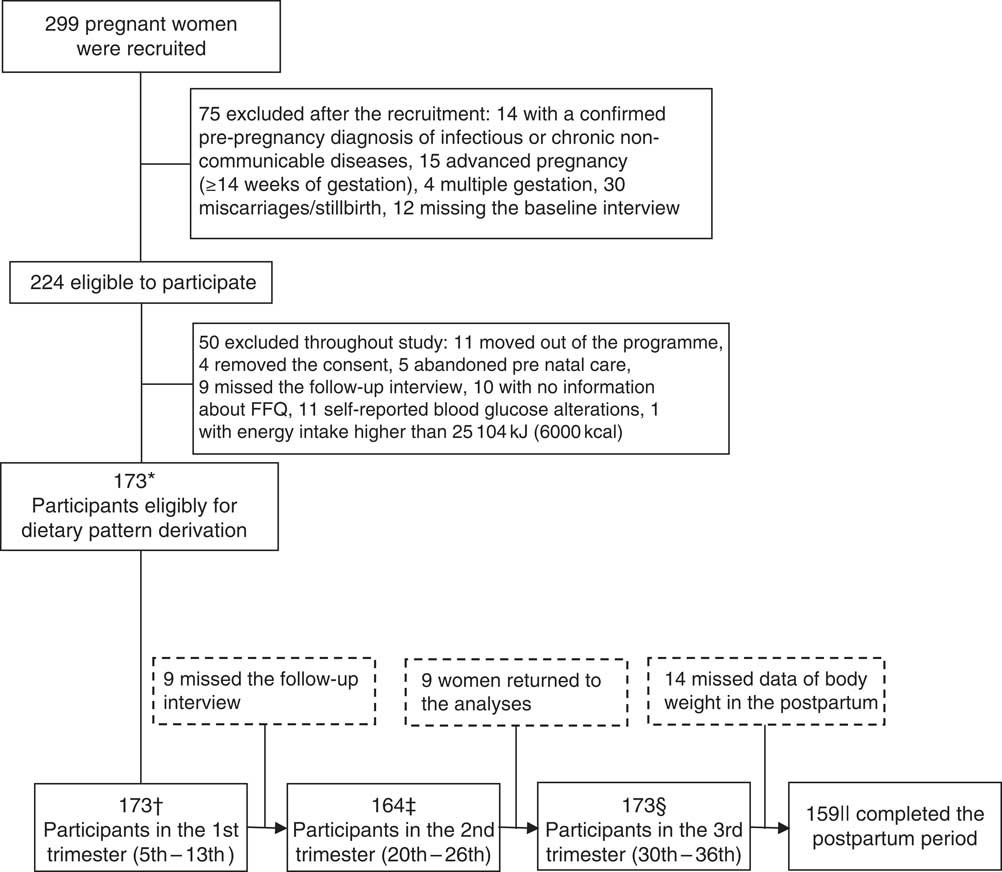
Fig. 1 Process of recruitment and follow-up of pregnant women attending at a public prenatal care in Rio de Janeiro. * We considered only women with data of FFQ in the third trimester and those who remained until the end this study. Moreover, we excluded women who had preterm birth to minimise analysis error. Total sample size was based in the outcome with higher number of participants (gestational weight gain adequacy). † Leptin data missing=2 (total sample=171); adiponectin data missing=2 and data outlier=1 (total sample=170); insulin data missing=3 and data outlier=1 (total sample=169; ‡ leptin data missing=1 and data outlier=1 (total sample=161); adiponectin data missing=6 and data outlier=1 (total sample=157); insulin data missing=1 and data outlier=1 (total sample=161); § leptin data missing=4 and data outlier=1 (total sample=168); adiponectin data missing=5 and data outlier=1 (total sample=167); insulin data missing=5 and data outlier=1 (total sample=167); || total sample size for postpartum BMI and postpartum retention.
Dietary intake assessments
A FFQ was administered in the third trimester (30th–36th gestational weeks) to obtain information on the habitual diet of pregnant women during the gestational period (last 6 months of pregnancy).
This questionnaire refers to a validated version of an FFQ developed for the Rio de Janeiro adult population( Reference Sichieri and Everhart 15 ), composed of eighty-two food items, including non-alcoholic and alcoholic beverages, with eight frequency options (>3 times/d, 2–3 times/d, 1 time/d, 5–6 times/week, 2–4 times/week, 1 time/week, 1–3 times/month and never or hardly ever) and portion sizes (described in household measures).
For this analysis, five items were excluded because the consumption frequency was lower than 20 % (lard, alcoholic beverages (wine, beer and vodka)) or when the food items were aggregated (dried meat/codfish). Thus, seventy-seven foods items were aggregated into eighteen food groups on the basis of similarities in their nutritional composition and the particular dietary habits of these women.
The FFQ data were summarised to identify DP among pregnant women – that is the frequency of intake was transformed into daily frequency, and portion sizes into g or ml( Reference Pinheiro, Lacerda and Benzecry 16 ). The daily amounts consumed (g/d or ml/d) of each food group was obtained by multiplying the daily frequency by the portion size, and were considered as predictive variables in the RRR analysis. The Brazilian Food Composition Table was used as the main nutrient database( 17 ). The food items not found were added from the US Department of Agriculture National Nutrient Database for Standard Reference( 18 ).
We applied the RRR procedure to identify DP related to indicators of maternal adiposity (postpartum weight retention and GWG adequacy) and plasma concentrations of leptin, adiponectin and insulin. The RRR statistical procedure was used to maximise the explained variation in two response variables in the data set, representing a so-called a priori component, as well as the variation in nineteen predefined food groups (predictive variables), which composed the a posteriori component( Reference Hoffmann, Schulze and Schienkiewitz 7 ). In the present study, the nutrient densities of dietary fibre and lipid (fat) (grams of fibre and fat per total daily energy intake (kJ (kcal))) were chosen as response variables owing to their previously identified relationships with adiposity and plasma concentrations of leptin, adiponectin and insulin( Reference Izadi, Saraf-Bank and Azadbakht 12 , Reference Kashino, Nanri and Kurotani 13 ).
Biochemical analyses
Plasma adipokines and insulin concentrations were the dependent variables in the present study. Blood samples were collected between 06.50 and 07.50 hours, into Vacutainer® tubes by a trained professional in all gestational trimesters (weeks 5–13, 20–26 and 30–36) following a 12-h fasting period. The samples were centrifuged (5000 rpm for 5 min). Subsequently, the plasma was stored in tubes containing EDTA, placed in cylinders containing liquid nitrogen, which were transported weekly to a −80°C freezer where they were kept until analysis.
Plasma adiponectin concentrations (μg/ml) were determined using ELISA commercial kits (Millipore) with a sensitivity of 0·78 ng/ml. Measurements were made in duplicate and the inter- and intra-assay CV were 9·9 and 6·7 %, respectively.
Plasma leptin (ng/l) and insulin (μU/ml) concentrations were measured using ELISA commercial kits with sensitivities of 0·5 ng/ml and 2 μU/ml, respectively.
The homoeostasis model of assessment of insulin resistance (HOMA-IR) (insulin (μU/ml)×(glucose (mmol/l))/22·5) was calculated and used as an indicator of insulin resistance( Reference Matthews, Hosker and Rudenski 19 ).
Indicators of adiposity
Maternal body weight (kg) was measured at the three visits during pregnancy and at the postpartum visit with an electronic scale (Filizzola PL 150; Filizzola Ltda). Maternal height was measured at the study baseline using a portable stadiometer attached to the wall (Seca Ltda).
Indicators of adiposity were also considered as dependent variables in this study, and were represented by the adequacy of GWG, postpartum BMI and postpartum weight retention.
Pre-pregnancy BMI was calculated using weight and height measured at baseline (weight (kg)/height(m2)) and was categorised as underweight, normal weight, overweight and obese according to WHO criteria( 20 ). GWG (kg) was calculated as the difference between weight measured at the last prenatal visit before delivery (gestational weeks 38–40) and the weight measured at the first visit of study baseline (gestational weeks 5–13), and was classified according to the Institute of Medicine( 21 ) as insufficient, adequate or excessive. The recommendation is that women should gain weight according to their pre-pregnancy BMI – that is, those who were underweight, normal weight, overweight or obese should gain between 12·5 and 18·0 kg, 11·5 and 16·0 kg, 7·0 and 11·5 kg and about 7·0 kg, respectively. Values below these intervals were considered insufficient, and values above these intervals were considered excessive GWG. The women were classified as excessive and insufficient/adequate for analyses because the aim was to verify the association between DP and excessive GWG.
Postpartum weight retention (kg) was calculated as the difference between weight measured at the postpartum visit and the pre-pregnancy weight at the baseline. The postpartum weight retention was then categorised in tertiles, considering the first and second tertile (<4·4 kg) as low and the third tertile (≥4·4 kg) as high risk of adiposity.
Postpartum BMI was considered as an indicator of postpartum adiposity. This outcome was calculated based on measures of maternal weight at 30–45 d postpartum and the mean height at baseline (gestational weeks 5–13). The postpartum BMI cut-off for overweight/obesity classification was based on the WHO criteria (≥25 kg/m2)( 22 ).
Assessment of covariates
A structured questionnaire was applied by trained interviewers at baseline, to obtain the following variables: age (years), per-capita family income (Brazilian currency – R$), education (years), marital status (married/stable partnership or single), smoking habit (no/yes), alcohol consumption (no/yes), parity (0/≥1) and first trimester leisure physical activity (no/yes). Current breast-feeding practice (no/yes) was obtained at the postpartum visit.
Statistical analyses
The RRR procedure was used to identify DP during pregnancy using procedure partial least square (PROC PLS) from Statistical Analysis System (SAS) University Edition software (version 9.4; SAS Institute)( 23 ).
The sample size for the current study was estimated based on the assumption that dietary analysis requires at least five subjects for each food group when the FFQ has >15 food items( Reference Wirfält, Drake and Wallström 24 , Reference Newby and Tucker 25 ). The analysis aggregated eighteen food groups to identify the DP during pregnancy. Therefore, the minimal required sample size was set to 90 (5×18) pregnant women. The number of subjects analysed in this study was consistent with the method requirements.
Data distribution was performed using the Shapiro–Wilk test. Insulin concentrations did not have a normal distribution. Therefore, it was log-transformed before analysis. The characteristics of pregnant women were described using means and standard deviations for the continuous variables and absolute (n) and relative frequencies (%) for the categorical data.
χ 2 Tests were used to compare indicators of adiposity, whereas ANOVA was used to compare adipokines and insulin concentrations at each trimester according to tertiles of adherence to DP. The comparison between the trimesters within each tertile of adherence to DP was analysed using repeated-measures ANOVA.
Crude and adjusted OR and 95 % CI were estimated through logistic regression to assess the associations between tertiles of DP and excessive GWG, postpartum overweight/obesity and high postpartum weight retention.
We performed linear mixed-effect (LME) regression models to evaluate the association between DP during pregnancy and adipokines, and insulin concentrations. The LME models were adjusted for confounders selected by biological plausibility and statistical significance (P<0·2) in the bivariate analysis for each of the three outcomes. These models accommodate time-dependent and time-independent covariates, and allow for unbalanced time intervals( Reference Singer and Willett 26 ). The gestational age (weeks) was included in LME models as a random and fixed effect to adjust for the overall and individual variations in the adipokines and insulin concentrations over time and according to tertiles of DP. All other covariates were analysed as fixed effects.
Comparisons between the subjects retained at postpartum and those lost to follow-up between baseline and postpartum were performed. We compared the following variables: women’s age, GWG, HOMA-IR, daily energy intake during pregnancy, pre-pregnancy BMI, per-capita family income, education, leptin, adiponectin, insulin, postpartum BMI, GWG adequacy, marital status, smoking habit, alcohol consumption, parity and first trimester leisure physical activity. The Student’s t test was used to compare continuous variables and χ 2 test to compare categorical variables. Data processing and analysis were performed using the software STATA version 12.0( 27 ). A P value<0·05 was considered significant.
Ethical approval
The Maternity Hospital (protocol no.: 0023.0.361.000-08) and the Institute of Psychiatry (protocol no.: 0012.0.249.000-09) research ethics committees, both from the Rio de Janeiro Federal University, approved the present study. All participants signed a term of consent freely and spontaneously, detailing all procedures to be carried out, according to the Brazilian Resolution 466/2012.
Results
Women who were lost to follow-up were more likely to consume alcohol (41·7 v. 17·4 %, P=0·039) and reported more years of education in comparison with those who completed the study (10·3 v. 8·5 years, P=0·046) (online Supplementary Table S1).
At baseline, the pregnant women had a mean age of 26·7 (sd 5·5) years, 24·9 (sd 4·3) kg/m2 of pre-pregnancy BMI and 8·6 (sd 2·9) years of education. The mean daily energy intake during pregnancy was 10 104 (sd 3234) kJ (2415 (sd 773) kcal) and the mean GWG was 11·9 (sd 4·2) kg. Excessive GWG was observed among 34·7 % (n 60) pregnant women and the third tertile of postpartum weight retention corresponded to a weight gain higher than 4·4 kg. Postpartum overweight/obesity was observed in 56·6 % (n 90) of the participants (Table 1).
Table 1 Characteristics of pregnant women in a public health centre in Rio de Janeiro, Brazil, 2009–2012 (Mean values and standard deviations; numbers and percentages)
HOMA-IR, homoeostasis model assessment of insulin resistance.
* HOMA-IR=fasting glucose (mmol/l)×fasting insulin (μU/ml)/22·5).
† Brazilian currency: USD $1 dollar=R$ 1·71 reais.
‡ The cut-off points for pre-pregnancy and postpartum BMI classification of overweight/obesity were according to World Health Organization( 22 ) (≥25 kg/m2).
§ Variables with missing information: fourteen missing values for postpartum weight retention and postpartum BMI.
|| Weight at 30–45 d postpartum.
¶ The postpartum weight retention was classified in low and high according to the first and second tertiles (<4·4 kg) and third tertile (≥4·4 kg), respectively.
** Gestational weight gain adequacy was classified according to the Institute of Medicine( 21 ) recommendations.
†† Refers to baseline information.
Two DP were identified. The first was labelled ‘common-Brazilian’ and was characterised by higher intakes of beans, rice and lower intakes of fast food/snacks, candies/table sugar and processed meats/bacon. This DP was positively correlated with fibre density and negatively with lipid density. The second DP was named ‘Western’ and was characterised by higher intakes of fast food/snacks and processed meat/bacon and lower intakes of noodles/pasta/roots/tubers and sodas. The ‘Western’ DP was positively correlated with fibre and lipid density (Table 2).
Table 2 Food groups comprising the simplified dietary pattern, their mean intake by pregnant women and factor loadings (n 186)
FD, fibre density; LD, lipid density.
** Pearson’s correlation statistically significant (P<0·001).
† The dietary pattern labels were informed by the food groups/items; factor loadings>|0·20| are indicated. All factor loadings contributed to the dietary patterns scores.
Postpartum BMI, postpartum weight retention and GWG adequacy did not differ according to tertiles of adherence to the identified DP in the current study (online Supplementary Table S2).
There were no significant differences in the means of adiponectin, leptin and insulin concentrations according to the tertiles of adherence to DP (online Supplementary Table S3).
In the adjusted logistic regression analysis women with medium adherence to the ‘Western’ DP presented higher risk of excessive postpartum BMI than women with lower adherence (medium v. low tertile of adherence, OR 2·80; 95 % CI 1·18, 6·67) (Table 3). In the adjusted logistic models involving adiposity indicators, the pre-pregnancy BMI was also included. However, DP remained unassociated (data not shown).
Table 3 Logistic regression between tertiles of adherence to dietary patterns and gestational adiposity outcomes (Odds ratios and 95 % confidence intervals)
HOMA-IR, homoeostasis model assessment of insulin resistance.
* The low tertile of adherence to dietary patterns was considered as the reference category.
† P value from logistic regression models.
‡ Gestational weight gain adequacy was classified according to the Institute of Medicine( 21 ) recommendations.
§ Normal/low gestational weight gain adequacy was considered as reference.
|| Model 1 was unadjusted; model 2 was adjusted for pre-pregnancy BMI, parity (number of parturition) and HOMA-IR.
¶ The cut-off for pre-pregnancy BMI classification of overweight/obesity was according to World Health Organization( 22 ) (≥25 kg/m2).
** Normal postpartum BMI (<25 kg/m2) was considered as reference.
†† Model 1 was unadjusted; model 2 was adjusted for postpartum weight retention, breast-feeding and HOMA-IR.
‡‡ Higher postpartum weight retention was classified as the third tertile (≥4·4 kg) of gestational weight retention.
§§ The first/second tertile of gestational weight retention was considered as reference.
|||| Model 1 was unadjusted; model 2 was adjusted for maternal pre-pregnancy BMI, breast-feeding and gestational weight gain.
In the multiple adjusted longitudinal analyses, the highest adherence to the ‘common-Brazilian’ DP was directly associated with adiponectin concentrations (β=1·07; 95 % CI 0·17, 1·98). The highest adherence to the ‘Western’ DP was negatively associated with adiponectin throughout pregnancy (high v. low tertile of adherence β=−1·11; 95 % CI −2·00, −0·22). Furthermore, the highest adherence to the ‘Western’ DP was directly associated with leptin concentrations during pregnancy (β=64·9; 95 % CI 22·8, 107·0) (Table 4). We did not find statistically significant associations between any of the three DP and insulin concentrations.
Table 4 Longitudinal associations of tertiles of adherence to gestational dietary patterns with adipokines and insulin during pregnancy (β-Coefficients and 95 % confidence intervals)
* The low tertile of adherence to dietary patterns was considered as the reference category.
† P value from linear mixed-effect regression models.
‡ Adiponectin: model 1 was unadjusted; model 2 was adjusted for age (years), per-capita family income (R$), pre-pregnancy BMI (kg/m2), smoking habit (yes/no), parity (number of parturition), current leisure physical activity (yes/no).
§ Leptin: model 1 was unadjusted; model 2 adjusted for age (years), pre-pregnancy BMI (kg/m2), education (years), smoking habit (yes/no), parity (number of parturition), 1st trimester leisure physical activity (yes/no) and homoeostasis model assessment.
|| Log-insulin: model was unadjusted; model 2 adjusted for age (years), per-capita family income (R$), parity (number of parturition), marital status (married or stable partnership/single), pre-pregnancy BMI (kg/m2) and alcohol consumption (yes/no).
Discussion
The present study has three main findings. First, women with the highest adherence to the ‘common-Brazilian’ DP presented higher adiponectin concentrations throughout pregnancy. Second, women with the highest adherence to the ‘Western’ DP presented lower adiponectin concentrations throughout pregnancy, and, third, women with highest adherence to the ‘Western’ DP had higher leptin concentrations during pregnancy.
A ‘common-Brazilian’ DP similar to that derived in this study can be considered a healthy pattern because it has been shown to be a protective factor for overweight and obesity( Reference Sichieri 28 ). The ‘common-Brazilian’ DP derived here is characterised by high intakes of beans, rice and low intakes of fast food/snacks, meats/giblets/eggs and processed meats/bacon. Furthermore, it is inversely correlated with dietary fat density and directly correlated with fibre density, the beans being the food item with the highest loading attributed for this pattern. However, we found no association between our ‘common-Brazilian’ DP and the indicators of adiposity, such as excessive GWG and postpartum overweight/obesity occurrence. In contrast, Drehmer et al.( Reference Drehmer, Camey and Nunes 29 ) found negative associations between daily fibre consumption and occurrence of obesity among 370 Brazilian pregnant women and observed that those who did not reach the daily recommendation of fibre intake (28 g) (DRI, 2002) had a 30 % higher risk of postpartum obesity compared with those who did reach the recommendation. These authors also showed that the highest contribution of fibre intake came from beans. It is possible that our failure to find an association is owing to our relatively small sample size.
Maternal leptin concentrations increase during normal pregnancy and decrease near delivery( Reference Noureldeen, Qusti and Al-Seeni 30 ), as observed in the current study. Recent studies have shown that higher leptin concentrations have been associated with pre-eclampsia( Reference Khosrowbeygi and Ahmadvand 31 ) and greater adiposity in the mother( Reference Tsai, Davis and Bryant-Greenwood 32 , Reference Aye, Lager and Ramirez 33 ) in neonates( Reference Josefson, Zeiss and Rademaker 34 ). Adiponectin concentrations usually decrease from the beginning to the second half of pregnancy( Reference Popkin and Gordon-Larsen 5 ). However, in the current study we did not find significant changes in this biomarker concentration throughout pregnancy( Reference Mazaki-Tovi, Kanety and Pariente 35 ). In contrast, we found an inverse association between insulin and adiponectin concentrations in the first trimester (data not shown). It has been suggested that low adiponectin concentrations may affect glucose intolerance by increasing insulin resistance and/or β-cell dysfunction( Reference Retnakaran 36 ). Moreover, studies have shown that lower concentrations of adiponectin are associated with adverse maternal clinical outcomes( Reference Hu 6 ), overweight and obesity( Reference Hoffmann, Schulze and Schienkiewitz 7 ).
The ‘common-Brazilian’ DP in this study was positively associated with adiponectin concentrations. This is an adipokine that has anti-atherosclerotic, anti-diabetic and anti-inflammatory properties( Reference Matsuzawa, Funahashi and Kihara 37 ). This result is in agreement with a study conducted in 1922 women from the Nurses’ Health Study, which showed that higher adherence to a healthy DP was positively associated with adiponectin concentrations – that is women classified in the highest quintile of adherence to this DP presented higher median adiponectin concentrations than women in the lowest quintile (5·71 v. 4·34 μg/ml, respectively)( Reference Fargnoli, Fung and Olenczuk 38 ). Furthermore, another study found that non-pregnant diabetic women without history of CVD who showed higher adherence to a ‘Mediterranean’ diet (high intakes of whole grains, monounsaturated fats, fruit and vegetables, and low intakes of red meat, saturated fats and sweets) had higher adiponectin concentrations than those with lower adherence (6·88 v. 5·54 μg/ml)( Reference Mantzoros, Williams and Manson 39 ).
It has been observed that total fibre intake among overweight and obese adults( Reference González-Rodríguez, Solano and González-Martínez 40 ) and in diabetes-free women( Reference AlEssa, Ley and Rosner 41 ) was positively associated with adiponectin concentrations. The ‘common-Brazilian’ DP derived in the present study has a high fibre density, which could be an explanation for the direct association between this pattern and adiponectin concentrations. A possible mechanism for this association is that a diet low in fibre and with a high glycaemic index may increase blood glucose concentrations and at the same time decrease adiponectin concentrations by influencing the regulation of adiponectin expression in adipocytes( Reference Roberts, Berger and Barnard 42 , Reference Qi, Meigs and Liu 43 ).
In the present study, we did not find the association between the ‘common-Brazilian’ DP and glucose (data not shown) and insulin concentrations during pregnancy. In another study, a high-fat diet was associated with elevated plasma insulin concentrations and with fat cell hypertrophy, which may induce leptin resistance( Reference Naderali, Estadella and Rocha 44 ).
A healthy DP may be inversely associated with insulin resistance( Reference Kashino, Nanri and Kurotani 13 ), whereas a processed DP has an important role in leptin concentration regulation that may be due to change in insulin secretion, but in this study we did not find significant results between ‘common-Brazilian‘ DP and insulin concentrations. Many mechanisms act concomitantly on the metabolism. The organism can receive insults that stimulate and others that reduce insulin production, which both can cause a balance or an imbalance in the secretion of this hormone, depending on the stimulus that is most present at the moment. In particular, during pregnancy, insulin exerts a crucial role owing to the need of energy substratum to fetus and varies greatly throughout pregnancy. That way the associations may be attenuated( Reference Ryan and Enns 45 , Reference Sonagra, Biradar and Dattattreya 46 ).
In the present study, a direct association of the highest adherence to the ‘Western’ DP with leptin concentrations was found. It is important to note that although the ‘Western’ DP had a correlation with lower soda intake, which would be a protective factor, it was directly correlated with higher intakes of fast food/snacks and processed meat/bacon, food items considered as risk factors for metabolic and chronic non-communicable diseases( Reference Popkin and Gordon-Larsen 5 ). Possibly the sum of harmful factors from this DP exceeds the protection factor attributed to the low consumption of soda exclusively, as we identified an inverse association of this DP with adiponectin and a positive association with leptin. Furthermore, we found a positive correlation between this DP and dietary lipid (fat) density, and total fat intake has been associated with this biomarker in other studies( Reference Newbern and Freemark 11 ). Leptin is an adipokine that is directly related to body adiposity and insulin resistance and has been associated with the occurrence of metabolic syndrome( Reference Srikanthan, Feyh and Visweshwar 47 ). Several studies have investigated the association between DP and leptin concentrations( Reference Izadi, Saraf-Bank and Azadbakht 12 , Reference Fung, Rimm and Spiegelman 48 ). In this context, a cross-sectional analysis from the Health Professionals Follow-up Study conducted with 466 men revealed that the ‘Western’ DP, considered as ‘unhealthy’ (characterised by higher consumption of red meats, processed meat, French fries, high-fat dairy products, sweets and refined grains), was positively correlated with leptin concentrations (r 0·28, P<0·0001) after adjustment for some confounders, although the association lost significance after adjustment for BMI( Reference Fung, Rimm and Spiegelman 48 ).
There are several limitations that pertain to this study. A well-known limitation of longitudinal studies refers to the follow-up losses. However, losses were not high (22·8 %) and happened mostly at random, besides schooling and alcohol intake. Other limitations are inherent to the instrument used to measure food intake (FFQ), owing to memory bias, under- and over-estimation influenced by the individual capacity to recall the frequency and to quantify retrospectively the food consumed( Reference Scagliusi, Ferriolli and Pfrimer 49 ). In this study, we did not use an FFQ specifically validated for Brazilian pregnant women, because at the time the study was performed (2008–2011) there was no FFQ available. However, this FFQ received a relative validation for Brazilian pregnant women( Reference Giacomello, Schmidt and Nunes 50 ). This validation was performed with Brazilian pregnant women who attended four public health units. There is no gold standard method regarding dietary assessment. That way, a relative QFA validation occurs when it is compared with a more accurate method, as the 24-h recall and food records for example. The FFQ was applied and one 24-h recall was used to compare the nutrient intake estimates. To minimise these limitations, our interviewers received specific training to administer the FFQ and followed standardised procedures. Another limitation of this study is the absence of the oral glucose tolerance test exams during pregnancy for the diagnosis of gestational diabetes mellitus. However, women who self-reported some blood glucose alteration were excluded from the current analysis. Furthermore, the study was conducted in a primary healthcare unit; that is, in this type of general practice just low-risk pregnant women are consulted. High-risk pregnant women are referred to specific medical care. In addition, the participants in the present study did not report the use of any medications affecting metabolism.
Our study also has important strengths. First, the use of a robust statistical method to identify DP with potential to be associated with health outcomes should be highlighted. The RRR method has strengths that should be highlighted in epidemiological studies with aetiological aims, such as the present one. The RRR method allows evaluation of dietary habits considering variability in food intake, as well as in intermediary variables related to the outcome(s) of interest, usually nutrients or biomarkers. This method is more specific than others more commonly used to identify DP, such as the principal component analysis, which explain only the variability in food intake. For this reason the sets of food groups that represent each DP identified by RRR have greater potential to be associated with the health outcomes of interest( Reference Hoffmann, Schulze and Schienkiewitz 7 ). A second strength of this study was the use of LME regression models, a statistical procedure that takes into account the longitudinal nature of the data. Third, the analyses were adjusted for important confounders. Last, to the best of our knowledge, this is the first study that has investigated the association between DP and adiponectin and leptin concentrations evaluated throughout pregnancy.
Conclusion
Our study revealed that higher adherence to the ‘common-Brazilian’ DP was positively associated with adiponectin concentrations. Moreover, higher adherence to the ‘Western’ DP was negatively associated with adiponectin and positively associated with leptin concentrations throughout pregnancy, respectively. We suggest that the ‘common-Brazilian’ pattern seems to contribute to the beneficial serum concentrations of adipokines among healthy Brazilian pregnant women. Given the scarcity of studies evaluating this relationship and the importance of the issue, there is a need for research involving pregnant women in different countries and cultures, as well as the use of more accurate instruments for the identification of DP, thus providing further evidence on this topic.
Acknowledgements
The authors are grateful to all the participants of the cohort study and to Municipal Health Centre Heitor Beltrão for giving us the space and allowing the completion of data collection.
The Carlos Chagas Filho Research Foundation from the State of Rio de Janeiro (FAPERJ) (grant nos E-26/111.400/2010, E-26/110.681/2012; E-26/112.181/2012; E-26/111.698/2013) financially supported the present study. FAPERJ had no role in the design, analysis or writing of this article.
The authors’ contributions are as follows: N. H. A.-S. participated in the interpretation of results and writing of the manuscript. P. G. C., I. E., C. B., E. G. B. and P. M. E. participated in the interpretation of results and writing of the manuscript. G. K. participated in designing the work and reviewed the manuscript. G. K. is a research fellow from the National Council for Scientific and Technological Development (CNPq).
None of the authors has any conflicts of interest to declare.
Supplementary material
For supplementary material/s referred to in this article, please visit https://doi.org/10.1017/S0007114517003580


