


As a necessary mineral element for human and animals, P has several essential functions in nutrient metabolism, bone mineralisation, nucleic acid synthesis and signal transduction( Reference Berndt and Kumar 1 ). P deficiency can cause a reduced feed intake and abnormal skeletal development as well as a retarded growth performance and high mortality in chickens( Reference Webster 2 , Reference Long, Lee and Rowland 3 ). To meet the requirements of fast-growing chicks, adequate dietary non-phytate P (NPP) were added to diets( 4 ). P excess to requirement is excreted in the urine, leading not only to the economic cost but also to the environmental P pollution( Reference Liu, Li and Lu 5 , Reference Liu, Xie and Lu 6 ).
Previous studies in human and rats have shown that vitamin D3 (VD3) plays a vital role in maintaining P homoeostasis, improving intestinal P absorption and stimulating the differentiation and activation of osteoblasts( Reference Chen, Castillo and Korycka-Dahl 7 , Reference Holick, Binkley and Bischoff-Ferrari 8 ) as has been observed in chickens( Reference Peterlik and Wasserman 9 , Reference Mohammed, Gibney and Taylor 10 ). 25-Hydroxycholecalciferol (25(OH)-D3) and 1,25-dihyroxyvitamin D3 (1,25(OH)2-D3) are two biological activated forms of VD3. Many researchers found that VD3 or 1,25(OH)2-D3 could increase bone mineral density and ash content, and reduce leg abnormalities using chickens as a model( Reference Edwards 11 – Reference Rama Rao, Mvln and Reddy 13 ). Broiler chickens have the advantage of short feeding period and share significant genetic conservation with humans( Reference Furlong 14 ). Therefore, broilers have served as an important model for investigating the mechanisms of dietary supplemental VD3 in mediating the regulation of P absorption in the small intestine and P retention in the bone. The type IIb Na-dependent phosphate cotransporter (NaP-IIb) is considered to be responsible for regulating P transport and absorption( Reference Werner and Kinne 15 , Reference Murer, Forster and Biber 16 ). Supplemental 1,25(OH)2-D3 enhanced P absorption by upregulation of NaP-IIb expression in the in situ ligated duodenal loop of broilers( Reference Liao, Suo and Lu 17 ) and in the jejunum of mice( Reference Marks, Srai and Biber 18 ). The type III Na-dependent phosphate cotransporters (PiT), PiT-1 and PiT-2 are reported to be associated with intestinal P absorption and renal P reabsorption in the rats( Reference Collins, Bai and Ghishan 19 ). The PiT mediate P transport by providing P for bone growth and mineralisation( Reference Zoidis, Ghirlanda-Keller and Gosteli-Peter 20 , Reference Suzuki, Ghayor and Guicheux 21 ). Moreover, dietary supplemental 1,25(OH)2-D3 or P deprivation could regulate the PiT-1 and PiT-2 expressions in the parathyroid( Reference Tatsumi, Segawa and Morita 22 ) and intestine( Reference Katai, Miyamoto and Kishida 23 ) of rats. Similar as the cotransporter NaP-IIb, the roles of PiT-1 and PiT-2 in P utilisation have not been studied well in the poultry. We hypothesised that dietary supplementation of VD3 might increase P absorption in the small intestine and utilisation in bone of the fast-growth broiler chickens by regulating NaP-IIb, PiT-1 and PiT-2 expressions. Therefore, the objective of the present study was to test the above hypotheses by investigating the effect of dietary supplemental VD3 on growth performance, serum P content from the hepatic portal vein, tibia ash content, tibia ash P content, tibia P retention rate (TPRR), mRNA and protein expressions of P transporters in the duodenum, jejunum and ileum of broilers.
Methods
Experimental design, animals and diets
All experimental procedures were approved by the Animal Management Committee (in charge of animal welfare issue) of the Institute of Animal Science, Chinese Academy of Agricultural Sciences (IAS-CAAS, Beijing, China) and performed in accordance with the Animals in Research: Reporting In Vivo Experiments (ARRIVE) guidelines for reporting animal research( Reference Kilkenny, Browne and Cuthill 24 ). Ethical approval on animal survival was given by the animal ethics committee of IAS-CAAS. A completed ARRIVE guidelines checklist is included.
A completely randomised design involving in a 2 (dietary NPP contents)×2 (VD3 supplemental levels) factorial arrangement of treatments was used in this study. The two dietary NPP contents were a normal level of 0·45 % and a P-deficient level of 0·23 % (the analysed values were 0·43 and 0·22 %, respectively). The two VD3 supplemental levels were 0 and 87·5 μg/kg of the diet. A total of 384 1-d-old Arbor Acres commercial male broiler chicks (average body weight: 47·3 (sem 0·32) g) were obtained from Huadu Broiler Breeding Corp. The birds were randomly divided into one of four treatments with eight replicate cages of twelve birds per cage for each treatment. In addition, forty-eight birds (four replicate cages of twelve broilers per cage) were assigned a group as the reference group and provided with ad libitum feed containing 0·43 % NPP and supplemental 87·5 μg VD3/kg. To ensure the equal amount of NPP intake in two levels of supplemental VD3, the feed intake of the birds fed diets containing 0·43 % NPP was restricted to 90 % of that of the reference birds (the feeding amount was shown to be eaten up). The feed intake of the birds fed diets containing 0·22 % NPP was restricted to 70 % of that of the reference birds, because our preliminary experiment showed that the feed intake of the birds fed 0·22 % NPP diets was reduced by 20 % compared with that of the birds fed 0·43 % NPP diets. The maize–soyabean-meal basal diet was formulated to meet or exceed National Research Council (NRC)( Reference Long, Lee and Rowland 3 ) requirements of 1–21 d-old broilers for all nutrients except for NPP (Table 1). All diets were fed in mash form.
Table 1 Ingredients and nutrient composition of basal diets for broilers from 1 to 21 d of age (as-fed basis)
VD3, vitamin D3.
* Feed grade.
† Supplied per kg of diet: vitamin A, 4·5 mg; vitamin E, 24 mg; vitamin K, 3·5 mg; thiamin, 3·0 mg; riboflavin, 6 mg; vitamin B6, 3·0 mg; pantothenic acid, 15 mg; cobalamin, 0·018 mg; niacin, 39 mg; biotin, 0·15 mg; folic acid, 1·5 mg and choline (choline chloride), 700 mg; Cu (CuSO4.5H2O), 8 mg; Zn (ZnSO4.7H2O), 60 mg; Fe (FeSO4.7H2O), 80 mg; Mn (MnSO4.H2O), 110 mg; Se (Na2SeO3), 0·15 mg; iodine (KI), 0·35 mg.
‡ VD3 was added to diets by replacing an equal weight of maize starch.
§ These values were determined based on triplicate assays; and other nutrient levels were calculated values.
All birds were housed in an electrically heated, thermostatically controlled room equipped with fibreglass feeders, waterers and stainless steel cages coated with plastics. The birds had free access to tap water, and the room was maintained on a 24 h constant white light (wavelength, 450–465 nm, which would not allow endogenous vitamin D synthesis) schedule throughout the entire experiment. The experiment lasted for 22 d. Mortalities and health status were observed visually and recorded daily throughout the experiment. Body weight and feed intake of birds were measured and corrected for mortality to calculate the average daily gain (ADG), average daily feed intake (ADFI), the ratio of feed:gain (F:G) and mortality of broilers from 1 to 21 d of age.
Sample collections and preparations
After being fed for 2 or 4 h, two birds close to the cage average body weight were selected from each replicate cage at 21 d of age, respectively. Chicks were anaesthetised by injections of sodium pentobarbital (20 mg/kg body weight) through the wing vein. Then the blood was collected aseptically from the hepatic portal vein under anaesthetic, and the serum was obtained after centrifuging at 3000 g for 10 min at 4°C and stored at –20°C for analysis of P content. After the blood sampling, the birds fed for 4 h were killed by cervical dislocation. The duodenum (about 10 cm distal to the pylorus), jejunum (about 10 cm preceding the Meckel’s diverticulum) and ileum (about 10 cm preceding the ileocaecal junction) were separated( Reference Hu, Liao and Wen 25 ). The subsection of each part of the small intestine was flushed gently with 0·1 % diethyl pyrocarbonate and the mucosa samples were scraped with an ice-cold slide and snap-frozen in liquid N2 for analyses of mRNA and protein expressions, respectively. Right tibia was peeled and frozen at –20°C for analyses of the contents of bone ash and bone ash P. Besides, after fasting for 6 or 10 h, another two birds close to the cage average body weight were selected from each replicate cage at 22 d of age, respectively. The serum from the hepatic portal blood, the mucosa from the intestine and the bone from right tibia were collected following the same methods described as above. To reduce individual biological variation, the samples with equal weight from two birds in each replicate cage were pooled into one sample for analyses.
Tibia ash content
All soft tissues of the collected tibia were stripped and then the tibia were dried in an oven at 105°C for 24 h and defatted with fresh diethyl ether for 48 h, and then dried at 105°C for 12 h. The dried defatted bones were weighted and finally ashed in a muffle furnace at 550°C for 16 h. After that, the tibia ash content was expressed relative to a dry defatted tibia weight.
Measurements of crude protein, calcium, total phosphorus and phytate phosphorus
The crude protein contents in feed ingredients and diet samples were analysed with the Kjeldahl method( Reference Thiex, Manson and Andersson 26 ) and Ca contents were determined by an inductively coupled plasma spectroscopy (model IRIS Intrepid II; Thermo Jarrell Ash)( Reference Li, Lin and Lu 27 , Reference Huang, Lu and Xie 28 ). Total P contents in feed ingredients, diet samples and tibia ash were measured colorimetrically using the vanadate–molybdate method( Reference Davies, Andrews and Miller 29 ). Validations of the Ca and total P analyses were conducted concurrently using bovine liver powder (GBW (E) 080193; National Institute of Standards and Technology) as a standard reference material. The actual Ca and P recovery rates for bovine liver powder were both determined to be about 99 % in the present study. Dietary phytate P contents were determined according to the ferric precipitation method as described previously( Reference Rutherfurd, Chung and Morel 30 , Reference Leytem, Kwanyuen and Thacker 31 ). Dietary NPP=dietary total P−dietary phytate P. Serum P contents were determined with molybdenum-blue method according to Goldenberg & Fernandez( Reference Goldenberg and Fernandez 32 ).
Calculation of the tibia phosphorus retention rate
The TPRR was calculated according to the following equation:
 $$\eqalign {{\rm TPRR }\left(\%\right){\equals} 2{\times}({\rm right\ tibia\ ash\ weight }\ \left( {{\rm g\,/\,bird}} \right)\cr {\times}{\rm right\ tibia\ ash\ P\ content }\ \left( {\rm \,\%\,} \right)\right)\cr \,/\,{\rm (total\ dietary\ P\ intake\ (g\,/\,bird))}{\times}{\rm 100}{\rm \,\%\,}{\rm .}$$
RNA extraction, RT and real-time quantitative PCR
Total RNA was isolated using TRIzol reagent (catalogue no. 15596018; Life Technologies) and reversely transcribed into complementary DNA (cDNA) according to the manufacturer’s instructions. The concentration of total RNA was estimated by measuring its optical density at 260 and 280 nm with a spectrophotometer (ND-100; NanoDrop Technologies), and the purity was determined in agarose gels stained with ethidium bromide. In all, 500 ng of total RNA was reversely transcribed into cDNA using PrimeScript™ RT Master Mix (catalogue no. RR047A; TaKaRa Bio Inc.) according to the manufacturer’s instructions. cDNA was used as templates for real-time quantitative PCR amplification using SYBR green master mix (catalogue no. 4367659; Life Technologies) in the ABI 7500 Real-Time PCR machine following the manufacturer’s guidelines. The gene-specific primers for NaP-IIb, PiT-1, PiT-2, β-actin and glyceraldehyde-3-phosphate dehydrogenase (GAPDH) were used as follows: forward CTGGATGCACTCCCTAGAGC, reverse TTATCTTTGGCACCCTCCTG for NaP-IIb (NM_204474.1); forward GCTCGTGGCTTCGTTCTTG, reverse GGACCATTTGACGCCTTTCT for PiT-1 (XM_015297502.1); forward GCAGCAGATACATCAACTC, reverse ATTTCCACTCCACCCTC for PiT-2; forward GAG AAATTGTGCGTGACATCA, reverse CCTGAACCTCTCATTGCCA for β-actin (NM_205528.1); forward CTTTGGCATTGTGGAGGGTC, reverse ACGCTGGGATGATGTTCTGG for GAPDH (K01458.1). Internal reference genes, both β-actin and GAPDH, were constant across the dietary treatment groups, and thus their geometric mean could be used to normalise the expression of the targeted gene. Relative gene expression was calculated using the
 $$2^{{-\Delta \Delta C_{{\rm t}} }} $$
method(
Reference Livak and Schmittgen
33
). All the samples were analysed in triplicates.
$$2^{{-\Delta \Delta C_{{\rm t}} }} $$
method(
Reference Livak and Schmittgen
33
). All the samples were analysed in triplicates.
Western blotting assay
Frozen intestinal mucosal samples (40 mg) were homogenised in 0·5 ml of ice-cold radio immunoprecipitation assay (RIPA) lysis buffer (catalogue no. P0013B; Beyotime Institute of Biotechnology) supplemented with 5 µl of protease inhibitor (catalogue no. B14001; BioTool). The homogenate was centrifuged at 10 000 g for 10 min at 4°C, and the supernatant was collected for total protein determination using a bicinchoninic acid Protein Assay kit (catalogue no. 23225; Pierce). The extracted protein (20 µg) was subjected to electrophoresis on a 10 % SDS-PAGE gel, and then electrotransferred onto the polyvinylidene fluoride membranes (catalogue no. IPVH00010; Merck-Millipore). After the transfer, membranes were blocked for 1 h at room temperature in a blocking buffer with 5 % non-fat milk, and then incubated overnight at 4°C with the following primary antibodies: NaP-IIb (catalogue no. sc-160605; Santa Cruz Biotechnology), PiT-1 (catalogue no. sc-98814; Santa Cruz Biotechnology), PiT-2 (catalogue no. ab64412; Abcam), GAPDH (catalogue no. HX1828; Huaxingbio) and β-actin (catalogue no. HX1827; Huaxingbio). After washing, membranes were incubated with the secondary antibody of goat anti-rabbit (catalogue no. HX2030; Huaxingbio) or goat anti-mouse (catalogue no. HX2032; Huaxingbio) for 1 h at room temperature. The signals were recorded with an Image Quant LAS 4000 scanner (GE Healthcare Life Sciences) by enhanced chemiluminescence using a Super Signal West Pico Trail Kit (catalogue no. 34077; Pierce). Data were presented as the ratio of NaP-IIb or PiT-1 protein band intensity to GAPDH protein band intensity, and the ratio of PiT-2 protein band intensity to β-actin protein band intensity.
Statistical analyses
The calculation of sample size was performed using software PASS 13 (NCSS LLC). In our previous study( Reference Liao, Suo and Lu 17 ), the means of duodenal NaP-IIb mRNA expression levels for control and supplemental VD3 (30 pmol/l) treatments were 0·77 and 1·20 with a pooled se of 0·20. Thus, four replicates per treatment are needed to achieve 80 % power using a two-sided two-sample t test at a significance level of 0·05. Our proposed sample size in this experiment was eight replicates per treatment and should provide an additional power for the multiple comparisons as reported previously( Reference Chow, Wang and Shao 34 ). All data (except for mRNA expressions of the P cotransporters in different small intestinal segments and multiple correlations) were analysed by two-way ANOVA using the general linear model procedure of SAS (version 9.2; SAS Institute Inc.). The model was comprised of the main effects (dietary NPP level and supplemental VD3 level) and interactions between the main effects. The data from mRNA expressions of the P cotransporters in different small intestinal segments were analysed by one-way ANOVA. Multiple correlations between P absorption, utilisation or bone ash and all of the transporter protein levels were analysed using Pearson procedure( Reference Steel, Torrie and Dickey 35 ). The replicate cage of twelve chicks for growth performance or two chicks for other indices served as the experimental unit. Data from mortality were transformed to arcsine for analysis. Differences among means were tested by the least significant difference method, and the statistical significance was set at P≤0·05.
Results
Growth performance and mortality
Dietary NPP level affected (P<0·0001) ADG and ADFI of broilers from 1 to 21 d of age, but did not affect (P>0·13) F:G (Table 2). Dietary supplemental VD3 level did not affect (P>0·32) ADG, ADFI and F:G. However, there was an interaction (P<0·002) between NPP level and VD3 level on the mortality. Compared with the 0·22 % NPP, the 0·43 % NPP increased (P<0·0001) ADG and ADFI. When the broilers were fed diets containing the 0·43 % NPP level, VD3 supplementation had no effect (P>0·83) on mortality of broilers. At dietary 0·22 % NPP level, however, VD3 supplementation decreased (P<0·002) mortality of broilers.
Table 2 Effects of dietary non-phytate phosphorus (NPP) and supplemental vitamin D3 (VD3) levels on growth performance and mortality of broilers from 1 to 21 d of age (Mean values with their standard errors)
ADG, average daily gain; ADFI, average daily feed intake; F:G, feed:gain.
a,b Mean values with unlike superscript letters within the same row are significantly different (P<0·01).
* The levels were determined based on triplicate assays.
† Data represent the mean values of eight replicates of twelve birds each (n 8).
‡ Data represent the mean values of sixteen replicates of twelve birds each (n 16).
Serum phosphorus content from the hepatic portal vein
The serum P contents of the broilers fed for 2 h at 21 d of age or fasting for either 6 or 10 h at 22 d of age were affected (P<0·0001) by dietary NPP level, but not (P>0·22) by supplemental VD3 level (Table 3). The interaction between NPP level and VD3 level was significant (P<0·002) for serum P content of the broilers fed for 4 h at 21 d of age. Compared with the 0·22 % NPP, the 0·43 % NPP increased (P<0·001) serum P contents of the broilers fed for 2 h at 21 d of age or fasting for either 6 or 10 h at 22 d of age. When broilers were fed diets containing the 0·43 % NPP level, supplementation of VD3 had no effect (P>0·36) on serum P content of the broilers fed diets for 4 h. However, when the diets contained the 0·22 % NPP, the addition of VD3 increased (P<0·0005) serum P content of the broilers fed diets for 4 h. Thus, the right tibia and the mucosa of small intestinal segments of broilers fed for 4 h at 21 d of age were used for the further analyses in this study.
Table 3 Effects of dietary non-phytate phosphorus (NPP) and supplemental vitamin D3 (VD3) levels on phosphorus contents in serum from the hepatic portal vein of broilers at 21 or 22 d of age (Mean values with their standard errors)
a,b,c Mean values with unlike superscript letters within the same row are significantly different (P<0·005).
* The levels were determined based on triplicate assays.
† Data represent the mean values of eight replicates of two birds each (n 8).
‡ Data represent the mean values of sixteen replicates of two birds each (n 16).
§ Data were from the hepatic portal vein of broilers at 21 d of age.
∥ Data were from the hepatic portal vein of broilers at 22 d of age.
Tibia ash, ash phosphorus and phosphorus retention rate
Both dietary NPP level and supplemental VD3 level affected (P<0·05) the TPRR of broilers at 21 d of age (Table 4). The interactions between NPP level and VD3 level were substantial (P<0·02) for tibia ash and ash P. Compared with the 0·22 % NPP, the 0·43 % NPP decreased (P=0·001) TPRR. In contrast, dietary VD3 supplementation increased (P=0·034) TPRR. When broilers were fed the diets containing the 0·43 % NPP level, no differences (P>0·70) in tibia ash and ash P were observed in the broilers fed diets with or without addition of VD3. However, when broilers were fed the diet containing the 0·22 % NPP, the addition of VD3 increased (P<0·004) tibia ash and ash P.
Table 4 Effects of dietary non-phytate phosphorus (NPP) and supplemental vitamin D3 (VD3) levels on tibia ash, ash phosphorus and phosphorus retention rate of broilers at 21 d of age (Mean values with their standard errors)
a,b,c Mean values with unlike superscript letters within the same row are significantly different (P≤0·05).
* The levels were determined based on triplicate assays.
† Data represent the mean values of eight replicates of two birds each (n 8).
‡ Data represent the mean values of sixteen replicates of two birds each (n 16).
§ Data are expressed on a dry and defatted weight basis of tibia.
Type IIb sodium-dependent phosphate cotransporter and type III sodium-dependent phosphate cotransporter-1, 2 mRNA expressions in the duodenum, jejunum and ileum
The NaP-IIb mRNA expressions in the duodenum and jejunum of broilers at 21 d of age were affected by (P<0·008) dietary NPP level, but not (P>0·31) by supplemental VD3 level (Table 5). The interaction between NPP level and VD3 level was significant (P<0·0001) for the NaP-IIb mRNA expression in the ileum. Compared with the 0·22 % NPP, the 0·43 % NPP led to a decline (P<0·001) in the NaP-IIb mRNA expressions in the duodenum and jejunum. When broilers were fed the diet containing the 0·43 % NPP level, VD3 supplementation did not affect (P>0·40) the NaP-IIb mRNA expression in the ileum. At dietary 0·22 % NPP level, however, VD3 supplementation increased (P<0·001) the NaP-IIb mRNA expression in the ileum. In addition, the NaP-IIb mRNA expressions were higher (P<0·001) in the duodenum than in the jejunum and ileum of all broilers. No difference (P>0·25) was detected between the jejunum and ileum for broilers in other three groups except for the broilers fed the diet containing the 0·22 % NPP level with no addition of VD3, which had greater (P<0·05) NaP-IIb mRNA expressions in the jejunum than in the ileum.
Table 5 Effects of dietary non-phytate phosphorus (NPP) and supplemental vitamin D3 (VD3) levels on type IIb sodium-dependent phosphate cotransporter (NaP-IIb) mRNA expression levels in small intestinal segments of broilers at 21 d of age* (Mean values with their standard errors)
RQ, relative quantity.
a,b,c Mean values with unlike superscript letters within the same row are significantly different (P<0·0001).
A,B,C Mean values with unlike superscript letters within the same column are significantly different (P<0·0001).
*
NaP-IIb mRNA abundance was calculated as the RQ of NaP-IIb mRNA to the geometric mean of β-actin and GAPDH mRNA, and RQ=
$$2^{{-\Delta \Delta C_{{\rm t}} }} $$
(C
t=threshold cycle).
† The levels were determined based on triplicate assays.
‡ Data represent the mean values of eight replicates of two birds each (n 8).
§ Data represent the mean values of sixteen replicates of two birds each (n 16).
Dietary NPP level, supplemental VD3 level and their interaction had no effect (P>0·6) on the PiT-1 mRNA expression in the ileum of broilers at 21 d of age (Table 6). However, the NPP level and VD3 level had interactive effects (P<0·03) on the PiT-1 mRNA expressions in the duodenum and jejunum. When broilers were fed the diet containing the 0·43 % NPP level, dietary supplemental VD3 level did not affect (P>0·20) the PiT-1 mRNA expressions in the duodenum and jejunum. However, when broilers were fed the diet containing the 0·22 % NPP level, the addition of VD3 reduced (P<0·05) the PiT-1 mRNA expressions in the duodenum and jejunum. In addition, the PiT-1 mRNA expressions were higher (P<0·04) in the duodenum and ileum than in the jejunum of all broilers. However, no difference (P>0·25) was detected between the duodenum and ileum for broilers in other three groups except for the broilers fed the diet containing the 0·22 % NPP level with no addition of VD3, which had greater (P<0·05) PiT-1 mRNA expression in the duodenum than in the ileum.
Table 6 Effects of dietary non-phytate phosphorus (NPP) and supplemental vitamin D3 (VD3) levels on type III sodium-dependent phosphate cotransporter 1 (PiT-1) mRNA expression levels in small intestinal segments of broilers at 21 d of age* (Mean values with their standard errors)
RQ, relative quantity.
a,b Mean values with unlike superscript letters within the same row are significantly different (P<0·05).
A,B Mean values with unlike superscript letters within the same column are significantly different (P<0·05).
*
PiT-1 mRNA abundance was calculated as the RQ of PiT-1 mRNA to the geometric mean of β-actin and GAPDH mRNA, and RQ=
$$2^{{-\Delta \Delta C_{{\rm t}} }} $$
(C
t=threshold cycle).
† The levels were determined based on triplicate assays.
‡ Data represent the mean values of eight replicates of two birds each (n 8).
§ Data represent the mean values of sixteen replicates of two birds each (n 16).
Dietary NPP level affected (P<0·009) the PiT-2 mRNA expression in the duodenum, but had no effects (P>0·18) on the PiT-2 mRNA expressions in the jejunum and ileum of broilers at 21 d of age (Table 7). Dietary supplemental VD3 level affected (P<0·03) the PiT-2 mRNA expression in the jejunum, but had no effects (P>0·51) on the PiT-2 mRNA expressions in the duodenum and ileum. No interactions (P>0·34) were observed between NPP level and VD3 level for the PiT-2 mRNA expressions in the small intestinal segments. Compared with the 0·22 % NPP, the 0·43 % NPP increased (P<0·01) the PiT-2 mRNA level in the duodenum. Dietary supplemental VD3 increased (P<0·03) the PiT-2 mRNA expression in the jejunum. In addition, the PiT-2 mRNA expressions were higher (P<0·05) in the jejunum and ileum than in the duodenum, but no difference (P>0·24) was detected between the jejunum and ileum.
Table 7 Effects of dietary non-phytate phosphorus (NPP) and supplemental vitamin D3 (VD3) level on type III sodium-dependent phosphate cotransporter 2 (PiT-2) mRNA expression levels in small intestinal segments of broilers at 21 d of age* (Mean values with their standard errors)
RQ, relative quantity.
a,b Mean values with unlike superscript letters within the same row are significantly different (P<0·05).
A,B Mean values with unlike superscript letters within the same column are significantly different (P<0·05).
*
PiT-2 mRNA abundance was calculated as the RQ of PiT-2 mRNA to the geometric mean of β-actin and GAPDH mRNA, and RQ=
$$2^{{-\Delta \Delta C_{{\rm t}} }} $$
(C
t=threshold cycle).
† The levels were determined based on triplicate assays.
‡ Data represent the mean values of eight replicates of two birds each (n 8).
§ Data represent the mean values of sixteen replicates of two birds each (n 16).
Type IIb sodium-dependent phosphate cotransporter and type III sodium-dependent phosphate cotransporter-1, 2 protein expressions in the duodenum, jejunum and ileum
The NaP-IIb protein expressions in the duodenum and ileum of broilers at 21 d of age were affected (P<0·01) by dietary NPP level, but not (P>0·03) by supplemental VD3 level (Fig. 1(A) and (C)). There was an interaction (P=0·002) observed between NPP and VD3 levels on the NaP-IIb protein expression in the jejunum. Compared with the 0·22 % NPP level, the 0·43 % NPP level increased (P<0·001) the NaP-IIb protein expressions in the duodenum and ileum (Fig. 1(A) and (C)). Dietary supplemental VD3 level did not affect (P=0·0521) the NaP-IIb protein expression in the jejunum when broilers were fed the diet containing the 0·43 % NPP level. However, the supplementation of VD3 increased (P=0·0076) the NaP-IIb protein expression in the jejunum when broilers were fed the diet containing the 0·22 % NPP level (Fig. 1(B)).
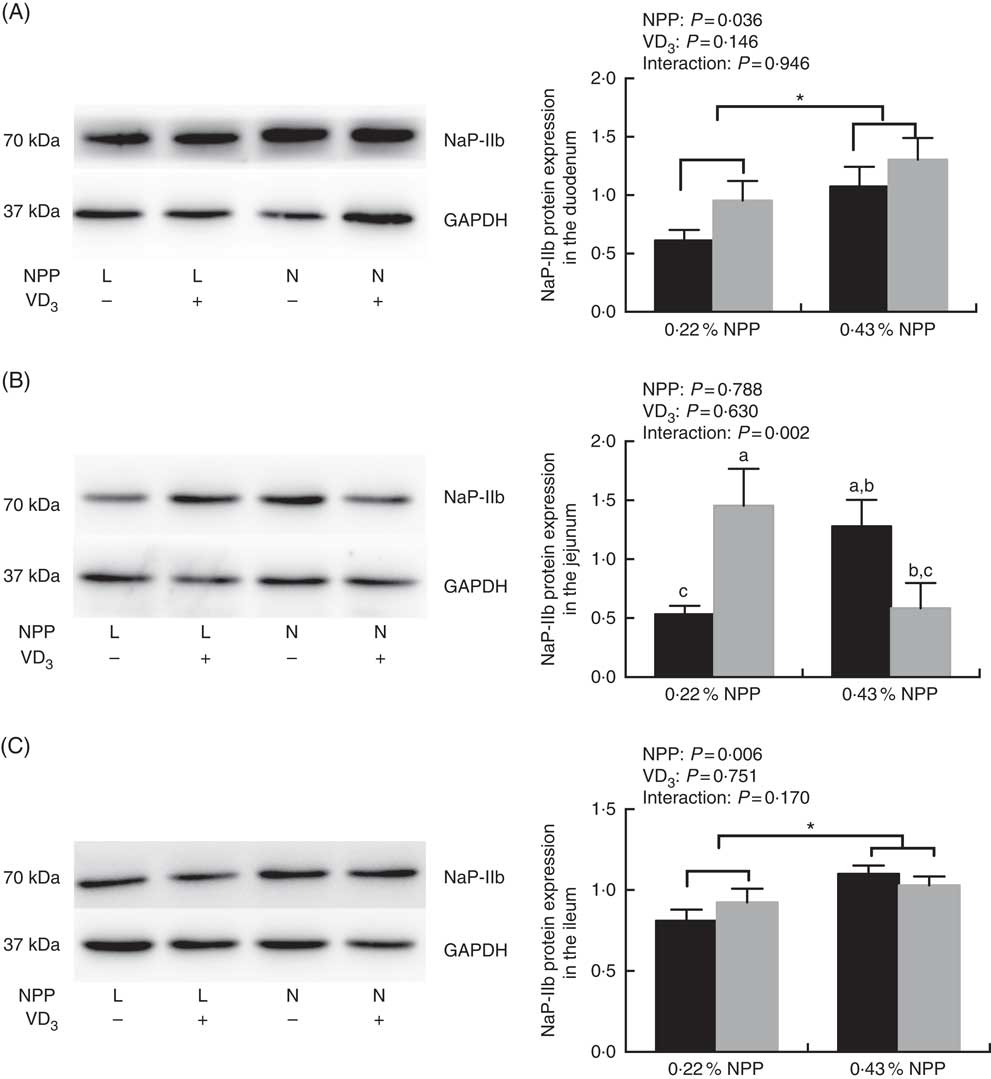
Fig. 1 Effects of dietary non-phytate phosphorus (NPP) and supplemental vitamin D3 (VD3) levels on type IIb sodium-dependent phosphate cotransporter (NaP-IIb) protein levels in small intestinal segments of broilers at 21 d of age. (A) The protein concentrations of NaP-IIb in the duodenum. (B) The protein concentrations of NaP-IIb in the jejunum. (C) The protein concentrations of NaP-IIb in the ileum. Glyceraldehyde-3-phosphate dehydrogenase (GAPDH) was used as a loading control. Values are mean (n 8), with their standard errors represented by vertical bars. a,b,c Based on the two-way ANOVA analyses, mean values with unlike letters were significantly different at P<0·05 between single bars (n 8) as determined by their interaction. * Mean values were significantly different at P<0·05 between group bars (n 16) as determined by a main effect of dietary NPP levels. L, low level of NPP (0·22 %); N, normal level of NPP (0·43 %). –, No addition of VD3; +, dietary supplemental 87·5 μg VD3/kg. ![]() , 0 μg/kg VD3;
, 0 μg/kg VD3; ![]() , 87·5 μg/kg VD3.
, 87·5 μg/kg VD3.
Dietary NPP level affected (P=0·034) the PiT-1 protein expression in the ileum (Fig. 2(C)), but had no effect (P>0·25) on the PiT-1 protein expression in the duodenum of broilers at 21 d of age (Fig. 2(A) and (C)). Dietary supplemental VD3 affected (P=0·01) the PiT-1 protein expression in the duodenum, but had no effect (P>0·95) on the PiT-1 protein expression in the ileum (Fig. 2(A) and (C)). There was an interaction (P=0·01) between NPP and VD3 levels on the PiT-1 protein expression in the jejunum. Compared with the diet with 0·22 % NPP level, the 0·43 % NPP level decreased (P<0·001) the PiT-1 protein expression in the ileum (Fig. 2(C)). Dietary VD3 supplementation increased (P=0·01) the PiT-1 protein expression in the duodenum. When broilers were fed the diet containing the 0·43 % NPP level, dietary supplemental VD3 did not affect (P=0·117) the PiT-1 protein expression in the jejunum. At dietary 0·22 % NPP level, however, the PiT-1 protein expression in the jejunum was greater (P=0·03) in broilers fed diets with supplemental VD3 than without supplemental VD3 (Fig. 2(B)).
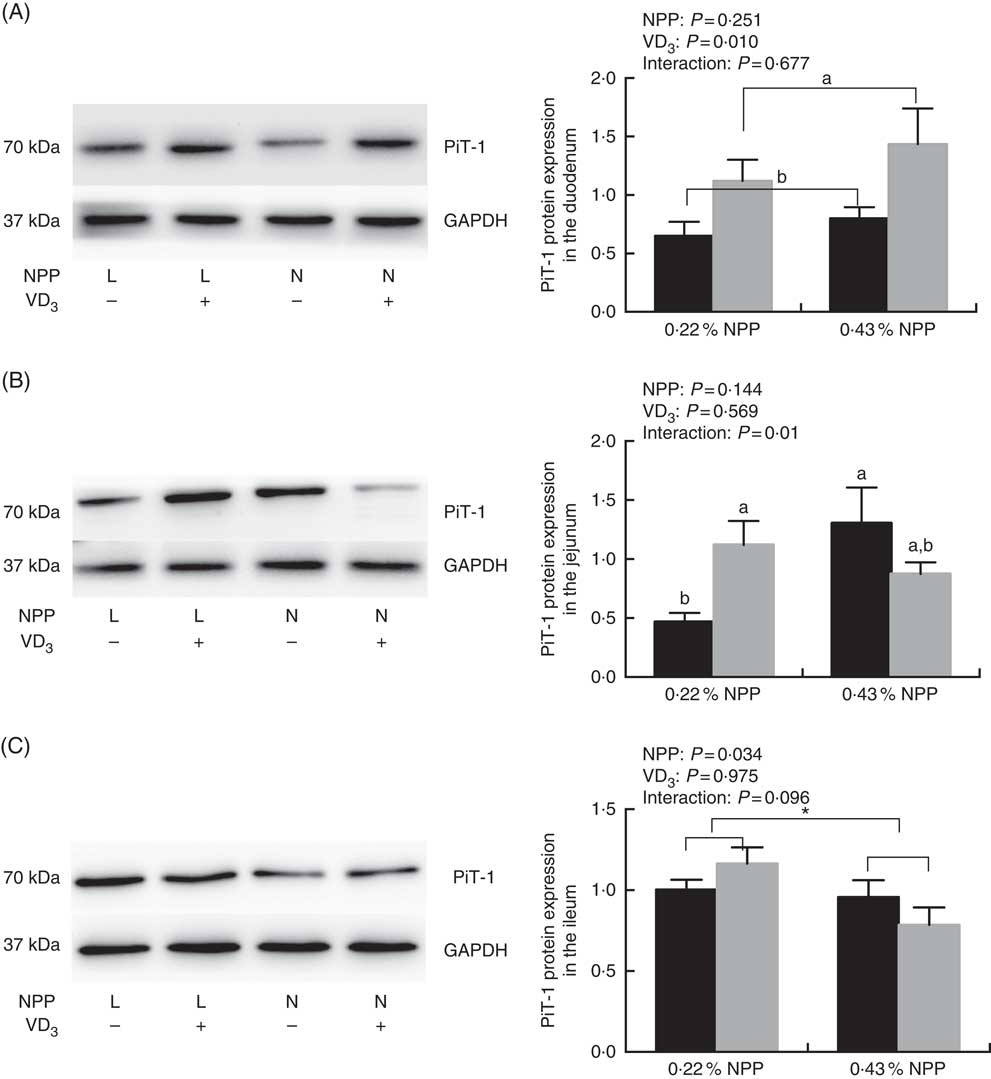
Fig. 2 Effects of dietary non-phytate phosphorus (NPP) and supplemental vitamin D3 (VD3) levels on type III sodium-dependent phosphate cotransporter 1 (PiT-1) protein levels in small intestinal segments of broilers at 21 d of age. (A) The protein concentrations of PiT-1 in the duodenum. (B) The protein concentrations of PiT-1 in the jejunum. (C) The protein concentrations of PiT-1 in the ileum. Glyceraldehyde-3-phosphate dehydrogenase (GAPDH) was used as a loading control. Values are mean (n 8), with their standard errors represented by vertical bars. a,b Based on the two-way ANOVA analyses, mean values with unlike letters were significantly different at P<0·05 between single bars (n 8) as determined by their interaction or between group bars (n 16) as determined by a main effect of supplemental VD3 levels. * Mean values were significantly different at P≤0·05 between group bars (n 16) as determined by a main effect of dietary NPP levels. L, low level of NPP (0·22 %); N, normal level of NPP (0·43 %). –, No addition of VD3; +, dietary supplemental 87·5 μg VD3/kg. ![]() , 0 μg/kg VD3;
, 0 μg/kg VD3; ![]() , 87·5 μg/kg VD3.
, 87·5 μg/kg VD3.
Dietary NPP level affected (P<0·05) the PiT-2 protein expressions in the jejunum and ileum (Fig. 3(b) and (c)), but had no effect (P=0·734) on the PiT-2 protein expression in the duodenum of broilers at 21 d of age (Fig. 3(a)). Dietary supplemental VD3 level did not affect (P>0·45) the PiT-2 protein expressions in all small intestinal segments (Fig. 3(a)–(c)). No interactions (P>0·45) were observed between NPP level and VD3 level for the PiT-2 protein expression in all small intestinal segments. Compared to diets with the 0·22 % NPP level, the 0·43 % NPP level decreased (P<0·05) the PiT-2 protein expression in the jejunum and ileum (Fig. 3(b) and (c)).
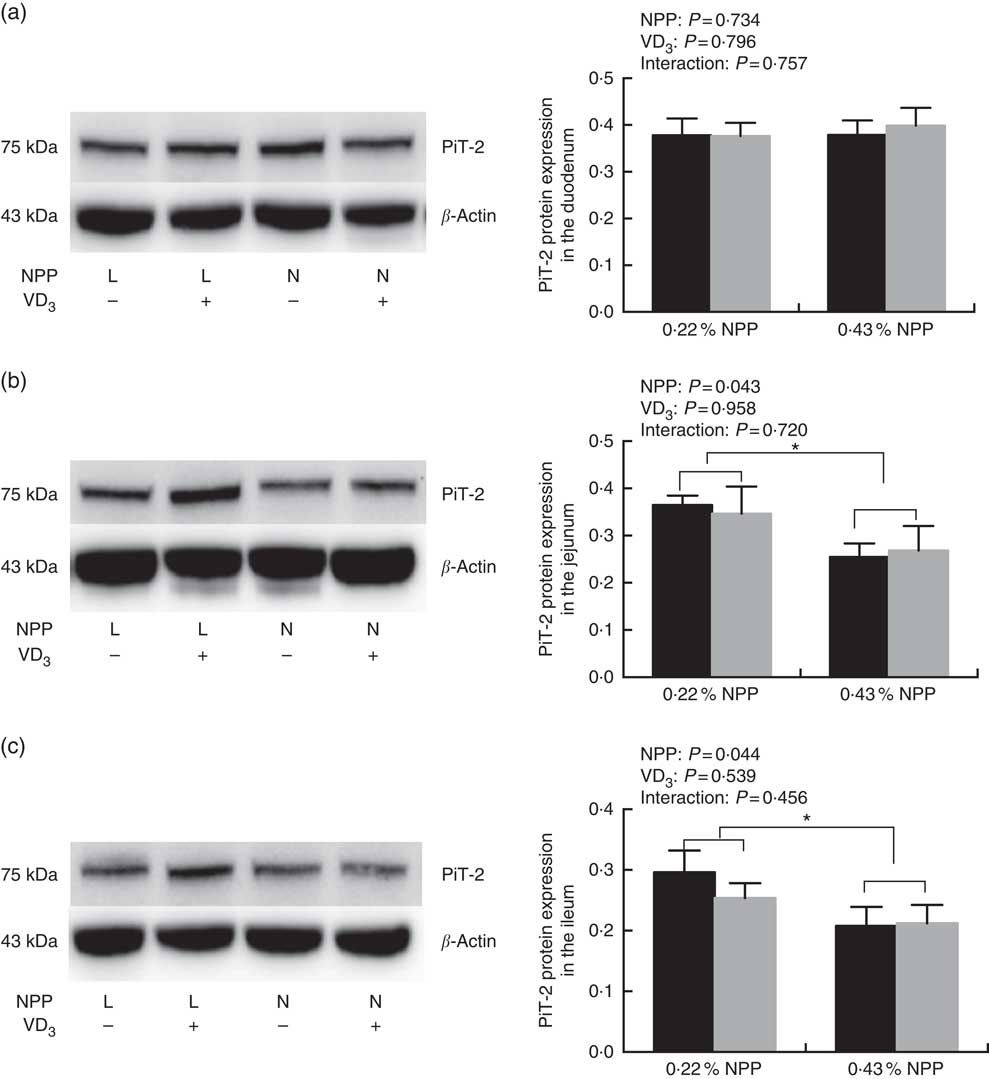
Fig. 3 Effects of dietary non-phytate phosphorus (NPP) and supplemental vitamin D3 (VD3) levels on type III sodium-dependent phosphate cotransporter 2 (PiT-2) protein levels in small intestinal segments of broilers at 21 d of age. (a) The protein concentrations of PiT-2 in the duodenum. (b) The protein concentrations of PiT-2 in the jejunum. (c) The protein concentrations of PiT-2 in the ileum. β-Actin was used as a loading control. Values are mean (n 8), with their standard errors represented by vertical bars. * Based on the two-way ANOVA analyses, mean values were significantly different at P<0·05 between group bars (n 16) as determined by a main effect of dietary NPP levels. L, low level of NPP (0·22 %); N, normal level of NPP (0·43 %). −, No addition of VD3; +, dietary supplemental 87·5 μg VD3/kg. ![]() , 0 μg/kg VD3;
, 0 μg/kg VD3; ![]() , 87·5 μg/kg VD3.
, 87·5 μg/kg VD3.
Multiple correlations between phosphorus absorption, utilisation or bone ash and all of the transporter protein levels in the duodenum, jejunum and ileum
The correlation coefficients between the serum P, the tibia ash P or tibia ash and the protein levels of transporters (NaP-IIb, PiT-1 and PiT-2) in three small intestinal segments of broilers fed 0·22 % NPP diets were shown in Table 8. The serum P content exhibited positive correlations with the PiT-1 protein expressions in the duodenum (r 0·519, P=0·04) and jejunum (r 0·741, P=0·004), but had no correlations (P>0·05) with other transporters. The tibia ash P was positively correlated with NaP-IIb protein expression (r 0·675, P=0·016) and PiT-1 protein expression (r 0·553, P=0·05) in the jejunum. In addition, no correlations (P>0·10) were observed between tibia ash and all of the transporters.
Table 8 Correlations between phosphorus absorption, utilisation or bone ash and all of the transporter protein levels of in small intestinal segments of broilers fed 0·22 % non-phytate phosphorus (NPP) diets†
NaP-IIb, type IIb Na-dependent phosphate cotransporter; PiT-1, type III Na-dependent phosphate cotransporter 1; PiT-2, type III Na-dependent phosphate cotransporter 2.
* P<0·05,
** P<0·01.
† Data represent the correlation coefficients (r) between P absorption, utilisation or bone ash and all of the transporter protein levels in small intestinal segments of broilers fed 0·22 % NPP diets with or without supplemental VD3 (n 16).
Discussion
The requirement of NPP for fast-growing broilers from 1 to 21 d of age was 0·45 % of feed as recommended by the NRC( Reference Long, Lee and Rowland 3 ). However, it is reported that the restriction of dietary NPP (<0·45 %) in diets could result in a lower growth performance in broilers and laying hens( Reference Webster 2 , Reference Long, Lee and Rowland 3 , Reference Li, Yuan and Guo 36 – Reference Hamdi, Lopez-Verge and Manzanilla 38 ). In the present study, the reductions in ADG and ADFI were observed in the broilers fed diets containing 0·22 % NPP level, which confirmed the results of previous studies. In addition, the high mortality of the broilers fed P-deficient diets without supplemental VD3 could be caused by the extreme differences in the Ca:P ratio (4·5 Ca:NPP) of the low P diets. Supplemental VD3 did not influence the growth performance of broilers in despite of the dietary NPP level, which was inconsistent with the previous observation( Reference Fritts and Waldroup 12 ). One possible explanation is that the increased P absorption and utilisation by VD3 might be not sufficient enough to increase the gain of broilers. In addition, the growth rate (gain) is generally not a very sensitive index in reflecting dietary P absorption and utilisation since it is affected by many other factors except for P, such as the feed intake and so on. In the present study, broilers were restrictedly fed the same amount of feed intake especially under the low-P diets with or without VD3 supplementation, which restricted the gain of broilers. Furthermore, a previous study has also shown that 1,25(OH)2-D3 or 1α-hydroxycholecalciferol (1α-OH D3) increased the contents of bone ash and plasma P and decreased the incidence of P rickets, but had no effect on the body weight of broilers fed diets containing a low level of NPP( Reference Edwards 39 ).
Dietary P absorbed from the small intestine is transported to liver via the hepatic portal vein and distributed finally into all organs for the body utilisation( Reference Chun, Bamba and Suyama 40 ). Therefore, the serum P content from the hepatic portal vein would reflect the dietary P level, and could be used to evaluate the P absorption in the small intestine of broilers. In the present study, the broilers fed the diets containing the 0·43 % NPP level had a higher serum P content than those fed the P-deficient diet, indicating that the absorption of P in the small intestine increased with the dietary NPP levels. This is consistent with the results reported in previous studies in which the concentration of serum inorganic P responded very quickly to the dietary NPP levels from 0·24 to 0·40 %( Reference Gardiner 41 , Reference Abudabos 42 ). In addition, we found that the serum P content was enhanced indeed by VD3 addition in the broilers fed diets containing 0·22 % NPP, demonstrating that supplementation of VD3 in a NPP deficient diet is capable of improving the P absorption of broilers. The improvement of P absorption could be associated with the enhanced P transport from the intestinal brush border membrane to intracellular stimulated by supplementation of 1,25(OH)2-D3 ( Reference Matsumoto, Fontaine and Rasmussen 43 , Reference Lee, Walling and Corry 44 ). Furthermore, an increase in serum P concentration was observed in the broilers fed the diet with supplementation of 1α-OH D3 ( Reference Edwards 39 , Reference Han, Yang and Zhang 45 ). However, we found that the feed intake was higher in the broilers fed diets with supplementation of 1α-OH D3 than with no addition of 1α-OH D3 in their studies( Reference Edwards 39 , Reference Han, Yang and Zhang 45 ), and the P intake could be different due to the variable feed intake. Therefore, it may be inaccurate to evaluate the effect of VD3 or 1α-OH D3 on P transport and absorption based on the serum P content from birds that are not pair fed. To get rid of this shortcoming, the broilers fed the diets with or without supplementation of VD3 were offered an equal amount of P intake in our current study. The results showed that addition of VD3 in the diets had no influence on serum P content in the broilers fed for 2 h or fasting for 6 and 10 h, suggesting that the effect of VD3 on serum P content from the hepatic portal blood was associated with the status of digestive physiology. The digestion and absorption of P in the small intestine could not be completed in broilers fed for 2 h( Reference Birger 46 ), while the blood P might be cleared partly and controlled within a narrow physiological range through feedback mechanisms in broilers fasting more than 6 h with no P intake( Reference Veum 47 ).
Tibia ash is one of the most sensitive criteria for evaluation of dietary P utilisation( Reference Nelson 48 ). Low dietary P level could decrease the bone ash content and bone strength, and increase the incidence of osteoporosis in layers( Reference Webster 2 ). In the present study, when broilers were fed the low NPP diets (0·22 % NPP), tibia ash and tibia ash P increased with dietary supplementation of VD3. These results demonstrated that VD3 had a positive effect on P utilisation in bones of the broilers fed the P deficient diets. Consistent with our study, previous studies demonstrated that dietary 1α-OH D3 supplementation, as an analogue of VD3, increased the contents of tibia ash and tibia ash P in broilers( Reference Edwards 39 , Reference Han, Yang and Zhang 45 , Reference Biehl and Baker 49 – Reference Snow, Baker and Parsons 51 ). In addition, the TPRR was also enhanced by supplementation of VD3, which further demonstrated that VD3 indeed played an important role in promoting P retention and utilisation in broilers. However, low dietary P level also resulted in greater tibia P retention, which may be due to greater efficiency of use of P by these birds through more efficient utilisation of phytate P which is known to occur in low P diets( Reference Onyango, Asem and Adeola 52 ).
The NaP-IIb is a well-known protein that plays a pivotal role in P transport through apical membrane of the small intestinal epithelial cells( Reference Edwards 11 , Reference Hilfiker, Hattenhauer and Traebert 53 , Reference Liu, Hu and Liao 54 ). Radanovic et al. ( Reference Radanovic, Wagner and Murer 55 ) concluded that low P intake was an important stimulating factor for NaP-IIb expression. It was very interesting that the low level of NPP caused an up-regulation of NaP-IIb mRNA expressions in the duodenum and jejunum but down-regulation of NaP-IIb protein expressions in the duodenum and ileum. The above differences between mRNA expression and protein expression may be a function of the time of sample collection. The selected time for analyses of tibia and mucosa assays was based on the time (after 4 h of feeding) at which differences were detected in serum P levels. However, there may be a delayed response for protein expression. Therefore, if protein expression were measured at 6 h, the same differences would be expected. In addition, a post-transcriptional regulatory mechanisms including glycosylation or ubiquitination may be also involved in the NaP-IIb protein expression induced by P deficiency in this study( Reference Saddoris, Fleet and Radcliffe 56 ), but it needs to be investigated further. Hu et al. ( Reference Hu, Liao and Wen 25 ) reported that a higher dietary NPP level promoted intestinal P absorption by increasing NaP-IIb protein expression, which was consistent with our results. Besides, dietary supplemental VD3 enhanced NaP-IIb protein expression in the jejunum of the broilers fed the low NPP diets, suggesting that the increased absorption and utilisation of P induced by supplemental VD3 might be partially associated with the enhanced NaP-IIb protein expression. Similarly, it is reported that VD3 could increase the NaP-IIb protein abundance in the upper small intestine of mouse( Reference Marks, Srai and Biber 18 , Reference Hattenhauer, Traebert and Murer 57 ).
In addition to the NaP-IIb, PiT-1 and PiT-2 are shown to serve as Na+-dependent P cotransporters in several tissues( Reference Biber, Custer and Magagnin 58 – Reference Custer, Spindler and Verrey 60 ). However, the regulatory effect of VD3 on intestinal PiT-1 and PiT-2 expressions has not been studied extensively in animals. In the current study, dietary supplemental VD3 decreased the PiT-1 mRNA level by 34 %, but increased the PiT-1 protein level by 138 % in the jejunum of broilers fed the low NPP diets. Tatsumi et al. ( Reference Tatsumi, Segawa and Morita 22 ) reported that the administration of 1,25(OH)2-D3 inhibited PiT-1 mRNA expression in the jejunum of vitamin D-deficient rats, but the PiT-1 protein abundance was not determined in their study. Given the potential for translation rate, post-translational modification, compartmentalization, etc. of the protein, mRNA levels are not always correlated with protein levels( Reference Liu, Beyer and Aebersold 61 ). Since the mRNA is eventually translated into functional proteins, the protein level may be more indicative of the functioning of the transporters than mRNA level. Therefore, the upregulation of PiT-1 protein expression by supplemental VD3 may partially enhance P absorption and utilisation. In addition, it is reported that the PiT-2 is likely to be involved in intestinal P influx by targeting to the basolateral membrane in the jejunal epithelial cells of rats( Reference Marks, Srai and Biber 18 ). However, we did not observe an increase in PiT-2 protein expression in all small intestinal segments, suggesting that the PiT-2 might be unlikely to be involved in intestinal P absorption of broilers.
It is likely that one or two of the above transporters may be involved in the enhanced P absorption and utilisation by VD3 supplementation in broilers fed a low NPP diet. The analyses of multiple correlations showed the relative contribution of each transporter and each section of the gut towards the P absorption and utilisation. It is suggested that the PiT-1 in the jejunum could be the most important transporter for P absorption and utilisation, while the NaP-IIb transporter in the jejunum and the PiT-1 in the duodenum might be just partially involved in P absorption and utilisation. Besides, the distribution of the above transporters in each section of the small intestine was different in the present study. The NaP-IIb mRNA abundance was greater in the duodenum than in the jejunum and ileum, which was in accordance with the results published previously( Reference Hu, Liao and Wen 25 , Reference Yan, Angel and Ashwell 62 ). However, the higher PiT-2 abundances were observed in the jejunum and ileum than in the duodenum. Because the activity of these transporters is highly dependent on luminal pH( Reference Bai, Collins and Ghishan 63 ), the variations in mRNA abundances of these transporters observed in different segments of the small intestine may be associated with the status of digestive physiology in each segment such as luminal pH. To explore the functional mechanism of the transporters in P absorption and utilisation, further studies appeared to be needed using the molecular techniques such as the method of gene silencing.
In conclusion, dietary supplemental VD3 decreased the mortality of P-deficient broilers and increased P absorption in the intestine, as well as promoted P utilisation in bone via upregulating protein expressions of PiT-1 in the duodenum and NaP-IIb and PiT-1 in the jejunum from the P-deficient broilers. Overall, this study would be of important theoretical and practical significances for providing a nutritional strategy and mechanisms to promote P absorption and utilisation for animals, and reduce the dietary inorganic P addition and environmental pollution caused by P emissions in broiler production.
Acknowledgements
The authors would highly appreciate Dr Lin Xi in the North Carolina State University for assisting with the English polishing of this manuscript.
The present study was supported by the Key Program of the National Natural Science Foundation of China (project no. 31630073; Beijing, P. R. China), the National Nonprofit Institute Research Grant (2016ywf-yb-8; Beijing, P. R. China), the Special Funds of CAAS for Distinguished Scientists (Beijing, P. R. China), the Basic Research Program of Science and Technology (project no. 2014FY111000; Beijing, P. R. China), the National Natural Science Foundation of China (project no. 31472116; Beijing, P. R. China), the National Key R&D Program of China (project no. 2017YFD0502200; Beijing, P. R. China), the China Agriculture Research System (project no. CARS-41; Beijing, P. R. China), and the Agricultural Science and Technology Innovation Program (ASTIP-IAS08; Beijing, P. R. China).
The authors’ contributions are as follows: X. L. designed the experiment; Y. S. drafted the manuscript; X. Lu. and X. Li. participated in writing and editing the manuscript; Q. W. and S. Z. conducted most of the experiments and analysed the data; L. Z. and L. L. performed the P analysis; X. Lu. and X. Li. had the primary responsibility for the final content. All authors have read and approved the final version of the manuscript.
The authors have no financial or personal conflicts of interests to declare.


