

The water quality within fish farming systems can vary substantially according to a multitude of biotic (e.g. stocking density, feeding rates, microbial loading) and abiotic (e.g. temperature, aeration and water turnover rates) factors. The dissolved oxygen (DO) concentration and temperature are important water quality variables that affect fish metabolism and health( Reference Brett 1 – Reference Wang, Lefevre and Thanh Huong 5 ), and the level of DO can change rapidly because of biotic and abiotic factors. Diurnal fluctuations in DO due to photosynthesis, increasing temperature and varying water exchange in net cages or flow through systems are probably one of the most pronounced water-quality changes most farmed fish endure( Reference Davis 6 – Reference Remen, Oppedal and Imsland 8 ). Low DO levels are likely to occur during intensive fish VO2 associated with feed ingestion and digestion( Reference Jordan and Steffensen 9 – Reference Tirsgaard, Moran and Steffensen 12 ). In addition, partial DO depletion or intermittent hypoxia can be amplified at night when phytoplanktons switch from photosynthesis to respiration( Reference Taylor and Miller 13 ). Furthermore, water exchange through sea net cages varies according to the tidal currents, and slack tides lead to stagnant water periods four times per day. Fish producers in Norway, Chile, Canada and Australia have reported intermittent sub-optimum environmental conditions for salmonid fish production( Reference Carter, Katersky and Barnes 2 ); however, the impact of temporary diurnal DO limitations on fish physiology is not often studied( Reference Farrell and Richards 14 ).
Chronic sub-lethal hypoxia can cause growth reduction due to reduced appetite, alteration of metabolic pathways, re-allocation of energy resources, poor assimilation efficiency and prolonged digestion( Reference Wang, Lefevre and Thanh Huong 5 ). Davis( Reference Davis 6 ) summarised DO threshold levels for rainbow trout (Oncorhynchus mykiss) at various temperatures (8–20°C) and animal sizes (larva-1·1 kg), and concluded that the effective threshold was in the range of 50–64 % DO saturation (DOsat). Below this level, blood was less oxygenated, circulatory changes such as a slowing heart frequency occur along with reduction of maximum swimming speed, altered RQ, elevated breathing amplitude and elevated buccal pressure( Reference Kramer 4 , Reference Randall and Smith 15 – Reference Kutty 20 ). Compared with our understanding about respiratory physiology, much less is known about how chronic or intermittent hypoxia affects digestion and growth in fish. Low oxygen conditions have been observed to alter the specific dynamic action (SDA) of digestion and nutrient assimilation( Reference Wang, Lefevre and Thanh Huong 5 ).
The production of 1 kJ of energy via ammonotelic catabolism of protein theoretically requires 2·5 mg more O2 than lipid and 7 mg more O2 than glucose( Reference Heldmaier and Neuweiler 21 ), which might mean that protein is metabolised differentially according to DO availability. From an aquaculture perspective, it is more desirable to utilise dietary amino acids for somatic growth rather than as a metabolic fuel source. Carter et al. ( Reference Carter, Katersky and Barnes 2 ) summarised the strategic needs to study interactions between diet composition and environmental parameters, and suggested that protein metabolism needs particular attention to maximise growth under limiting environmental conditions. This has led to research into special application feeds for ‘challenging’ conditions such as waters with suboptimal temperature and DO levels( Reference Carter, Katersky and Barnes 2 , Reference Glencross 22 – Reference Glencross, Blyth and Irvin 25 ). The idea behind such feeds is that the loss of fish condition normally associated with challenging environments (e.g. diurnal fluctuations in DO levels) can be compensated for by tuning the dietary macronutrient and micronutrient compositions. In this study, we attempt to broaden our understanding of fish protein metabolism under diurnal DO variations at different temperatures using juvenile rainbow trout as a model species.
Methods
Experimental fish and diets
Before experimentation, animal ethics approval was obtained. Juvenile rainbow trout (weight=64·9 (sd 6·0) g) were purchased from the Forellenzucht Trostadt GbR hatchery (Trostadt, Germany). The experimental fish were acclimated to six respirometer tanks (described below) for 3 weeks before the experiment while being fed a standard commercial diet (Skretting Optiline HE, 4·0 mm, macro nutrient profile: crude protein 43·0 %, crude fat 26·0 %, ash 6·0 %, fibre 3·0 %) at 12°C. During the acclimation period, fish were fed by hand in order to determine the absolute amount of feed the animals could ingest. The maximum ingestion quantity was determined to be 1·37 (sd 0·45) % of body weight (BW), and this information was used to set the 1 % BW ration size in the experiment, a portion size that was completely consumed with no wastage. In trial two, experimental fish groups were fed once per day with isoenergetic diets of varying protein content produced at Skretting ARC Technology Plant (Stavanger, Norway). Table 1 gives the feed composition of the two experimental diets. The standard protein (SP) diet with 42·5 % crude protein was similar to existing commercial diets, whereas the high-protein (HP) diet contained 49·5 % crude protein. The HP diet was formulated to be isoenergetic with the SP diet by lowering the fat and starch contents and increasing wheat gluten inclusion (Table 1). Diets were designed to meet amino acid needs of the animals( 26 ). Feeding of the entire daily ration started at 10.00 hour in tank 1 and continued stepwise (12 min for each tank) until all tanks were fed.
Table 1 Nutrient composition, digestible energy, ingredients and chemical composition of the test diets. Pellet size 4 mm

SP, standard protein; HP, high protein; AA, amino acids.
* Recommendation from NRC( 26 ).
Chemical analysis of the diet
Almost all chemical feed analyses were performed in the Skretting ARC Laboratory, Stavanger. DM was quantified gravimetrically by drying the feed for 18 h at 105°C. A Kjeltec 2400 Auto System (FOSS Analytical) was used to determine total nitrogen (N) content for calculating protein content (N×6·25). NMR (Maran Ultra NMR; Resonance Instruments Ltd) was used for measuring fat concentration. Starch content was determined according to Mcleary et al.( Reference Mcleary, Gibson and Solah 27 ), and crude fibre content was determined according to ISO 6865 (ISO 2000). Gross energy was measured in a (isoperibol) bomb calorimeter (Parr 1281) at Nofima BioLab (Fyllingsdalen, Norway).
Experimental setup
For each diet, three replicate tanks were used.
Temperature phases
The experiment was divided into three, 16-d rearing temperature phases (TP) (12, 16 and 20°C, as illustrated in Fig. 1). The sequential testing of temperature over time rather than simultaneous testing of temperature alongside other variables was a constraint imposed by the experimental setup with one water body in the re-circulating respirometer system. Temperature acclimation from 12 to 16°C and 16 to 20°C was performed in 1°C/d increments over 4 d.

Fig. 1 Experimental setup for the three temperature phases (12, 16 and 20°C): 4 d of acclimation; 5 d of unmanipulated oxygen (UO) period; 5 d of manipulated oxygen (MO) period; 1 d of fasting; and 1 d of weighing/biomass reduction (BM). Arrows indicate the time of down- and up-regulation of dissolved oxygen saturation during the periods. ![]() , 08.00–16.00 hours;
, 08.00–16.00 hours; ![]() , 16.00–08.00 hours;
, 16.00–08.00 hours; ![]() , dissolved oxygen (DO) manipulation.
, dissolved oxygen (DO) manipulation.
Oxygen periods
Unmanipulated oxygen period
Following temperature acclimation, 5 d of respirometer measurements were performed at the maximum tank water inflow rate (300 litres/h).
Manipulated oxygen period
Following the unmanipulated oxygen (UO) period, 5 d of respirometer measurements were performed with decreased nightly water inflow, which created a partial low oxygen challenge for the fish.
To maintain a comparable circular current in the test tanks, an additional pump was installed( Reference Stiller, Moran and Vanselow 28 ). The target oxygen level during the manipulated oxygen (MO) period was 40–50 % DOsat, which corresponded to water inflow of 150, 200 and 225–250 litre/h at 12, 16 and 20°C, respectively. The low oxygen challenge was initiated at 16.00 hour using electronic controllers to decrease water inflow. At 08.00 hour the next morning, the water flow rates were increased using the controllers. Once the MO period was completed, fish were fasted for a day and then individual and bulk weighing was performed (Fig. 1).
Fish and biomass
At the start of every experimental TP, the tank biomass was adjusted to approximately 3·70 kg via the removal of individuals following individual and bulk weighing. At the beginning of the experiment (12°C), there were fifty fish with a mean weight of 73·4 (sd 13·0) g/tank, which was decreased to forty-two fish with a mean weight of 90·2 (sd 21·8) g at 16°C and thirty-five fish with a mean weight of 105·5 (sd 30·0) g/tank at 20°C, respectively.
Fish husbandry and respirometer system
The experiment was performed in a re-circulating aquaculture respirometer system designed for growth studies, which is described in detail by Stiller et al.( Reference Stiller, Moran and Vanselow 28 , Reference Stiller, Moran and Vanselow 29 ). The system consisted of ten tanks (250 litres volume each), of which seven were used for the current experiment, and included mechanical (sedimentation) and biological (trickling filter) water treatment units. The system utilises a flow-through approach to measure respiration, where the water metabolite concentration of each tank is measured sequentially by a suite of water chemistry analysers. Respiration rates are calculated on the basis of differences between test and reference tank metabolite values and water flow rates, with a correction to account for the washout effect. Details about the methods used to calculate respiration rates are given in the study by Stiller et al.( Reference Stiller, Moran and Vanselow 28 ).
The water chemistry analysis unit measured the following parameters: oxygen (O2) concentration (amperometric electrode, dTRANS O2 01; JUMO GmbH & Co. KG), water pH (intermediate junction electrode, Ionode IJ44; TPS Pty Ltd), temperature (thermocouple), total ammonia nitrogen (TAN) (loop flow orthophtalaldehyde fluorometric autoanalyser, µMac; SYSTEA S.p.A.) and dissolved carbon dioxide (CO2) (flow through headspace analyser with non-dispersive IR detection; SubCtech GmbH). Analysers were calibrated daily. Daily data acquisition included twelve measurements per day and tank, corresponding to a 2-h measuring cycle in which every tank was measured successively. The data from six tanks containing fish are presented in this study. Nitrite (mg/l) (Microquant; Merck KGaA) concentration and hardness (°dH) (Aquamerck; Merck KGaA) of the re-circulating water body were recorded daily using commercial test kits.
Growth performance
Individual body wet weight and whole-tank wet weight (biomass; g) were determined on day 0, 16, 32 and 48, which corresponded to the TP intervals (Fig. 1). All growth performance data were calculated using tank biomass measurements to minimise the error associated with summing multiple individual measurements. This sampling regimen enabled testing of the effects of time/temperature and diet on growth, but not oxygen period. After weighing the individuals of a particular tank, the group was placed in a different tank to account for any tank-specific effects. Trout were anaesthetised using tricaine methanesulphonate (MS-222; Sigma-Aldrich) before the weighing procedure started. Specific growth rate (SGR, % weight gain per day) was calculated from the tank biomass using the formula SGR=(ln(end biomass)−ln(start biomass))/16 d×100. Feed conversion ratio (FCR) was calculated using the mass of food ingested and group weight as FCR=feed intake (g)/weight gain (g).
Metabolic data
VO2 and TAN excretion rates were calculated according to the difference between the tanks housing fish and the fishless reference tank (including microbial background respiration), along with a correction to account for the washout effect, as outlined in Stiller et al.( Reference Stiller, Moran and Vanselow 28 ). The metabolic rates of a measuring cycle were normalised to a daily specific calculated metabolic BW (MBW) and expressed as mg/h per kg0·8 ( Reference Cho and Kaushik 30 – Reference Killen, Atkinson and Glazier 32 ). Average daily MBW was estimated via interpolation from the weights recorded at the beginning and at the end of each TP, the daily feed intake and FCR as follows:
 $${\rm MBW}\,{\equals}\,\left( {{{\displaystyle{\rm (feed}\,{\rm intake}\,{\rm previous}\,{\rm day}\,{\rm (kg)}/ {\rm FCR} \atop\displaystyle{\plus}{\rm biomass}\,{\rm previous}\,{\rm day}\,{\rm (kg))/}}}\ \atop\displaystyle{{\rm Number}\,{\rm of}\,{\rm fish}\,{\rm in}\,{\rm the}\,{\rm tank}}}} \right)^{\!\!\!\!{{\minus}0\cdot{\rm 8}}}\!\!\!\!\!\!\!.$$
The degree of protein utilisation for energy metabolism was estimated using the ammonia quotient (AQ)( Reference Stiller, Vanselow and Moran 33 ):
 $${\rm AQ\,{\equals}\,Excreted}\,{\rm TAN}\,({\rm mol}){\rm /consumed}\,{\rm O}_{{\rm 2}} \,({\rm mol}){\rm ,}$$
where AQ values of 0·27 and 0 correspond to 100 and 0%, respectively, of aerobic energy demand (estimated protein fuel use) met by amino acid catabolism( Reference Gnaiger 34 ).
The last day of the 5-d DO period was used for calculating VO2 and TAN excretion to allow for the maximum acclimation period. The mean values between 22.00–02.00 and 10.00–14.00 hours were used for direct comparison between the UO and the MO period of the experiment as these time blocks had the most constant readings within a diurnal curve of metabolite measurements and deemed best for quantitative comparison for day and night response.
Energy budget
All presented values of the energy budget (EB) were calculated using data collected from the 5th day of each oxygen period (see the ‘Oxygen periods’ section and Fig. 1) and expressed in kJ/kg0·8per d based on an ‘as-fed’ diet. Calculations of the EB components are as follows.
VO2 and TAN excretion rates were derived from eight measurements taken from a 16-h period (12.00–16.00 and 18.00–06.00 hours), a period that represented the bulk of metabolic activity associated with digestion and assimilation. The eight measurements were used to derive a mean daily VO2 and TAN excretion rate to standardise the time period format. Data collected during periods of maintenance and husbandry activity were excluded for both oxygen periods from the data set as these activities led to inaccurate metabolic measurements. These activities included tank cleaning (06.00–08.00 hours), up-regulation of water flow (08.00–10.00 hours), feed administration (10.00–12.00 hours) and down-regulation of water flow (16.00–18.00 hours).
Gross energy intake per d
 $${\rm Gross\,energy\,intake\,per\,d}\,{\equals}\,\left{{{\rm GE}_{{{\rm diet}}} \,({\rm kJ/g}){\times}{\rm FI}\,{\rm (g/d)}} \over {{\rm MBW}\,({\rm kg}^{{{\minus}0\cdot{\rm 8}}} )}}.$$
Digestible energy intake
 $${\rm Digestible\,energy\,intake\,(DE_{in})\,per\,d}\,{\equals}\,\left{{{\rm DE}_{{{\rm diet}}} \,({\rm kJ/g}){\times}{\rm FI}\,{\rm (g/d)}} \over {{\rm MBW}\,({\rm kg}^{{{\minus}0{\cdot{\rm 8}}}})}};$$
Digestible energy (DEdiet)=19·8 (sd 0·2) kJ/g; HP=19·8 (sd 0·5) kJ/g. Digestible energy was calculated from the energy contents of food and faeces and by applying the indicator (Y) method according to Dietz et al.( Reference Dietz, Stiller and Griese 35 ). Faeces were collected by stripping after the main experiment. Because of limited fish numbers, the DEdiet was only determined at 16°C. Analyses of dietary, faecal energy and Y were undertaken at Nofima BioLab (Fyllingsdalen, Norway) and at Skretting ARC (Stavanger, Norway), respectively.
Energy of non-faecal nitrogen
Energy of non-faecal nitrogen (EN) is defined as the sum of branchial and urinary energy. In this study, EN was calculated as TAN excretion plus an estimated fraction of total nitrogen lost as urea (85 %:15 % NH3:urea), the ratio of which was taken from the literature( Reference Dosdat, Metailler and Tetu 36 – Reference France and Kebreab 38 ). The energetic value of this nitrogen mix (24·6 kJ/g) was derived from the energetic equivalents of the individual components (N=24·9 kJ/g and urea N=23·1 kJ/g) and their estimated contributions( Reference Dietz, Stiller and Griese 35 ).
Metabolisable energy
 $${\rm Metabolisable\,energy\,(ME)}\,{\equals}\,\left{\rm DE_{in}−EN.}$$
Specific dynamic action
In this study, the additional fasting day that was measured at the end of every TP (see Fig. 1) was used to define the baseline metabolism without the costs imposed by the SDA. To derive the VO2 associated with the SDA, ‘the mean daily VO2 rate at fasting’ was subtracted from ‘the mean daily VO2 rate at the 5th day of the UO/MO period (feeding VO2 rates)’ (see Fig. 1). For every TP, ‘the mean daily VO2 rate at fasting’ was derived in the same way as ‘the feeding VO2 rates’ (see above for excluded data for the mean daily VO2 rates). The energetic value was derived by using the conversion factor of 13·6 kJ/g consumed O2 ( Reference Elliott and Davison 39 ).
Retained energy
 $${\rm Retained\,energy} \ (\rm RE)\,{\equals}\,\left{\rm ME\,−\, SDA\,−\,energy\,\,for\,\,maintenance.}$$
The energetic costs of the SDA and maintenance were derived by multiplying the appropriate daily VO2 value (g/d) for each term by a conversion factor (13·6 kJ/g consumed O2)( Reference Dietz, Stiller and Griese 35 ).
Statistical analysis
The software package R( 40 ) was used to statistically evaluate the data. According to the recommendations of Thorarensen et al. ( Reference Thorarensen, Kubiriza and Imsland 41 ), data evaluation was based on an appropriate mixed model( Reference Laird and Ware 42 , Reference Verbeke and Molenberghs 43 ). The data were modelled as normally distributed and heteroscedastic. The model included diet (SP, HP), temperature (12, 16, 20°C), time of day (day, night) and oxygen condition (UO, MO), as well as all their interaction terms (2-, 3- and 4-fold), as fixed factors. The fish group and its interaction with time of day were regarded as random factors. In addition, the interactions of the measurement values due to the several levels of experimental day were taken into account. The model was used to investigate differences between treatments via ANOVA and multiple contrast tests( Reference Schaarschmidt and Vaas 44 , Reference Bretz, Hothorn and Westfall 45 ). For the growth variables and whole-body analysis, the same repeated measures approach was used, with a simplified model only including diet, temperature and their interaction term as a fixed factor. Digestibility data were compared using a t test. For all statistical analyses, differences were considered to be significant at P<0·05.
Results
Water quality variables
With the exception of DO concentrations, the water quality during the trial was maintained in a state that would be considered as not harmful for fish health or growth. Nitrite values ranged between 0·2 and 0·3 mg/l, hardness between 5·5 and 8·3°dH, pH between 6·0 and 8·1( Reference Hjeltnes, Bæverfjord and Erikson 46 ), dissolved CO2 <8·2 mg/l( Reference Good, Davidson and Welsh 47 ) and TAN <0·4 mg/l( Reference Hjeltnes, Bæverfjord and Erikson 46 , Reference Schreckenbach 48 ). Fig. 2 gives an overview of the daily pattern of DO concentrations and TAN concentrations of the tanks throughout the trial. The DO tank concentrations decreased substantially with increasing temperature for both the UO period and the MO period as a result of lowered O2 solubility at elevated temperatures. Consequently, DO concentrations at the maximum water inflow of 300 litre/h varied between the three TP, even though the feeding rate and biomass were almost constant for each TP. The effect of a down-regulation of water inflow at 16.00 hour during the MO period can be seen as an abrupt decrease in DO concentration (Fig. 2). The daily pattern of TAN concentration in the test tanks shows a clear increase in NH3 after the 10.00 hour feeding, and was consistently higher for the HP diet (Fig. 2). At the 16 and 20°C TP, TAN concentrations slightly increased over the experimental days. The representative DO concentrations at the last (5th) day of each DO period (08.00–16.00 hours) were

Fig. 2 Dissolved oxygen (DO) and total ammonia nitrogen (TAN) concentrations in the test tanks stocked with rainbow trout fed a standard protein diet (SP=42·5 % crude protein) and a high-protein diet (HP=49·5 % crude protein). Data were recorded at three temperatures and under an unmanipulated oxygen period and a manipulated oxygen period. Fasting days are also reported. ![]() , DO SP diet;
, DO SP diet; ![]() , DO HP diet;
, DO HP diet; ![]() , TAN SP diet;
, TAN SP diet; ![]() , TAN HP diet.
, TAN HP diet.
UO=7·6±0·3 mg/l (70 % DOsat); MO=7·2±0·3 mg/l (70 % DOsat) at 12°C,
UO=5·7±0·2 mg/l (60 % DOsat); MO=5·4±0·2 mg/l (60 % DOsat) at 16°C and
UO=4·6±0·1 mg/l (50 % DOsat); MO=4·1±0·2 mg/l (50 % DOsat) at 20°C (Fig. 2).
At night (16.00–08.00 hours), the DO values were
UO=7·7±0·2 mg/l (70 % DOsat); MO=5·0±0·3 mg/l (50 % DOsat) at 12°C,
UO=6·1±0·3 mg/l (60 % DOsat); MO=4·5±0·2 mg/l (50 % DOsat) at 16°C and UO=4·7±0·2 mg/l (50 % DOsat); MO=3·4±0·2 mg/l (40 % DOsat) at 20°C.
There were no obvious differences in fish behaviour observed at the different DO periods or TP.
Growth performance
As growth data were only evaluated within the TP, it was not possible to compare growth rates between the UO period and the MO period. Within each TP, the type of diet did not lead to any significant differences in weight gain, SGR or FCR (all comparisons P>0·05). Despite a lack of difference between diets, there were clear differences over time as the fish grew and were exposed to different TP. The SGR decreased from 1·11 to 0·71–0·75 %/d, and the FCR increased from 0·78 to 1·20–1·27 (Table 2).
Table 2 Comparison of growth parameters of rainbow trout fed the standard protein (SP; 42·5 % crude protein) diet and the high-protein (HP; 49·5 % crude protein) diet for three temperature phases (Mean values and standard deviations)

WG, weight gain; FI, feed intake; SGR, specific growth rate; FCR, feed conversion ratio.
*Significantly different between temperature blocks within a diet. No significant differences were detected between the diets within each temperature period (P<0·05).
† Based on individual fish measurements.
‡ Based on whole-tank biomass measurements.
Metabolic variables
Oxygen
Fig. 2 summarises the diurnal pattern in DO concentration throughout the experiment. The large changes in DO concentration within each temperature block shown in Fig. 2 are due to spontaneous activity associated with feeding and SDA, and the effect of fasting is evident in all profiles as a drastic increase in DO concentration. Elevated temperatures were seen to decrease the DO concentration. The DO concentration profiles of the two diets broadly overlapped; however, at 12°C, the HP diet was generally below the SP diet (Fig. 2).
Table 3 compares the day and night mass-specific VO2 on the final feeding day of each of the two DO periods and the three TP. Temperature had a strong effect on VO2 (F 2,40=39·7, P<0·01), where a 4°C rise in temperature led to an increase in VO2 of approximately 20 mg/kg0·8 per h, which was equivalent to a 25–30 % elevation. The DO period was also observed to have a significant effect on VO2 (F 1,40=4·4, P=0·04). There was a general trend for a 3–14 % higher mean VO2 in the MO period compared with the UO period for the same diet and time of day; however, the differences were only statistically significant at 16°C for both diets and at 20°C for the SP diet (see Table 3). By comparing the night-time DO periods for the SP diet, there was 11 % higher VO2 in the MO period for 16 and 20°C. This difference in VO2 could not be detected for trout fed the HP diet, where the highest difference was 6 %. Overall, the statistical model did not detect a significant difference between daytime and night-time VO2 (F 1,4=5·7, P=0·08). As was observed in the continuous time plot of Fig. 2, the mean VO2 of fish fed the SP diet tended to be lower (0–8 %) than that of fish fed the HP diet under equivalent conditions (Table 3); however, this difference was not statistically significant (F 1,4=3·2, P=0·15). All two- and three-way interaction terms for VO2 were non-significant (P>0·28).
Table 3 Mass-specific VO2 (mg/kg0·8 per h) of rainbow trout fed a standard protein diet (SP=42·5 % crude protein) and a high-protein diet (HP=49·5 % crude protein) under an unmanipulated oxygen (UO) period and a manipulated (MO) periodFootnote † (Mean values and standard deviations)
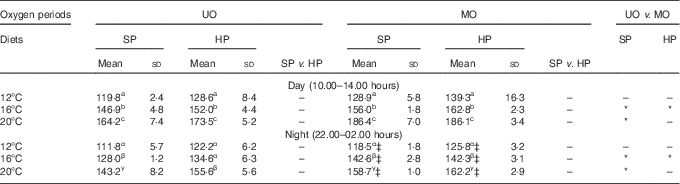
a,b,c for day, α,β,γ for night: mean values within a column with unlike superscript letters are significantly different, and between-column differences are shown with * (P<0·05).
† Data are divided into daytime (10.00–14.00 hours) and night-time (22.00–02.00 hours) measurements. Day and night data were used from the 5th day of the UO and MO periods from every temperature phase. Values are means of triplicate tanks measured on the 5th day of each test regimen. Dissolved oxygen saturation in the test tanks: UO day and night and MO day: 12°C=70 %, 16°C=60 %, 20°C 50 %.
‡ MO night: 12°C=50 %, 16°C=50 %, 20°C=40 %.
Ammonia
Fig. 2 summarises the diurnal pattern in TAN concentration in the test tanks throughout the experiment. The protein concentration difference of the two diets at 1 % BW feeding had a noticeable effect on TAN concentration in the tanks, and thus protein usage in catabolism. Before feeding, TAN concentration was at its lowest daily value. After feeding at 10.00 hour, TAN increased steadily for 8–10 h until it peaked at approximately twice the pre-feeding value. TAN concentration in the tanks was consistently higher for fish fed the HP diet. The decreasing values during fasting led to equally low values between the diets (Fig. 2).
NH3 excretion rate was standardised to VO2 rate to derive the AQ and estimated protein catabolism rates without urea and other N-fractions. Table 4 compares the day and night AQ on the final feeding day of each of the two DO periods and the three TP. Night-time AQ values were consistently higher (Table 4) and significantly different to daytime AQ values (F 1,4=81·8, P<0·01), reflecting the elevated nightly TAN excretion observed in Fig. 2. Statistical analyses indicated that temperature had a significant effect on AQ (F 2,38=7·1, P<0·01), DO period had a significant effect on AQ (F 1,38=5·9, P=0·02) and temperature and DO period had a significant interaction (F 2,38=13·4, P<0·01). The catabolic protein fuel use tended to be lowest at 16°C and higher at 12 and 20°C (Table 4). Low nightly DO concentrations tended to not significantly increase the rate of protein fuel use at 12 and 20°C. Statistically significant differences in DO period were only detected at 16°C, where the manipulated DO regimen increased AQ from 15·8–26·7 to 19·0–30·3 % (corresponding to an 8–17 % relative increase, Table 4). Temperature and time of day also had a significant interaction (F 2,38=5·5, P<0·01), where the highest AQ values for each diet were recorded at night-time at the highest temperature (Table 4). Comparison of the AQ shown in Table 4 suggests that diet had a marked and consistent effect on protein fuel use, as within each temperature and DO period trout fed the HP diet consistently used more protein for aerobic metabolism compared with the SP diet. Statistical analyses confirmed that dietary protein content of the diet had a significant effect on the AQ (F 1,4=36·0, P<0·01), and post hoc testing indicated that the significant differences were mainly present during the night; however, the interaction term for diet and time of day (F 1,4=5·7, P=0·08) was not significant at a 0·05 threshold. The metabolic protein usage was 30–40 % higher for fish fed the HP diet compared with the SP diet over the test temperature range. Other than those already mentioned, no other two- or three-way interaction terms were significant (P>0·25).
Table 4 Estimated protein fuel use (% of energy aerobic energy expenditure) of rainbow trout fed a standard protein diet (SP=42·5 % crude protein) and a high-protein diet (HP=49·5 % crude protein) under an unmanipulated oxygen (UO) and manipulated oxygen (MO) periodFootnote † (Mean values and standard deviations)
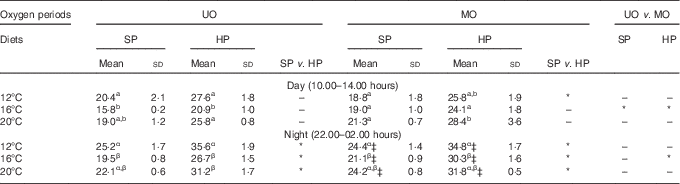
a,b,c for day, α,β,γ for night: mean values within a column with unlike superscript letters were significantly different, and between-column differences are shown with * (P<0·05).
† Data are divided into daytime (10.00–14.00 hours) and night-time (22.00–02.00 hours) measurements. Values are mean of triplicate tanks measured on the 5th day of each test regimen. Dissolved oxygen saturation in the test tanks: UO day and night and MO day: 12°C=70 %, 16°C=60 %, 20°C 50 %.
‡ MO night: 12°C=50 %, 16°C=50 %, 20°C=40 %.
Energy budget
Energy of non-faecal nitrogen
Diet had a significant effect on energy of EN (F 1,4=334·8, P<0·01), which was 26–34 % higher for the HP diet compared with the SP diet. Temperature had a significant effect on EN (F 2,20=136·8, P<0·01), and temperature and DO period had a combined significant interaction (F 2,20=36·1, P<0·01). Although there was no substantial change in EN between 12 and 16°C, there was a 20–26 % increase between 16 and 20°C. The DO period did not have a significant effect on EN (F 1,20=3·4, P<0·08) and no other two- or three-way interaction terms were significant (P>0·09) (Table 5).
Table 5 Energy budget (kJ/kg0· 8 per d) of rainbow trout fed a standard protein diet (SP, 42·5 % crude protein) and a high-protein diet (HP, 49·5 % crude protein) under an unmanipulated oxygen (UO) period and a manipulated oxygen (MO) periodFootnote † (Mean values and standard deviations of triplicate feeding groups)

GEin, gross energy intake; DEin, digestible energy intake; EN, energy of non-faecal nitrogen; ME, metabolisable energy; SDA, relative specific dynamic action; RE, retained energy.
* Significantly different for diet and oxygen period (P<0·05).
† The experiment was divided into three rearing temperature phases (12, 16 and 20°C). Data were used from the fifth measurement day of each oxygen period at the three temperatures. Calculated values presented as mean from eight measurements taken over a 16-h period (12.00–16.00 and 18.00–06.00 hours; see ‘Energy budget’ section for details). The energy budgets were calculated with the diet as-fed. Dissolved oxygen concentrations in the test tanks were as follows: UO and MO day 12°C=70 %, 16°C=60 %, 20°C=50 %, MO night: 12°C=50 %, 16°C=50 %, 20°C=40 %.
Metabolisable energy
Statistical analysis indicated that diet (F 1,4=60·4, P<0·01), temperature (F 2,20=194·0, P<0·01), DO period (F 1,20=166·6, P<0·01), and temperature and DO period interaction (F 2,20=26·3, P<0·01) had a significant effect on the resulting ME. The ME was approximately 1 % lower for the HP diet, it decreased by 1–4 % between 12 and 20°C, and was 1–3 % higher during the MO period. No other variables or two- or three-way interaction terms were significant (P>0·29) (Table 5).
Specific dynamic action
Although the SDA tended to be lower for the SP diet, none of the analysed variables had a significant effect on SDA (P>0·06). The SDA during the MO period was 22 % (12°C), 23 % (16°C) and 42 % (20°C) higher for the SP diet and 10 % (12°C), 13 % (16°C) and 18 % (20°C) for the HP diet compared with the UO period (Table 5).
Retained energy
Diet (F 1,4=13·3, P=0·02) and temperature (F 2,20=17·2, P<0·01) had a significant effect on RE; however, the DO period did not differ (F 1,20=0·3, P=0·59). The RE data showed a large decrease (13–15 %) between 12 and 20°C, and the HP diet resulted in 3–7 % lower RE than the SP diet. All other variables and interactions had no significant effect on RE (P>0·17) (Table 5).
The EB data are represented in Fig. 3, which compare the metabolised and retained energy when the data are normalised to the quantity of digestible energy consumed( Reference Azevedo, Young Cho and Leeson 31 ). The normalised RE decreased markedly with increasing temperature (a maximum 12 % absolute decrease), whereas normalised ME only decreased slightly (<1 %) over the same range (Fig. 3). Although the MO period tended to result in lower normalised ME and RE, diet was observed to have a larger effect. The HP diet consistently resulted in approximately 1 % lower normalised ME and RE (1–4 %) values compared with the SP diet (Fig. 3).

Fig. 3 Metabolisable energy (ME) and retained energy (RE) as percentage (ME/DE×100 and RE/DE×100) of digestible energy (DE) of rainbow trout fed a standard protein diet (SP=42·5 % crude protein) and a high-protein diet (HP=49·5 % crude protein) reared under an unmanipulated oxygen (![]() ) period and a manipulated oxygen (
) period and a manipulated oxygen (![]() ) period. Values are calculated as means between 12.00 and 06.00 hours from the 5th day of each oxygen period and experimental temperature. Significant differences (P<0·05) between group means for diet and oxygen period for each temperature are shown with horizontal bars.
) period. Values are calculated as means between 12.00 and 06.00 hours from the 5th day of each oxygen period and experimental temperature. Significant differences (P<0·05) between group means for diet and oxygen period for each temperature are shown with horizontal bars.
Discussion
The experiment described in the present study used the common approach( Reference Remen, Oppedal and Imsland 8 , Reference Glencross 22 , Reference Tran-Duy, Schrama and van Dam 49 , Reference Yang, Fan and Zhang 50 ) of down-regulating water throughput rate to create a DO challenge. These studies have the disadvantage that many water quality factors other than DO change simultaneously as the turnover through a tank decreases. The present study used high-precision CO2 and NH3 analysers to measure whether these key water quality variables exceeded thresholds that would likely influence the metabolism of the animals during periods of reduced water exchange. It was determined that CO2 and TAN concentrations in the present study were <8·2 mg/l dissolved CO2 ( Reference Schaarschmidt and Vaas 44 ) and <0·4 mg/l TAN( Reference Colt 3 ), which likely did not affect the fish( Reference Hjeltnes, Bæverfjord and Erikson 46 , Reference Timmons and Ebeling 51 ). As a result, main variables to consider in terms of the results were the target variables of temperature, diet and DO.
The animals in our study acclimated fast, and their metabolism quickly stabilised to new temperature conditions and the moderately challenging night-time DO conditions. This observation is in line with the wide temperature tolerance reported for the species( Reference Wallace 52 ) and their ability to endure moderately hypoxic waters( Reference Matthews and Berg 53 ). There was no difference in growth rate, feed intake and FCR observed between the two diets; however, such differences would not likely be observable over a short period such as 2 weeks with two isoenergetic diets of nearly identical digestive profile that would generally fulfil nutritional requirements. The poorer SGR and FCR observed with increasing temperature and experimental time was likely attributable to temperature effects( Reference Cho 54 ). Metabolic rate increases with temperature, so that beyond an optimal range elevated energy demand diverts nutrients towards fuel pathways rather than growth( Reference Fry 55 – Reference Morgan, McDonald and Wood 57 ). This pattern was observed in the present study, where metabolic rate increased with temperature and growth and normalised retained energy decreased.
Fish fed the HP diet tended to have slightly higher (0–8 %) VO2 than animals fed the SP diet, and the EB analysis suggests that the energy retained by fish fed the HP diet was consistently lower than that of fish reared on the SP diet, although the difference was small in magnitude. The elevated VO2 rate and lower energy retention observed in fish fed the HP diet compared with the SP diet may be related to differences in metabolic fuel use. The production of 1 kJ of energy via ammonotelic catabolism of protein theoretically requires 74·1 mg O2, whereas lipid and glucose require only 71·6 and 67·1 mg O2, respectively( Reference Heldmaier and Neuweiler 21 ). The SP diet had higher inclusion rates of lipid and starch (to maintain comparable energy value with the HP diet), and these fuels require less O2 for oxidative catabolism, and thus it may have been that fish metabolising the SP diet were utilising a fuel mix that was less oxygen demanding than fish metabolising the HP diet. Saravanan( Reference Saravanan 24 ) reported that diet-induced oxygen use declined with increasing dietary fat energy for rainbow trout, which is congruent with findings from the present study.
The protein fuel utilisation of fish fed the HP diet at 16°C is comparable with those reported by Alsop & Wood( Reference Alsop and Wood 58 ) (approximately 25 %) for juvenile rainbow trout on a similar diet and ration size (50 % protein diet, 1 % BW per day). Alsop & Wood( Reference Alsop and Wood 58 ) measured ammonia and urea 1 h before feeding and 8 h after feeding, and reported protein fuel utilisation as a daily mean value. Analysis of the daily NH3 excretion pattern curves from the present study indicate that Alsop & Wood( Reference Alsop and Wood 58 ) likely sampled time points that represented the minimum and maximum excretion rates. Estimated protein catabolism rates were comparable between the studies (for the HP diet, a comparable diet to that used by Alsop & Wood( Reference Alsop and Wood 58 )). The present study did not measure urea excretion, which may indicate that true protein catabolism rates of fish in the present study may be higher( Reference France and Kebreab 38 ); however, the analysis of the present study excluded pre-feeding ammonia excretion rates values, which complicates direct comparison of absolute rates between studies.
The AQ data of this experiment suggested that fish fed the HP diet were metabolising more protein as a fuel source than fish fed SP diet. In combination with a lower RE, it appears that the 7 % higher protein inclusion in the HP diet was used in catabolism and was not invested in improved growth. Alsop & Wood( Reference Alsop and Wood 58 ) have suggested that the use of protein as a fuel source is strongly dependent on protein intake quantity and quality( Reference Wilson 59 ). The results from our study support this notion, namely that dietary protein supply beyond an upper limit increases dietary protein catabolism. The preferred metabolic pathways are probably fixed ontogenetically( Reference Carter, Katersky and Barnes 2 , Reference Glazier 60 ), and protein is used as a fuel depending on the dietary content, quality and variation from the optimum environmental temperature( Reference Dumas, France and Bureau 61 ). The finding of no observable advantage of a HP supply under challenging conditions aligns with a study of Atlantic salmon (Salmo salar) fed diets from 41 to 45 % crude protein at about 60 % DOsat Reference Carter, Katersky and Barnes (2 ). Other studies with barramundi (Lates calcarifer) report that a HP diet reduces the impact of growth retardation at higher temperatures( Reference Carter, Katersky and Barnes 2 , Reference Glencross and Rutherford 23 ).
Glencross( Reference Glencross 22 ) concluded that protein utilisation at low DO levels was independent of the DO content of the surrounding water, which agrees with the AQ measurements in our experiment. The juvenile rainbow trout were not observed to consistently catabolise more protein under low DO conditions for either diet. In addition, although feed intake is a key variable known to be affected by low DO conditions via retardation of the SDA and reduced gut throughput rate( Reference Carter, Katersky and Barnes 2 , Reference Tran-Duy, Schrama and van Dam 49 , Reference Yang, Fan and Zhang 50 , Reference Herrmann, Warren and Doudoroff 62 , Reference Chabot and Claireaux 63 ), the low night-time DO period in the present study was not observed to have any effect on the feed intake on the morning of the following day. However, the restricted ration size used in the present study would be considered low for rainbow trout( Reference Cho 54 ) and there may be effects of intermittent DO on feed intake at higher ration sizes or with unrestricted feeding.
The MO period with low night-time DO elevated mean daily VO2 by 3–14 % above that recorded for the UO period for both diets and all temperatures. The higher VO2 may be attributable to physiological and behavioural actions that were required to cope with suboptimal DO conditions, such as elevated swimming, heart and ventilation rate and prolonged digestion( Reference Kramer 4 , Reference Wang, Lefevre and Thanh Huong 5 , Reference Randall and Smith 15 – Reference Jones 19 , Reference Kutty 64 ). The MO challenge resulted in an 11 % higher night-time VO2 above that recorded for UO periods at 16 and 20°C for fish fed the SP diet, whereas fish fed the HP diet increased VO2 by a maximum of 6 % under equivalent conditions. The results of the EB indicated a small but consistent reduction in RE under intermittent low DO conditions, which may lead to a loss of growth performance over longer periods than that tested in this study. Increasing temperatures led to bigger differences in RE between the DO periods for fish fed the SP diet compared with the HP diet, and taken together with these aforementioned differences suggest that the HP diet had some effect in moderating the physiological changes associated with challenging DO conditions and temperature variation. However, a HP diet was also observed to generally elevate VO2 and have lower RE than the SP diet for all conditions tested, meaning the HP diet gave no net benefit under challenging conditions.
Conclusion
The aim of the present study was to observe any changes in metabolic rate and protein fuel use in juvenile rainbow trout under different temperature, diet and DO periods. Further, we aimed to evaluate whether a HP diet is a valuable (although more expensive) method to support fish metabolism during challenging conditions. For both diets, catabolic protein usage of rainbow trout was lowest at 16°C and was not altered under challenging DO conditions. For oxygen conditions above 50 % saturation and all temperatures tested in this study, fish fed a dietary protein content of 42·5 % demonstrated decreased protein fuel use, increased retained energy and slightly lowered VO2 compared with fish fed a higher protein diet (49·5 %). The elevated protein in the HP diet was not invested in extra growth, and the 30–40 % higher rate of protein fuel use suggested that the elevated protein was catabolised completely and imposed elevated VO2 demands. Low night-time oxygen levels (<50 % saturation) led to a decrease in the retained energy and an increase in VO2 among fish fed the SP diet, so that under these conditions the SP diet was comparable in performance with the HP diet. The decrease in retained energy under low oxygen conditions suggests that there is scope to improve the performance of SP diets under challenging conditions for rainbow trout; however, this study suggests that simply increasing the dietary protein content is not a remedy and other strategies need to be explored.
Acknowledgements
The authors thank Stephanie Michl, Faraz Ansari, Simon Klatt, Arndt von Danwitz and Marcus Griese for assistance during the experiment or final sampling, as well as Mario Hasler for detailed statistical advices. The authors also thank Leo Nankervis and Nafiha Usman for detailed discussion of the raw data.
The present study was supported by the Ministry of Economic Affairs, Employment, Transport and Technology Schleswig-Holstein (project no: 122-13-004), by the Ministry of Science, Economic Affairs and Transport Schleswig-Holstein (project no: 122-08-008) and by the Innovationsstiftung Schleswig-Holstein (ISH, later converted into the EKSH, project no: 2010-43) and Skretting ARC, Norway. This study was also supported by Systea SpA, Italy, and SubCtech GmbH, Germany. The authors thank Enrico Savino and Pompeo Moscetta from Systea and Stefan Marx and Saskia Heckmann from SubCtech.
K. T. S., K. H. V., D. M., G. R., W. K. and C. S. designed the study. K. T. S. and C. D. carried out the experiment. K. T. S. analysed the data. K. T. S., K. H. V., D. M. and C. S. wrote the manuscript.
The authors declare that there are no conflicts of interest.
Supplementary material
To view supplementary material for this article, please visit https://doi.org/10.1017/S0007114517000472


