


Cognitive functioning plays a crucial role in both academic achievement( Reference Blair 1 , Reference Bierman, Nix and Greenberg 2 ) and health-related decision making( Reference White, Xie and Thompson 3 – Reference Nederkoorn, Braet and Van Eijs 5 ) in children and adolescents. Executive functioning (EF) is a particularly important domain within cognitive processing and consists of the mental capacity to make goal-directed behaviours, including inhibitory control, working memory, attention and planning. EF skills develop throughout childhood and adolescence and parallel the developmental changes that occur in the brain throughout this period( Reference Weintraub, Dikmen and Heaton 6 ).
Diet is likely to play an important role in cognitive functioning and EF, and previous literature reviews have focused on the impact of breakfast consumption and its association with general child cognition and/or academic performance. A review of forty-one publications by Hoyland et al.( Reference Hoyland, Dye and Lawton 7 ) concluded that compared with skipping breakfast, children who consumed breakfast demonstrated improved cognitive performance based on various measures of cognitive functioning and academic achievement. The observed effect was greater among nutritionally at-risk or stunted children compared with those who were well nourished. However, the quality of the breakfast was not assessed given the paucity of publications in that area, and the breakfasts cited within the studies reviewed were typically of poor nutritional quality (e.g. high in refined carbohydrates and sugar). More recently, studies have directly examined food quality and cognitive functioning. A systematic review of this topic will help inform school feeding programmes, wellness policies and paediatric feeding guidelines given the potential importance of diet on academic performance.
The aim of this systematic review was to document the impact of healthier dietary consumption on EF in children and adolescents. We included studies of overall food quality (including dietary patterns), macronutrients and foods. The research included also extended to studies of other meals beyond breakfast.
Methods
Literature search
Electronic databases searched included PubMed (1975–April 2016), Education Resources Information Center (ERIC) database (1966–April 2016), PyschINFO (1967–April 2016) and Thomson Reuters’ Web of Science (1900–April 2016). Inclusion criteria included studies and reviews that were related to healthier diets or food consumption compared with less-healthy diets (not fasting) and their association with EF in children or adolescents aged 6–18 years. This age range was selected as this is an important time period of neurogenesis related to EF, and EF skills would have typically developed sufficiently to measure by this time period( Reference Weintraub, Dikmen and Heaton 6 ). Publications were not limited by geographical area to enable inclusion of both higher- and lower-income countries, and all summary measures (e.g. risk ratios, difference in means) were included. All types of studies were examined, including cross-sectional, longitudinal and experimental study designs.
The following search terms were used to search all databases (using the filters for human species and the age range 6–18 years in PubMed and PsychInfo): (nutrition OR diet OR meal pattern OR whole grain OR fruit OR vegetable OR fish) AND (executive function OR cognition OR memory OR reasoning OR attention OR learning OR problem solving OR school performance OR academic achievement OR learning/physiology OR educational measurement OR educational status OR neuropsychological tests OR inhibitory control OR impulse control). The reference lists of included manuscripts, related review articles and relevant Medical Subject Heading terms in PubMed were also examined to ensure that all publications and appropriate key words for searches were included. Abstracts were screened for relevancy, and full texts were obtained from the databases or requested from authors if they met inclusion criteria. Study screening, selection and data extraction were completed by two independent researchers in 2015 and again in 2016 (completed in April 2016), with adjudication by a third researcher when necessary. The study protocol was registered at PROSPERO International prospective register of systematic reviews (registration no. CRD42016036950).
Study selection
All study designs were included in the literature review. The definition of healthier foods was based on the recommendations from the Dietary Guidelines for Americans and Harvard’s Healthy Eating Plate, which advise diets high in whole grains, fruits and vegetables, as well as lean proteins or proteins high in unsaturated fats (e.g. fish), and low in red/processed meats, SFA, trans fats and sugar( 8 , 9 ). Diets having a low glycaemic index (GI) or glycaemic load (GL) and that were consistent with these healthier guidelines or diets that were high in MUFA and PUFA were also considered healthy. ‘Unhealthy’ was used to describe foods or diets high in refined carbohydrates, sugar, SFA or trans fats and/or having a high GI or GL. ‘Low-fat’ diets that did not distinguish between healthier PUFA and MUFA and less-healthy SFA and trans fats were also considered unhealthy because these diets typically substituted the fat with highly processed, high-GI/GL foods. The cut-off values for meeting these healthier standards varied by the dietary assessment method. For feeding studies, healthy was defined as a meal with at least one of the healthier foods recommended above (e.g. whole grains, fruit, vegetable, fish, etc.) without the less-healthy items (e.g. refined grains) and/or a low-GI/GL meal. For measures of overall diet, standard scores (e.g. Healthy Eating Index (HEI) scores), nutrient substitutions (e.g. substituting SFA for PUFA) or comparisons of higher v. lower levels of macronutrients were used to determine whether a diet was healthy. Authors were contacted when ‘healthy’ was unclear. Studies were excluded if they included non-human subjects, compared food consumption with fasting only, had an unknown definition of healthy (and there was no clarification from the contacted author), had a definition of healthy greatly different from the review criteria (e.g. defined refined carbohydrates as healthy), had measures of EF combined with additional outcomes outside the scope of the review, which could not be disaggregated, or included malnourished or severely micronutrient-deficient populations (as defined by the publication). Studies that compared fasting with healthier diets were included if they also examined healthy v. less-healthy diets in separate analyses (results of fasting v. the other diets were not included in this review). Micronutrient supplementation was not examined, as this has been previously systematically evaluated( Reference Eilander, Gera and Sachdev 10 , Reference Warthon-Medina, Moran and Stammers 11 ). In addition, trials of other supplements (e.g. n-3 supplementation) were not included in the review; this had minimal impact on the number of studies available, as studies examining cognitive functioning and supplementation have been primarily carried out among pregnant women, infants or adults or have been conducted among malnourished children or children with developmental problems( Reference Kirby, Woodward and Jackson 12 ).
Publications examining GI or GL were included as both GI and GL measure carbohydrate quality. GI is calculated by measuring the two-hour incremental area under the blood glucose curve after consuming a food portion that contains 50 g of carbohydrates, compared with a control of white bread or glucose( Reference Ludwig 13 ). Foods such as refined carbohydrates and white potatoes/potato products typically have a high GI value (GI≥70) because they cause rapid spikes in blood sugar levels( Reference Foster-Powell, Holt and Brand-Miller 14 ). Vegetables (excluding potatoes), fruits and legumes typically have a low GI (≤55), whereas whole grains tend to have a moderate GI (56–69). GL, which accounts for both the impact of the carbohydrate on blood sugar levels and the amount of carbohydrate in a serving of the food, is calculated by multiplying a food’s GI by the amount of carbohydrates in the food. Foods with low GL (≤10) include fruits and vegetables that are high in fibre (excluding potatoes) and many beans/legumes such as chickpeas and black beans. Foods with a high GL (≥20) include refined carbohydrates, white rice and white potatoes/potato products. Whole grains such as brown rice or oatmeal typically have medium GL.
Studies that met all these criteria and examined food quality or macronutrients are included in Table 1 ( Reference Benton, Maconie and Williams 15 – Reference Zhang, Hebert and Muldoon 26 ), and studies that examined specific foods are included in Table 2 ( Reference Haapala, Eloranta and Venäläinen 17 , Reference Ames, Kisbu-Sakarya and Reynolds 27 – Reference Wesnes, Pincock and Richardson 35 ). Information extracted from each study included the following: (1) study design and duration, (2) study participant characteristics (age and country of origin), (3) types of measures for the exposures and outcomes (including whether they were validated tools) and (4) study quality (blinding of personnel, risk of attrition bias, etc.).
Table 1 Studies of food quality or macronutrients
GL, glycaemic load; SB, low risk of selection bias; CE, compliance with exposure; AB, low risk of attrition bias; BP, blinding of personnel; V, valid and reliable outcomes; GI, glycaemic index; DASH, Dietary Approaches to Stop Hypertension; BSDS, Baltic Sea Diet Scores; Raven’s CPM, Coloured Progressive Matrixes; CC, control for confounding variables; CDR, Cognitive Drug Research; GML, Groton Maze Learning Test; SWM, Spatial Working Memory; SSP, Spatial Span; CANTAB, Cambridge Neuropsychological Test Assessment Battery; SOC, Stockings of Cambridge; CVLT, California Verbal Learning Test; WISC-R, Wechsler Intelligence Scale for Children, Revised; DST, digit span test.
Table 2 Studies of foods

EF, executive functioning; IGT, Iowa Gambling Task; SB, low risk of selection bias; V, valid and reliable outcomes; A-CPT, Auditory Continuous-Performance Test; DST, digit span test; CPT, Continuous-Performance Test; AX-CPT, AX version of the Continuous-Performance Test; CE, compliance with exposure; AB, low risk of attrition bias; BP, blinding of personnel; CC, control for confounding variables; Raven’s CPM, Coloured Progressive Matrixes; BRIEF-SR, Behavioral Rating Inventory of Executive Function – Self-Report; CST, Concept Shifting Task; LDST, Letter Digit Substitution Task; CDR, Cognitive Drug Research.
Study quality
All publications meeting the criteria were assessed for study quality (Table 3). Relevant components of study quality were based on the Cochrane Handbook for Systematic Reviews of Effectiveness of Interventions. Criteria for judging risk of bias in the ‘Risk of bias’ assessment tool were evaluated by two independent researchers( Reference Higgins, Altman and Sterne 36 ). No studies were excluded on the basis of study quality if they met the other inclusion criteria. A summary score was not calculated because of concerns regarding subjectivity and a lack of consensus criteria for creating summary scores.
Table 3 Quality assessment of studies
SES, socio-economic status.
Results
Searches in PubMed for studies relevant to healthier diets and EF retrieved 2760 articles, whereas ERIC generated 907 articles, PsycINFO produced 569 articles and Thomson Reuters’ Web of Science retrieved 1493 articles.
Of the total 4870 publications, 1650 were duplicates. Of the 3220 publications screened, 3137 were determined not relevant to the review topic based on their titles and abstracts. Among the remaining eighty-three articles, sixty-two were excluded because of a definition of healthy/unhealthy that was unclear or differed greatly from the review criteria, the grouping of EF measures with additional outcomes that were not relevant to EF, the comparison of healthier food consumption with fasting only or the examination of malnourished populations. The remaining twenty-one articles are discussed in this review. The flow chart for the systematic review is presented in Fig. 1.
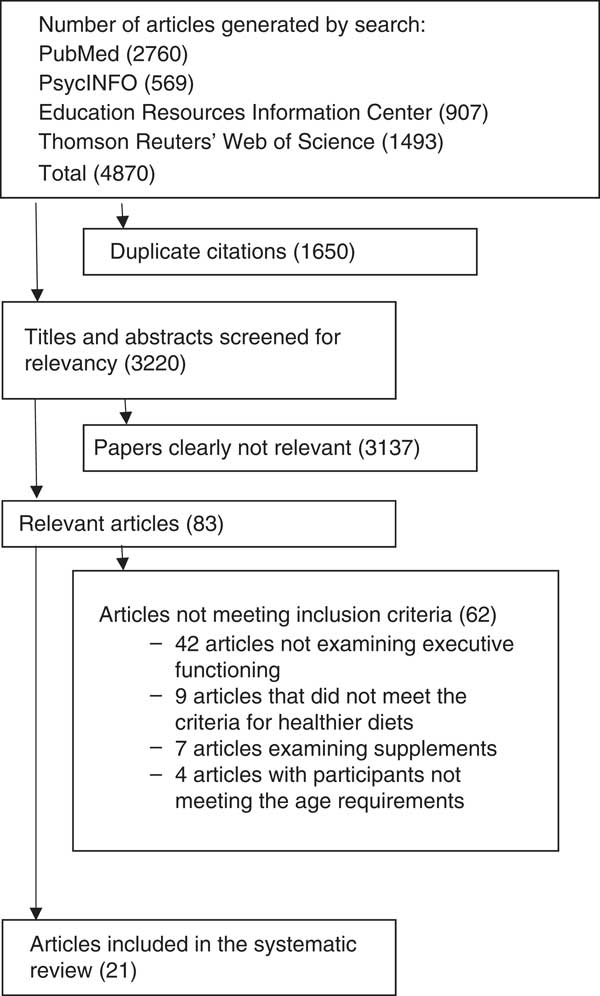
Fig. 1 Flow chart showing the number of articles at each stage of the search.
Studies examining food quality or macronutrients
Healthy dietary patterns
Among all, three studies were of overall dietary patterns and EF. Nyaradi et al.( Reference Nyaradi, Foster and Hickling 23 ) examined ‘Healthy’ dietary patterns (i.e. high in fruits, vegetables, whole grains, legumes and fish) v. ‘Western’ dietary patterns (i.e. high in red and processed meat, sugar-sweetened beverages, fried and refined food, and takeout foods) using FFQ, and also assessed working memory among 602 teens aged 14–17 years in Perth, Western Australia. This study found that the ‘Healthy’ dietary pattern was associated with fewer errors on the Groton Maze Learning Test (β=−0·023; P=0·035). Haapala et al.( Reference Haapala, Eloranta and Venäläinen 17 ) studied the association between non-verbal fluid intelligence/abstract reasoning and overall diet quality among 428 children aged 6–8 years in Finland. This study calculated both Dietary Approaches to Stop Hypertension (DASH) scores and Baltic Sea Diet Scores (BSDS) based on 4-d food records and assessed cognitive performance with the Raven’s Coloured Progressive Matrixes (CPM). Overall, this study found that both lower DASH and BSDS scores were associated with lower Raven’s CPM scores (i.e. poorer cognitive performance). Khan et al. examined the association between inhibitory control, fibre intake and overall dietary quality among sixty-five prepubertal children between 7 and 9 years of age by calculating a HEI score for the diets of the participants using 3-d dietary records; HEI scores are a measure of diet quality as determined by US Dietary Guidelines for Americans and are consistent with the DASH diet and Harvard’s Healthy Eating Pyramid( Reference Khan, Raine and Drollette 19 , Reference Guenther, Reedy and Krebs-Smith 37 , Reference Guenther, Reedy and Krebs-Smith 38 ). Using a modified Flanker task, which assesses cognitive inhibitory control, this study found that higher HEI scores were associated with greater performance accuracy on incongruent task trials and inversely associated with response accuracy interference, suggesting greater cognitive flexibility during increased task demands. Dietary fibre was also positively associated with task accuracy on both congruent and incongruent trials.
Glycaemic index/load
The majority of publications have been school-based feeding studies with a cross-over design. Ingwersen et al.( Reference Ingwersen, Defeyter and Kennedy 39 ) examined the impact of a high- v. low-GI breakfast on attention and memory among 6–11-year-olds (n 64), and found that following consumption of a high-GI breakfast cereal children demonstrated a larger decline in performance on accuracy of attention but had better secondary memory performance, when compared with children consuming a low-GI breakfast cereal, and no association with speed of attention or memory. Benton et al.( Reference Benton, Maconie and Williams 15 ) examined GL and memory among 5–7-year-olds (n 19) in a cross-over study and found that GL was inversely correlated with verbal memory (r −0·40; P<0·05), but there was no significant association noted between GL and spatial memory, delayed verbal memory or delayed spatial memory. In another study, Micha et al. examined both GI and GL among 11–14-year-olds (n 74) using a randomised, cross-over design, and in contrast to previous research they reported that a low-GI meal was associated with significantly improved performance on a word-generation task, which examined declarative verbal memory. The authors also noted that students had better scores on a Stroop task examining response time after consuming high-GI/ high-GL meals and that they performed faster on the Serial sevens test after high-GI meals compared with low-GI meals (for both low- and high-GL meals)( Reference Micha, Rogers and Nelson 22 ). It is of note, however, that the authors did not report whether there were significant differences in task accuracy, which is critical for interpreting the results; faster response times on a task of inhibitory control with no measure of accuracy do not necessarily suggest improved performance relative to those with slower response times, but may in fact be suggestive of an impulsive response style. Cooper et al.( Reference Cooper, Bandelow and Nute 16 ) examined 12–14-year-olds (n 41) and reported that, although response time on the Stroop test was faster with the high-GI breakfast, improved accuracy on this test was observed following consumption of a low-GI breakfast compared with a high-GI breakfast, and response times and accuracy on the Sternberg Paradigm test and accuracy on the Flanker test improved with a low-GI breakfast.
Among the studies that did not use a cross-over design, one study conducted a randomised trial among Australian 14–17-year-olds (n 36) using the Modified California Verbal Learning Test and found no association between GI and immediate or short-delay free recall( Reference Smith and Foster 25 ). An observational study among 11–14-year-olds (n 60) found that students had better immediate word recall task scores with high-GI meals compared with low-GI meals (for both high- and low-GL meals), but no effect of GI on delayed word recall( Reference Micha, Rogers and Nelson 21 ).
Macronutrients
Four cross-sectional studies included in the present systematic review examined differences in macronutrients. In a study that used data from 3666 children and adolescents participating in the Third National Health and Nutrition Examination Survey to examine macronutrient distributions, each 5 % increase in energy from PUFA was associated with a decreased odds of poor performance in the digit span test (working memory) when replacing SFA (OR 0·58; CI 0·37, 0·91) or carbohydrates (OR 0·61; CI 0·43, 0·88)( Reference Zhang, Hebert and Muldoon 26 ). In nutrient residual models, greater consumption of PUFA was associated with deceased odds of poor digit span scores (OR 0·74; CI 0·58, 0·94), and high cholesterol intake was associated with increased odds of poor digit span scores (OR 1·25; CI 1·11, 1·42). No significant associations were seen between macronutrients and a measure of spatial ability, the Block design test. In addition, a study conducted by Khan et al.( Reference Khan, Raine and Drollette 19 ) examining 7–9-year-olds (n 65) found that greater overall fat consumption was associated with higher task interference, suggesting poorer maintenance of cognitive control, but reported no association between SFA, n-3 fatty acids or PUFA and EF. A second study by Khan et al.( Reference Khan, Raine and Drollette 20 ) that used a task-switching paradigm to measure cognitive flexibility examined carbohydrate, protein and fat intake among 7–10-year-olds (n 150). This study also found that higher total fat intake was associated with longer reaction times during the task condition, which required greater cognitive flexibility. Further, the authors reported a correlation between greater SFA and cholesterol intakes and higher ‘switch’ costs, which represent difficulty in maintaining multiple cognitive sets in working memory and are indicative of less-efficient executive control processes. Finally, a cross-sectional study among 7–9-year-old children (n 70), conducted by Sheppard & Cheatham( Reference Sheppard and Cheatham 24 ), assessed EF using measures of planning (Stockings of Cambridge (SOC)) and working memory (Spatial Working Memory and Spatial Span) from the Cambridge Neuropsychological Test Assessment Battery and assessed diet using three 24-h recalls to determine n-3 and n-6 fatty acid levels and the ratio of n-6:n-3. This study found that children with lower n-6:n-3 ratios (i.e. consumed relatively higher levels of n-3 fatty acids) showed greater performance on EF tasks. In particular, they had shorter initial processing times during the spatial working memory task and had reduced average times during the planning task (SOC). In addition, a significant interaction between the overall fatty acid intake levels and their ratio was observed, with higher average n-3 fatty acid levels associated with greater mean planning times (i.e. poorer EF performance), in the presence of higher n-6 fatty acid intake (i.e. overall high quantities of the fatty acids, but a low n-6:n-3 ratio).
Studies examining foods
Whole grains
Several studies have examined whole grains because of their healthier nutrient profile and generally lower GI/GL values. The first was a small, randomised, cross-over study among twenty-nine children and adolescents aged 9–16 years, which found that a glucose drink was associated with significantly larger declines in attention and working memory compared with wholegrain cereal( Reference Wesnes, Pincock and Richardson 35 ). Mahoney et al.( Reference Mahoney, Taylor and Kanarek 29 ) conducted a school-based, cross-over feeding study, and found that after consuming oatmeal, females performed better on the backwards digit span test, 9–11-year-old girls and boys had better scores on the Map Task, and 6–8-year olds performed better on the Auditory Continuous-Performance Test (A-CPT) compared with their performance after consuming refined breakfast cereal. The study by Haapala et al.( Reference Haapala, Eloranta and Venäläinen 17 ) also found that males who were in the lowest quartile of high-fibre grain consumption had the lowest scores on the Raven’s CPM (non-verbal reasoning) compared with those in the highest quartile. Finally, Chung et al.( Reference Chung, Park and Kwon 28 ) implemented a randomised, controlled feeding study among 15–17-year-olds (n 26), and found that those who had been assigned to consume white rice had significantly greater improvements in scores on a verbal learning test after a delayed recall at 20 min compared with those consuming the healthier diet composed of whole grains, kidney beans and walnuts (P<0·05), but not on the AX version of the Continuous-Performance Test (AX-CPT) – a measure of attention, vigilance and response impulsivity. Those consuming white rice had a significant decrease in correct responses on the AX-CPT as well as an increase in omission errors at the end of the study compared with those consuming the healthier diet( Reference Chung, Park and Kwon 28 ). There were no significant differences between the groups on the other tests administered, which included the A-CPT, digit span test, Stroop test, Trail making test A and B and the Wisconsin Card Sorting Test.
Sweet and salty snacks and sugar-sweetened beverages
Four studies examined salty and sugary snacks and beverages and found consistent associations between ‘junk’ foods and poorer EF. Ames et al.( Reference Ames, Kisbu-Sakarya and Reynolds 27 ) found that among male adolescents, greater sugar-sweetened beverage consumption was associated with poorer decision making on the Iowa Gambling Task and reduced ability to inhibit inappropriate responses on the standard Go/No-Go task. In addition, sweet and salty/fatty snacks were associated with inhibitory problems on the standard Go/No-Go task, and sweet-snack consumption was associated with inhibitory problems on the food-based Go/No-Go task among males. Multiple studies by Riggs et al.( Reference Riggs, Spruijt-Metz and Sakuma 30 – Reference Riggs, Spruijt-Metz and Chou 32 ) that examined snack food consumption among children also found an inverse association with self-reported measures of EF.
Fruits and vegetables
Four studies examined fruits, vegetables and EF, with three finding higher fruit and vegetable intakes associated with greater EF. In the small, cross-sectional study among 9–10-year-olds conducted by Riggs et al.( Reference Riggs, Spruijt-Metz and Sakuma 30 ), no association between fruit or vegetable consumption and EF was observed, which the authors noted may have been due to the small sample size. However, in the two larger studies conducted by Riggs et al.( Reference Riggs, Chou and Spruijt-Metz 31 , Reference Riggs, Spruijt-Metz and Chou 32 ), fruit and vegetable intakes were positively associated with EF. Finally, Haapala et al. found a positive association between fruit consumption and abstract reasoning measured using Raven’s CPM. This study also found that males who were in the lowest quartile of vegetable consumption also had the lowest Raven’s CPM scores compared with those in the highest quartile( Reference Haapala, Eloranta and Venäläinen 17 ).
Proteins
Three studies examined the consumption of animal-based sources of protein (i.e. fish or red/processed meat) and EF. Haapala et al.( Reference Haapala, Eloranta and Venäläinen 17 ) found that males who were in the lowest quartile of fish consumption had the lowest abstract reasoning scores. In addition, this study found that, among both males and females, greater red and processed meat consumption was associated with lower scores on the Raven’s CPM. A study conducted by Sorensen et al.( Reference Sørensen, Damsgaard and Dalskov 33 ) assessed 726 children aged 8–11 years using a school-based feeding intervention that provided students with fish twice per week. Diet was assessed using n-3 fatty acid biomarkers, whereas EF was measured with the D2 test of attention. The authors noted that at baseline EPA and DHA status was positively correlated with concentration performance and processing speed; in addition, impulsivity and inattention were inversely correlated with EPA/DHA level (i.e. higher EPA/DHA was associated with lower impulsivity/inattention errors) in boys, whereas inattention errors were positively correlated with EPA/DHA levels in girls. Following the 3-month school meal intervention, EPA/DHA levels increased and were associated with improved performance on measures of EF. Finally, a study by van der Wurff et al.( Reference van der Wurff, von Schacky and Berge 34 ) examined multiple domains of EF and their association with fish consumption, measured using n-3 fatty acid biomarkers to calculate an omega-3 index (calculated as EPA and DHA in blood erythrocytes as a per cent of total fatty acids). Among the 266 adolescents participating in the study, there was a positive association between the omega-3 index and performance on the Letter Digit Substitution Task and fewer errors of omission on the D2 test of attention, indicating better information processing speed and less impulsivity with greater fish consumption.
Discussion
Overall, studies examining the longer-term effect of a healthier diet found consistently positive associations with EF, whereas studies examining the acute association between GI and GL and EF found mixed results, although the majority was suggestive of improved EF with lower GI/GL foods. Similarly, studies examining macronutrients were inconsistent, and the limited number of studies in this area made it difficult to draw conclusions. Studies examining specific foods primarily found that healthier foods (e.g. whole grains, fruits and/or vegetables) were positively associated with EF, whereas snack foods – which are typically high in sugar, refined grains and SFA – sugar-sweetened beverages and red/processed meats were inversely associated with EF. Studies examining fish intake were also suggestive of a positive association with EF.
Studies examining healthier diets and EF have used varying tests of cognition, which may in part help explain the inconsistent findings among those examining GI and GL. It is important to note that different versions of a cognitive task (i.e. the Stroop Color Word Task) are likely to yield different results, making comparisons and interpretation of data across studies difficult. In addition, because EF covers multiple processes (e.g. planning, working memory, inhibitory control), there is heterogeneity among the areas assessed by each of the validated tests available. Although there are a number of ‘gold standard’ measures of EF (i.e. the Wisconsin Card Sorting Test), measures must be tailored to fit specific population requirements, including age, education, intelligent quotient, time requirements to administer the tests and the cognitive domain of interest, which may also impact the interpretation of the results. A recent review of GI and more general cognition in both children and adults also found that the findings were inconclusive, and noted that this may also be due to the use of cognitive tests that may not be sensitive enough to detect small but meaningful variations in cognition( Reference Philippou and Constantinou 40 ). Given the number of well-validated tests, it is therefore essential to select both appropriately sensitive tests and to assess a sufficient number of participants to ensure the power to detect changes in EF.
It is possible that healthier foods improved EF through multiple mechanisms. Certain vitamins (e.g. B vitamins and vitamin C) and minerals (e.g. Zn) are cofactors for enzymes that synthesise neurotransmitters, thus impacting cognition throughout childhood and adolescence( Reference Haller 41 – Reference Greenwood and Craig 43 ). In addition, micronutrients (e.g. folate) and healthy fats, particularly PUFA, impact myelin sheath integrity and nerve cell membranes, which affect neuron function( Reference Drake 42 ). Brain glucose levels may also impact EF( Reference Drake 42 ). A healthier diet may lead to changes in the brain structure and function, particularly in the frontal cortical regions involved, through synapse formation, in neurogenesis, myelination and glucose control.
Improvements in EF resulting from healthier diets can have important academic, public health and policy implications, as EF is associated with both academic performance and health-related decision making. As the majority of youth in the USA fail to meet dietary recommendations, policies that improve diet, and thus EF, may have important implications( Reference Krebs-Smith, Guenther and Subar 44 ). Schools may consider policies that further improve the school food environment, including both school meals and competitive foods, to potentially impact the academic performance and health of students. Similarly, policies that improve the content of the foods available through the Supplemental Nutrition Assistance Program (SNAP) may have important implications for children, as roughly half of SNAP participants are children aged 18 years or younger( 45 ).
This review is subject to a number of limitations. Publication bias is a possibility, as studies of diet and EF with null findings may have been less likely to be published. Further, substantial differences emerged in the types of foods and diets examined as well as the metrics used to assess both diet and EF. This may have impacted the interpretation of the relationship between a healthier diet and EF. Finally, in many studies, it was not possible to determine the causal nature of the relationship due to the cross-sectional study designs; it is possible that, given better EF, children are able to make healthier food choices. Future, longitudinal studies examining the impact of a healthier diet on EF are warranted.
In summary, although the association between GI/GL and EF remains unclear, there appears to be a positive association between EF and healthier overall diets and foods. In addition, studies suggest that consumption of less-healthy snack foods, sugar-sweetened beverages and red/processed meats is associated with poorer EF. Overall, future short- and long-term studies should examine healthier food consumption, including whole grains, fruits, vegetables and fish in a controlled environment, such as a cross-over feeding study. Studies examining macronutrients are also warranted, and additional studies examining sugar-sweetened beverages or red/processed meats and their potential impact on EF are also indicated. The use of sensitive, validated cognitive measures is essential to determine potential associations between food and EF.
Acknowledgements
The authors thank Sara Rimm-Kaufman for her thoughtful assistance with the interpretation of the studies reviewed.
This research received no specific grant from any funding agency or from commercial or not-for-profit sectors.
The authors’ contributions were as follows: J. F. W. C., E. B. R. and S. A. G. defined the scope of the project. J. F. W. C. and M. T. G. performed the literature search, reviewed identified publications and assessed study quality. J. F. W. C. wrote the manuscript with significant contributions from E. B. R., L. B. F. K., M. T. G. and S. A. G. All the authors contributed to the interpretation of the data, approved the final manuscript and took full responsibility for the final content.
None of the authors has any conflicts of interest to declare.


