

Many changes in the composition and function of immune cells in both the acquired and innate immune system during the first year of life contribute to the many differences in immunity reported between infants and adultsReference Buck, Cordle, Thomas, Winship, Schaller and Dugle1–Reference Wilson, Penix, Weaver, Melvin and Lewis3. Imbalances in effector cell responses may also have an impact on childhood diseases such as atopy and autoimmune disordersReference Bartuzi, Zbikowska-Gotz, Romanski and Sinkiewicz4. The exact timing of these changes and the factors that influence them have not been established. Neonatal immune development is influenced throughout gestation by maternal immunityReference West5, as well as after birth through consumption of breast milkReference Field6. Human milk contains numerous components, including cytokines and chemokines, that protect the infant against infections. Human milk also contains a number of immune active ingredients that can promote immune maturationReference Field6. A better understanding of the effect of diet on immune events during early infancy is necessary in order to ensure that the infants not fed breast milk develop healthy immune systems.
Human milk contains biologically important quantities of long-chain PUFA (LCP), arachidonic acid (AA) and DHA as well as their precursors, 18 : 2n-6 and 18 : 3n-3. Animal studies have clearly demonstrated that the content of LCP, and/or the n-6 : n-3 fatty acids ratio, in the diet modulate T cell functions such as the ability to proliferate and produce cytokines in response to mitogen or antigen stimulationReference Calder7–Reference Rotondo, Earl, Laing and Kaimakamis12. In the preterm infant we have demonstrated that adding AA and DHA to infant formula results in a T cell maturation state and cytokine response that is closer to the breast-fed infantReference Field, Thomson, Van Aerde, Parrot, Euler and Clandinin13. The importance of consuming AA and DHA on immune function in the full-term infant has not been established. Most information on maturation of the immune system relies on immunophenotyping of blood lymphocytes where significant phenotypic differences between T cells of neonates, children and adults suggest a gradual development of cell-mediated immunological defence mechanismsReference Buck, Cordle, Thomas, Winship, Schaller and Dugle1–Reference Wilson, Penix, Weaver, Melvin and Lewis3. T cells and their secreted products play a central role in orchestrating the immune response. T-helper (Th) cells are divided into two major subsets termed Th1 and Th2, based on the pattern of cytokines they produce. Th1 cells produce high levels of IL-2 and interferon (IFN)-γ but no IL-4 or IL-5 (Th1 cytokine pattern) and predominantly promote cell-mediating immune responses. In contrast, the Th2 cells produce IL-4 and IL-5 but not IFN-γ (Th2 cytokine pattern) and induce humoral immune responses. Although considerable evidence indicates that cytokine responses are involved in immunological responses and disease pathogenesis, few studies have examined normal cytokine production profiles after an immune challenge during the neonatal period.
The present study was conducted to assess the influence of feeding infant formula containing LCP on the ability of peripheral blood lymphocytes from healthy term infants to proliferate and produce cytokines in response to a T cell polyclonal mitogen. The response was compared with immune cells from a similar group of infants fed the same formula but without LCP and with immune cells from a group of infants exclusively fed human milk.
Experimental methods
Subject inclusion criteria
Mothers (from the Regional Program for Newborn Services, Edmonton, Alberta, Canada) who had chosen to exclusively feed their infants with commercial formula before age 14 d were approached to enter the study. If they consented (n 30), they were randomised to receive either a standard term infant formula (Formula; n 14) or the same formula supplemented with the long-chain fatty acids AA (20 : 4n-6) and DHA (22 : 6n-3) (Formula+LCP; n 16). The mothers and the investigators were blinded to what formula they received. A group of infants (n 16) who were exclusively fed human milk (HM; n 16) from birth were included for comparison. Laboratory staff that performed the immune analysis were blinded to all three groups. Inclusion criteria for all infants stipulated that by age 14 d infants were receiving 100 % of their intake by mouth from human milk or commercial infant formula and that infants were healthy with birth weight, length and head circumference between the 10th and 90th percentile for gestational age, according to the National Center for Health Statistics growth chartsReference Hamill, Drizd, Johnson, Reed, Roche and Moore14. Infants with major congenital malformations, documented systemic or congenital infection, significant neonatal morbidity, diagnosed maternal autoimmune disorders, acute illness precluding oral feedings, or conditions requiring infant feedings other than standard formula or human milk were excluded from the study. None of the infants had received corticosteroids, erythrocyte or plasma transfusions, or intravenous lipid emulsions before entering the study. Infants were enrolled into the study between age 7 and 14 d. The first blood sample was collected before infants were consuming the experimental formula (7–14 d) and was designated as age 2 weeks. The average age of entry into the study (2-week blood sample collected) was 11·8 ± 2·2 d for the HM, 10·2 ± 3·0 d for the Formula and 9·7 ± 2·8 d for the Formula+LCP groups. The formula-fed infants had been fed one of several commercially available infant formulas (none of which contained LCP) before randomisation to their assigned study formula.
Diet treatments
The commercial formula fed was S-26® and S-26 Gold® (Wyeth Nutrition, Philadelphia, PA, USA), which differs from S-26 only by the addition of AA (0·34 %, w/w) and DHA (0·2 %, w/w) from single-cell TAG (Martek Biosciences Corp., Baltimore, MD, USA). The fat was present in both formula as TAG and the fatty acid composition of the two formulas is presented Table 1.
Table 1 Fatty acid composition of infant formulas (% (w/w) total fatty acids)*
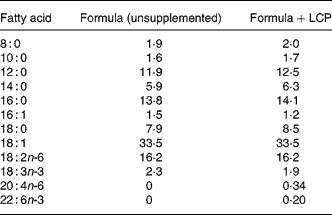
LCP, long-chain PUFA.
* Fatty acids that comprised less than 1 % of total fat (with the exception of 20 : 4n-6 and 22 : 6n-3) have not been show but make up the remaining proportion of fatty acids.
Ethical considerations
The present study was approved by the Research Ethics Committee of the Faculty of Medicine, University of Alberta, and the Special Services and Research Committee of the Capital Health Authority. Informed written consent was obtained from one parent of each infant participating in the study.
Study population, anthropometric and blood measures
Infant weight (g), length (cm) and head circumference (cm) were measured at study entry (designated as 2 weeks) and after 4 weeks in the study (designated as age 6 weeks). A 2 ml blood sample was drawn by venepuncture from each infant at study entry and after 4 weeks of feeding (age 42 ± 4 d). Standard blood chemistry and haematological measures were obtained, including packed cell volume, Hb, leucocyte count and differential, and mean corpuscular volume. Plasma phospholipid PUFA concentration was determined as previously described in detailReference Pratt, Tredget, Clandinin and Field15.
Immune measures
Peripheral mononuclear cells were isolated and purified on a Ficoll density gradient of Histopaque 1077 (Sigma Chemical Co., St Louis, MO, USA) as previously describedReference Field, Thomson, Van Aerde, Parrot, Euler and Clandinin13. Lymphocytes were re-suspended in RPMI 1640 (defined later) supplemented with 40 g/l (5 %, v/v) heat-inactivated human serum (Gibco Life Technologies, Burlington, ON, Canada). Cells were counted using a haemocytometer. Cell viability, determined using trypan blue exclusion (in media without added protein), was greater than 98 % for all groups. Due to the number of samples and the amount of blood required, not all assays could always be performed on every infant's blood sample. The number of infants used is indicated with each mean presented in the results section.
Phenotyping of peripheral blood mononuclear lymphocytes
Immune cell subsets were identified by flow cytometry in whole blood with labelled monoclonal antibodies (mAb), as previously describedReference Field, Thomson, Van Aerde, Parrot, Euler and Clandinin13. The anti-human mouse mAb, purchased from Sigma Chemical Co. (St Louis, MO, USA) or BD Pharmingen (Mississauga, ON, Canada), labelled with fluorescein isothiocyanate (FITC), R-phycoerythrin (PE), biotin or quantum red were used: CD3-biotin (pan T cells), CD4-FITC (Th/inducer cells), CD8-PE (T cytotoxic/suppressor cells), CD45RO-FITC (antigen-exposed T cells, B cells, granulocytes and monocytes), CD45RA-quantum-red (antigen-naive T cells, natural killer cells, B cells), CD14-FITC (monocytes), CD20-FITC (all B cells except plasma cells), CD16-PE (natural killer cells and macrophages), CD28-FITC (co-stimulatory molecule for T cell activation) and CD44-PE (H-CAM on leucocytes, erythrocytes, platelets). Antibodies labelled with biotin were incubated an additional 30 min with strep-avidin quantum red as the colour conjugate. Once labelled, cells were washed and fixed in paraformaldehyde (10 g/l in PBS with sodium azide as a preservative) and all samples were acquired (within 3 d) on the same flow cytometer (FACScan™; Becton Dickinson, Sunnyvale, CA, USA). Flow cytometry analysis (10 000 cells per mAb combination) was performed on the gated mononuclear cell population which was set to exclude any remaining erythrocytes. Appropriate isotype controls (Sigma Chemical Co.) were used for each labelled mAb and were corrected for background fluorescence ( < 1 %). Using combinations of two colour (two antibody) dot plots the proportion of single- and double-labelled cells for each antibody combination was determined by setting gates (vertical and horizontal) to separate the cells that stained positive or negative for the antibodies.
Estimation of lymphocyte proliferation
Lymphocytes (1 × 10⁶ cells/ml) were cultured for 48 h in ninety-six-well micro-titre plates with or without l-phytohaemagglutinin (PHA; 5 μg/ml; Sigma Chemical Co.) as previously describedReference Field, Gougeon and Marliss16. Preliminary studies confirmed that optimum proliferative activity was achieved by 48 h (data not shown). Each well was pulsed with 0·037 MBq of [3H]thymidine (Amersham/Pharmacia Biotech, Montreal, PQ, Canada) 18 h before harvesting the cells. All assays were performed in triplicate and stimulation indices were calculated for each condition as: amount of [3H]thymidine (disintegrations per min) incorporated by cells in the presence of PHA/amount of [3H]thymidine (disintegrations per min) incorporated by cells in the absence of PHA.
Cytokine production by isolated peripheral blood cells
Isolated lymphocytes (1 × 10⁶ cells/ml each) were cultured in duplicate in 1 ml complete culture medium and incubated for 48 h with or without PHA (5 μg/ml)Reference Field, Thomson, Van Aerde, Parrot, Euler and Clandinin13. Complete culture medium consisted of RPMI 1640 supplemented with (final concentration of each of the ingredients in parentheses) l-glutamine (300 mg/l; Gibco Life Technologies, Burlington, ON, Canada), human serum type AB (4 %, v/v; Sigma Chemical Co.), N-2-hydroxyethylpiperazine-N′-2-ethanesulfonic acid (HEPES) buffer (25 mm; Gibco Life Technologies), 2-mercaptoethanol (2·5 μmol/ml) and antibiotic–antimycotic saline solution (100 μg/ml) containing penicillin G sulfate (10 000 U/ml), streptomycin sulfate (10 000 μg/ml) and amphotericin B (25 μg/ml) (all from Gibco Life Technologies). After incubation, tubes were centrifuged at 200 g at 4°C for 10 min to pellet cells (used for phenotyping). The supernatant fraction was collected and stored at − 70°C for subsequent cytokine analysis. The concentrations of IL-2, IL-4, IL-6, IL-10, IL-12, IFN-γ, TNF-α and transforming growth factor-β were determined using ELISA kits (OptEIA set; BD Pharmingen, Mississauga, ON, Canada) following the manufacturer's instructions. All kits were standardised, optimised and tested for sample range (using fetal calf serum (10 %, v/v) in PBS as an assay diluent) and parallelism (pooled sample serial dilutions slope of curve r>0·980) in order to ensure a sample reproducibility or inter-assay variability of < 15 %. All samples were performed in duplicate (intra-assay variability < 10 %) and when necessary were diluted with assay diluent to fall within the linear detection range of the standard curve (7·8–500 pg/ml) for all cytokines with the exception of IL-6 (where we used a standard range of 19–600 pg/ml and results corrected to ng/ml). Tetramethylbenzidine (BD Pharmingen) was used as the ELISA substrate and the reaction stopped by adding 2 m-H2SO4. Absorbance was read at 450 nm on a Spectra Max 190® plate reader (Molecular Devices, Sunnyvale, CA, USA).
Post-culture and stimulation phenotyping
After removal of the supernatant fraction, the cells in the remaining pellet were phenotyped and analysed as described earlier for whole blood. The following additional mAb (purchased from Sigma Chemical Company or BD Pharmingen) were used in the post-culture analysis: CD20-FITC (B cells), CD54-PE (ICAM-1), CD80-biotin (B cell subset co-stimulatory signal to T cells), CD16-FITC (natural killer cells and macrophages), CD11c-PE (β2 leucocyte integrins found on monocytes, granulocytes and macrophages), CD11b-biotin (granulocytes, monocytes, natural killer cells and macrophages), CD14-FITC (monocytes), CD8-PE (T cytotoxic/suppressor cells) and CD4-biotin (Th/inducer cells). Analysis (1000–10 000 cells per mAb combination) was performed on the gated lymphocyte population as described for whole blood earlier. Appropriate isotype controls (Sigma) were used for each labelled mAb and resultant percentages were corrected for each subject's background fluorescence ( < 1 %).
Statistical analysis
Based on an earlier feeding study of preterm infantsReference Field, Thomson, Van Aerde, Parrot, Euler and Clandinin13, the sample size for each group was calculated to be sufficient to establish statistical differences in IL-2 production after PHA stimulation. As the 2-week (baseline) value was collected before the infants being randomised to the two formula groups, we anticipated that there would be no statistical differences in baseline measures among the formula-fed infants. However, despite randomisation, differences occurred in some of the initial phenotypes between formula groups. Differences between diet and age (including changes between 2 and 6 weeks) were identified using a mixed-model repeated-measures ANOVAReference Wang and Goonewardene17 and significant differences between groups identified by least-square means. Unless a difference (P < 0·05) was found between the infant randomised to each formula, the value at 2 weeks (baseline) for the two formula groups was combined to determine differences between infants that had been fed exclusively human milk to those that had been exposed to formula at 2 weeks. For the measures (production of IL-4, IL-6 and IL-12 after PHA stimulation) that were not normally distributed, data were log transformed (and normal distribution confirmed) before statistical analysis. All data are expressed as mean values and standard deviations. All statistical analysis was performed using SAS (version 8; SAS Institute Inc., Cary, NC, USA).
Results
Anthropometric measures, recorded adverse events, blood chemistry and plasma polyunsaturated fatty acid concentration
There was no significant difference among diet groups in weight, length or head circumference at either age 2 or 6 weeks (Table 2). All infants tolerated the diets and there was no difference among groups in the incidence of minor adverse effects (gas, spit-ups, cramps, vomiting and mucus or blood in stools) that were reported and defined by the mothers. Blood chemistry results indicated that all values were within normal ranges for healthy term infants at both 2 and 6 weeks of age and did not differ among diet groups (data not shown). At age 6 weeks the HM infants had a significantly lower concentration of 18 : 2n-6 than either the Formula or the Formula+LCP group (Table 2). The Formula+LCP group had a higher (P < 0·001) plasma concentration of 22 : 6n-3 than the Formula group but similar to the HM infants (Table 3).
Table 2 Body weight and length of infants at birth, age 2 weeks and age 6 weeks
(Mean values and standard deviations)
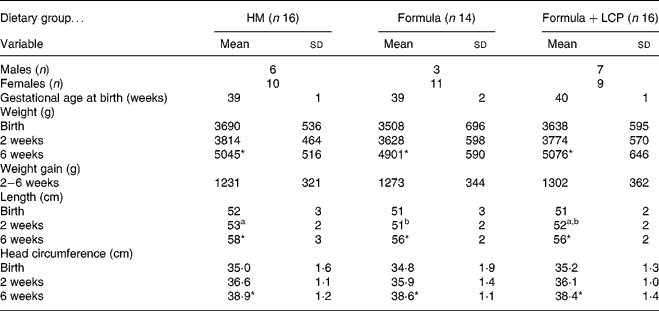
HM, human milk; Formula, unsupplemented infant formula; Formula+LCP, formula supplemented with long-chain PUFA.
a,b Mean values within a row with unlike superscript letters are significantly different (P < 0·05).
* Mean value, within a group, is significantly different from that at 2 weeks of age (P < 0·001).
Table 3 Plasma phospholipid fatty acid concentration
(Mean values and standard deviations)
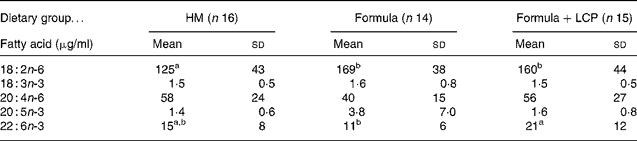
HM, human milk; Formula, unsupplemented infant formula; Formula+LCP, formula supplemented with long-chain PUFA.
a,b Mean values within a row with unlike superscript letters are significantly different (P < 0.05).
Total and differential leucocyte counts
At study entry (age ≤ 2 weeks) there was a lower proportion of blood eosinophils in formula-fed infants compared with HM-fed infants (3·4 (sd 1·9) % (n 28) v. 6·0 (sd 2·3) % (n 15); P < 0·05). This was the only difference in the differential leucocyte count between the groups and this difference disappeared at age 6 weeks. At 6 weeks, the percentage lymphocytes in peripheral blood was lower (70 (sd 4) % (n 15) v. 74 (sd 7) % (n 15); P < 0·05) and percentage neutrophils higher (17 (sd 3) % (n 15) v. 14 (sd 6) % (n 15); P < 0·05) for the Formula+LCP infants compared with the HM-fed infants. There was no difference in these two measures between formula groups. For all infants (n 46), there was a significant decrease (P < 0·05) in the mean total leucocyte (12·7 (sd 2·7) × 109/l v. 9·5 (sd 2·3) × 109/l), neutrophil (3·2 (sd 1·2) × 109/l v. 1·4 (sd 0·6) × 109/l), monocyte (1·3 (sd 0·6) × 109/l v. 0·7 (sd 0·3) × 109/l) and lymphocyte (7·4 (sd 2·0) × 109/l v. 6·9 (sd 1·8) × 109/l) concentrations in peripheral blood at 6 weeks compared with age 2 weeks.
Mononuclear cell phenotypes pre-culture
Diet effects at age 2 weeks and the effect of age on peripheral blood phenotypes
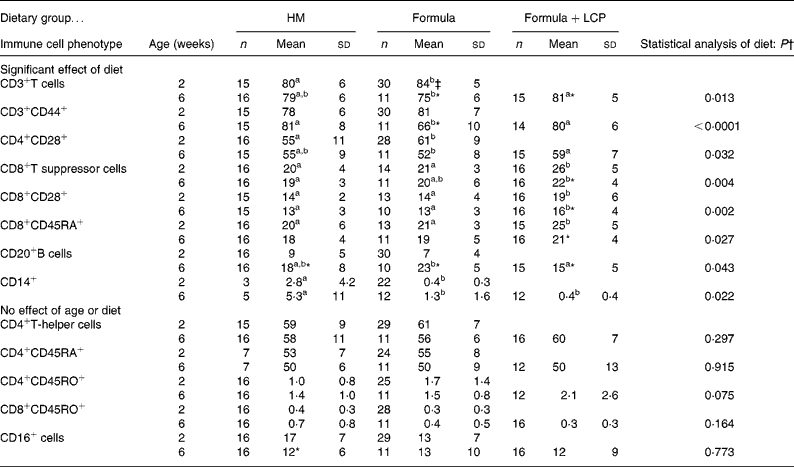
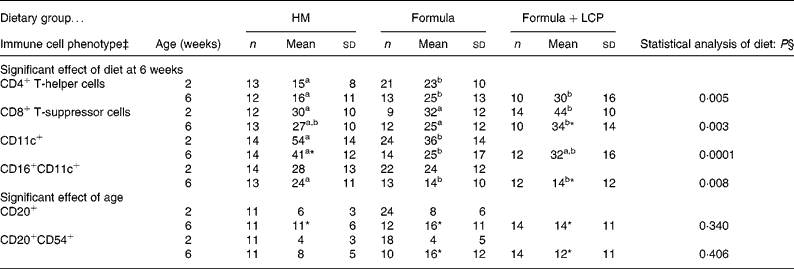
At age 2 weeks, there were small but significant differences in the proportion of cell types between formula-fed and HM-fed infants. Compared with HM-fed infants, formula-fed infants had a higher proportion of CD3+ cells, CD4+ cells that expressed CD28, and a lower proportion of CD14+ cells (P < 0·05; Table 4). Despite the randomisation process, at age 2 weeks, babies randomised to the Formula+LCP group, compared with the Formula group and the HM group, had a significantly higher proportion of CD8+ cells, CD8+ cells expressing CD28+ and CD8+ cells that were CD45RA+. The proportion of all these cell types decreased at 6 weeks; however, all but the proportion of CD8+CD45RA+ cells remained significantly higher than that of HM-fed infants at 6 weeks (Table 4). Compared with the Formula group at age 6 weeks, the Formula+LCP group had a higher proportion of CD3+ cells, CD3+ cells expressing CD44, and CD4+ cells and CD8+ cells expressing CD28 and proportionately fewer CD20+ cells (P < 0·05; Table 4). The proportion of B cells increased for all groups with age (P < 0·05). For both the Formula and Formula+LCP group, but not the HM group, there was a significant increase in the relative proportion of CD3+ cells (P < 0·05). For the Formula but not the HM or Formula+LCP groups there was a significant decrease in the relative percentage of CD3+CD44+ cells in blood (P < 0·05).
Table 4 Peripheral blood cell phenotypes at 2 and 6 weeks of age (percentage of total cells)
(Mean values and standard deviations)
HM, human milk; Formula, unsupplemented infant formula; Formula+LCP, formula supplemented with long-chain PUFA.
a,b Mean values within a row with unlike superscript letters are significantly different (P < 0·05).
* Mean value, within a group, is significantly different from that at 2 weeks of age (P < 0·05).
† Differences between diet and age were identified using a mixed-model repeated-measures ANOVA. The P value presented represents the effect of diet.
‡ Unless indicated, at 2 weeks (baseline) there were no significant differences between the infants allocated to the formula groups; therefore values for all formula-fed infants were combined and are presented as one mean.
Effect of diet at age 6 weeks on peripheral blood phenotypes
Compared with the Formula group the proportion of CD3+ (total, CD28+ and CD44+) cells were significantly higher and the proportion of B cells significantly lower in infants fed Formula+LCP but these did not different from HM-fed infants (Table 4).
Lymphocyte response to in vitro stimulation with l-phytohaemagglutinin
Response in the absence of mitogens
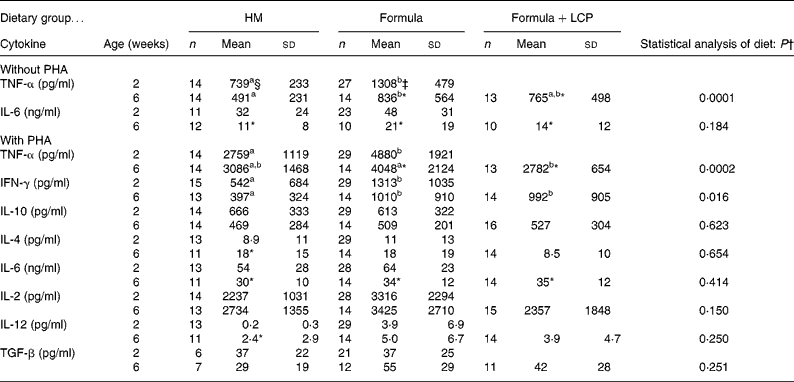
Although there was no difference in the rate of [3H]thymidine uptake by isolated lymphocytes in the absence of mitogen, the rate significantly decreased (P < 0·005) with age in all diet groups (Fig. 1 (A)). At 2 weeks, both formula groups produced more (P < 0·05) TNF-α than HM-fed infants but by 6 weeks the amount produced by Formula+LCP-fed infants was not significantly different from HM-fed infants (Table 5). A lower rate of production of IL-6 was observed in all groups with age (P < 0·05; Table 5). There was no detectable production of IL-2, IFN-γ, IL-4, IL-10, IL-12 or transforming growth factor-β in the culture media of the unstimulated cells after 48 h in culture at either 2 or 6 weeks.
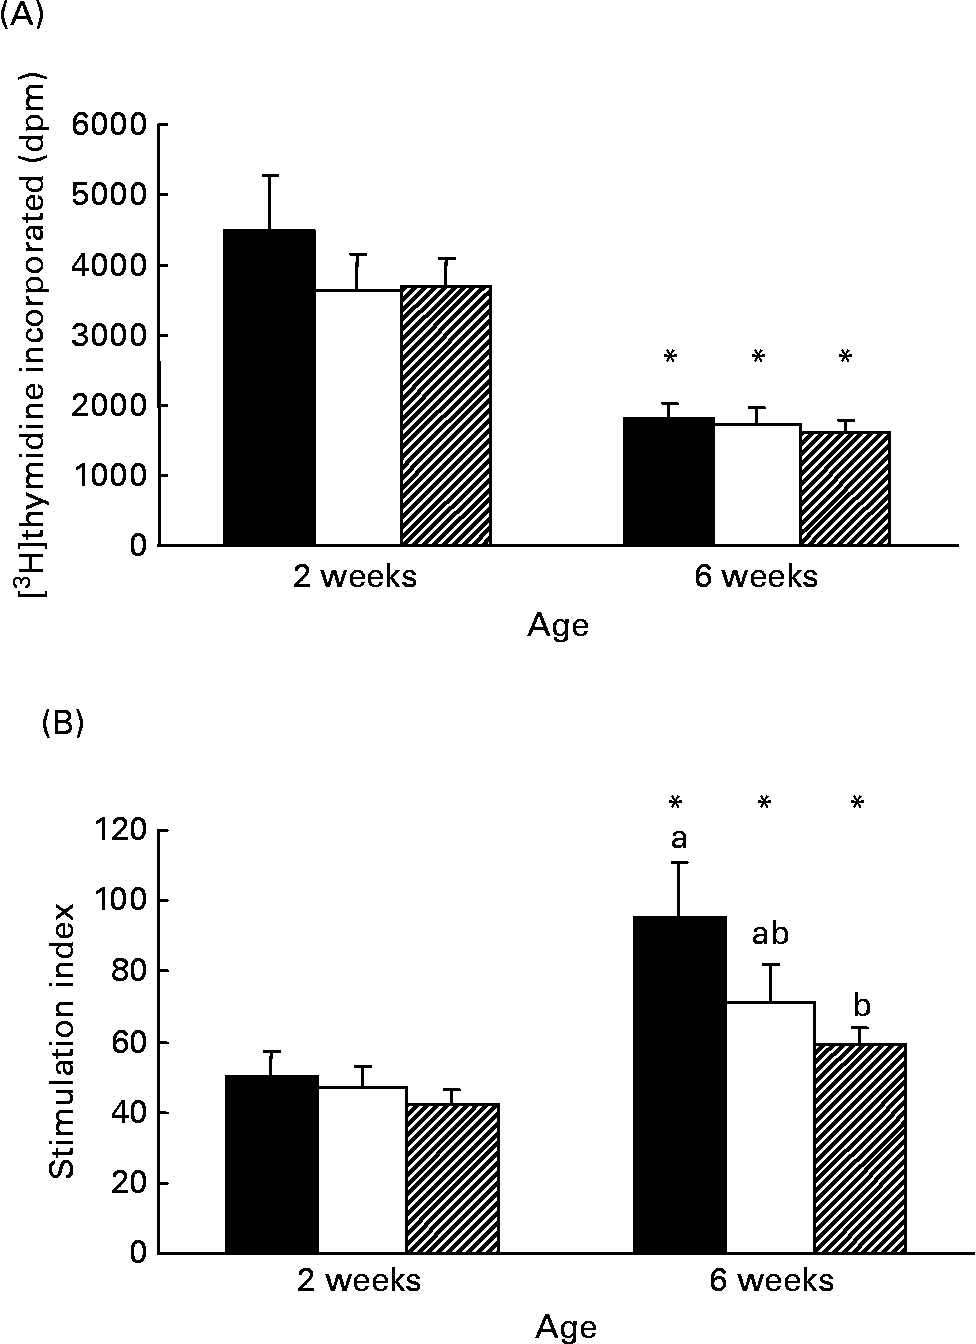
Fig. 1 Responses of peripheral blood lymphocytes from infants fed human milk (HM; ■), unsupplemented infant formula (Formula; □) or infant formula supplemented with long-chain PUFA (Formula+LCP; ![]() ) to phytohaemagglutinin (PHA) stimulation. (A) Amount of [3H]thymidine (disintegrations per min; dpm) incorporated during the last 18 h of a 48 h culture without mitogen. (B) Stimulation index calculated during the last 18 h of a 48 h culture with PHA (amount of [3H]thymidine (dpm) incorporated by cells in the presence of PHA/amount of [3H]thymidine (dpm) incorporated by cells in the absence of PHA). Values are means for fifteen HM-fed infants, thirteen Formula-fed infants and fifteen Formula+LCP infants, with standard errors represented by vertical bars. a,b At a given age, mean values with unlike letters are significantly different (P < 0·05). * For each diet group, mean value was significantly different from that at 2 weeks (P < 0·05).
) to phytohaemagglutinin (PHA) stimulation. (A) Amount of [3H]thymidine (disintegrations per min; dpm) incorporated during the last 18 h of a 48 h culture without mitogen. (B) Stimulation index calculated during the last 18 h of a 48 h culture with PHA (amount of [3H]thymidine (dpm) incorporated by cells in the presence of PHA/amount of [3H]thymidine (dpm) incorporated by cells in the absence of PHA). Values are means for fifteen HM-fed infants, thirteen Formula-fed infants and fifteen Formula+LCP infants, with standard errors represented by vertical bars. a,b At a given age, mean values with unlike letters are significantly different (P < 0·05). * For each diet group, mean value was significantly different from that at 2 weeks (P < 0·05).
Table 5 Cytokine production after 48 h with or without phytohaemagglutinin (PHA)
(Mean values and standard deviations)
HM, human milk; Formula, unsupplemented infant formula; Formula+LCP, formula supplemented with long-chain PUFA; IFN, interferon; TGF, transforming growth factor.
a,b Mean values within a row with unlike superscript letters are significantly different (P < 0·05; least-square means).
* Mean value, within a group, is significantly different from that at 2 weeks of age (P < 0·05).
† Differences between diet and age were identified using a mixed-model repeated-measures ANOVA. The P value presented represents the effect of diet.
‡ At 2 weeks (baseline) there were no significant differences between the infants allocated to the formula groups; therefore values for all formula-fed infants were combined and are presented as one mean.
Estimation of proliferation
The response to PHA (stimulation index) was not different among groups at 2 weeks and increased (P < 0·05) with age for all groups (Fig. 1 (A) and Fig. 1 (B)). However, the response at 6 weeks was significantly lower for the Formula+LCP group, compared with HM-fed infants (Fig. 1 (B)).
Production of cytokines in response to stimulation
At age 2 weeks, the production of TNF-α and IFN-γ was higher in PHA-stimulated supernatant fractions from formula-fed infants than HM-fed infants (Table 5). As the infants in the Formula group produced more TNF-α in the absence of mitogens at 2 weeks, a corrected production was also determined that accounted for the amount produced in the absence of mitogens (data not shown). Even after correcting for unstimulated production, cells from the infants in the two formula groups produced more TNF-α at 2 weeks when stimulated with PHA than HM-fed infants. At 6 weeks, both formula groups produced more IFN-γ than the HM group. Infants fed the Formula produced more TNF-α than the Formula+LCP group, which did not differ from the amount produced by HM-fed infants (Table 5).
Phenotypes of cells remaining in culture after stimulation
Compared with HM-fed infants, at 2 weeks there was a higher proportion of CD4+ and a lower proportion of CD11c+ cells and at 6 weeks there was a higher proportion of CD4+ cells and a lower proportion of CD16+CD11c+ cells after PHA stimulation for infants fed either formula (P < 0·05; Table 6).
Table 6 Post-culture peripheral blood cell phenotypes at 2 and 6 weeks of age by dietary group after 48 h stimulation with phytohaemagglutinin (PHA) (percentage of live cells remaining in culture)†
(Mean values and standard deviations)
Formula, unsupplemented infant formula; Formula+LCP, infant formula supplemented with long-chain PUFA; HM, human milk.
a,b Mean values within a row with unlike superscript letters are significantly different (P < 0·05).
* Mean value, within a group, is significantly different from that at 2 weeks of age (P < 0·05).
† Values are means of total gated cells (unless otherwise indicated) collected after 48 h of stimulation in the presence of PHA.
‡ The following cell phenotypes are not illustrated as there were no differences with age or amongst diet groups. The mean percentages of gated cells at 6 weeks were: CD14+, 1 (sd 1) % (n 42); CD 16+, 4 (sd 2) % (n 43); CD16+CD11B+, 1 (sd 2) % (n 42); CD11B+, 14 (sd 21) % (n 42); CD54+, 80 (sd 16) % (n 42); CD20+, 11 (sd 6) % (n 42); CD20+CD80+, 2 (sd 2) % (n 42).
§ Differences between diet and age were identified using a mixed-model repeated-measures ANOVA. The P value presented represents the effect of diet.
Discussion
The present study demonstrates that diet during the first 6 weeks of life influences both the presence of specific cell types in peripheral blood and their ability to produce cytokines in response to a polyclonal T cell mitogen. More specifically, feeding a formula containing LCP between 2 and 6 weeks of age significantly influenced functional indices of peripheral immune cells at age 6 weeks as summarised in Fig. 2 (B). Cells from infants fed the Formula+LCP incorporated less [3H]thymidine (assessed by a stimulation index) after stimulation than the HM-fed infants. Plant lectins such as PHA are commonly used to mimic microbial superantigens, and are measured using a number of parameters, including the rate of [3H]thymidine uptake, production of cytokines and expression of activation markers. One possible contribution to the lower response by the LCP-fed infants might have been the higher proportion of CD8+ (CD8+CD28+) suppressor/cytotoxic cells in peripheral blood at 2 weeks in the infants randomised to the LCP group. Although this possibility can not be completely eliminated, it is probably not the sole explanation for the lower proliferative response by cells from this group. Our findings are consistent with the adult human and animal literature where feeding DHA (although at higher levels than used in the present study) are reported to reduce the rate of mitogen-stimulated [3H]thymidine incorporationReference Calder7, Reference Arrington, Chapkin, Switzer, Morris and McMurray18, Reference Peterson, Jeffery, Thies, Sanderson, Newsholme and Calder19. Although the absence of this response in vitro is associated with significant immunosuppression (anergy) in vivo Reference Richter and Mandl20, there is limited information on what a lower response might mean in vivo. In young mice, a lower in vitro proliferative response after feeding DHA or EPA was not found to significantly compromise in vivo immune potentialReference Kuratko21. In support of this, the production of IL-2 after PHA stimulation did not differ among groups, suggesting cellular function was not compromised. Additionally, the Reference Wilson, Penix, Weaver, Melvin and Lewis[3H]thymidine uptake response was not significantly different between the two formula groups.
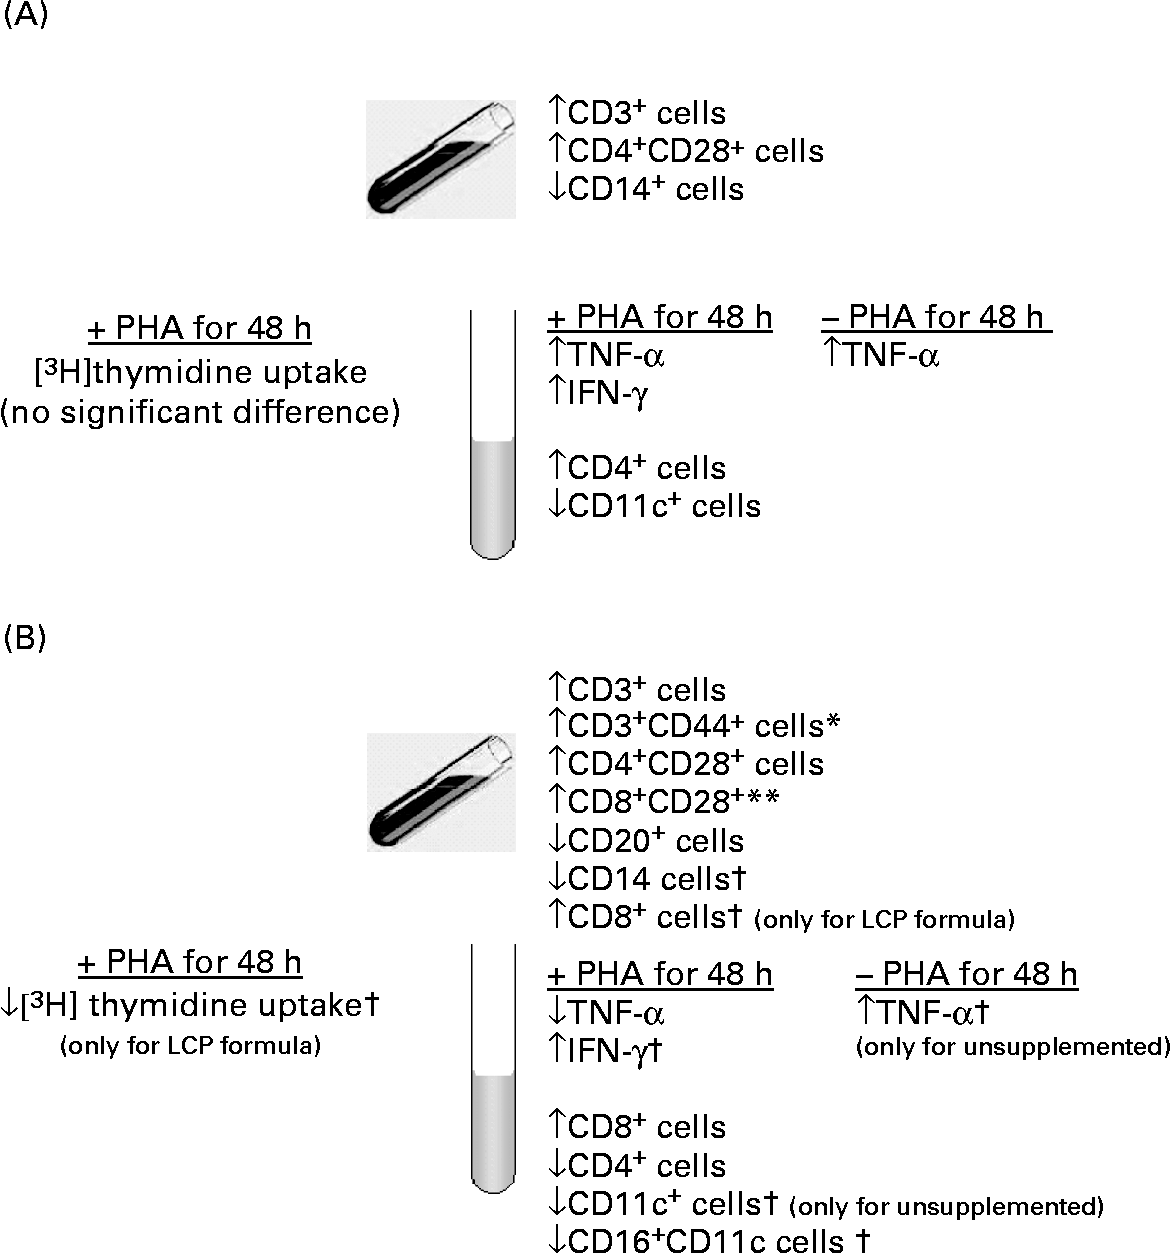
Fig. 2 Summary of the significant effects on immunity (A) in infants exposed to human milk (HM) during the first 2 weeks of life as compared with infants exclusively fed HM and (B) in infants fed a formula containing long-chain PUFA (LCP) for 4 weeks compared with those fed an unsupplemented formula. *Unsupplemented formula group was significantly different from HM-fed infants. ** Response by infants fed the LCP-supplemented formula was significantly different from HM-fed infants. † Response by infants did not differ between formula groups but was significantly different from infants fed HM in the direction of the arrow.
Cytokine production and the expression of activation markers on cells have been suggested as an alternative, and perhaps more physiologically relevant, assessment of the ability of cells to respond to stimulation. At 6 weeks both cytokine production (TNF-α) and the type of cells post-PHA stimulation in infants fed Formula+LCP were more similar to that of HM-fed infants than these measures observed for the unsupplemented Formula group. Although we did not measure TNF-α in our earlier study in preterm infants, the general observation of a more similar cytokine profile to HM-fed infants in infants fed LCP-containing formula is consistent with our conclusions in preterm infants fed LCP-containing formulaReference Field, Thomson, Van Aerde, Parrot, Euler and Clandinin13. The clinical implications of a higher production of TNF-α after stimulation by the Formula group compared with the HM-fed group is not known.
At age 6 weeks, there were a number of differences in the phenotypes of peripheral blood mononuclear cells between infants fed the Formula and the Formula+LCP that might have contributed to these differences in cytokine production (Fig. 2 (B)). Some caution should be used when interpreting these differences due to the number of comparisons made. The Formula group had significantly fewer peripheral blood CD4+CD28+ and CD3+CD44+ cells than those fed Formula+LCP. The lower proportion of CD3 (total and mature CD3+CD44+ and CD4+CD28+) cells in the Formula-fed group compared with the Formula+LCP group suggests an effect of LCP on T cell maturation, which may have contributed to the different response to PHA.
In all three groups, the rate of [3H]thymidine incorporation by lymphocytes cultured without mitogen decreased, but increased after mitogen stimulation between 2 and 6 weeks of age. To our knowledge, a change in the apparent ‘in vivo activation’ (response in the absence of mitogen) of peripheral blood lymphocytes with age has not been previously reported. During this same period there was a 2-fold increase in the proportion of B cells (CD20+) and a greater than 2-fold decrease in the production of the inflammatory cytokine IL-6 in the absence of mitogen. Although it has been long assumed that neonatal cells are ‘immunosuppressed’, it was recently reported that preterm infants have a higher percentage of both IL-6- and IL-8-positive cells in blood, compared with adultsReference Schultz, Rott, Temming, Schlenke, Moller and Bucsky22. This is suggestive of a well-developed, perhaps even enhanced, inflammatory response in preterm infants. IL-6 has been shown to suppress the thymidine response to PHAReference Taylor23, Reference Taylor, Shacks and Qu24, thus the lower production of IL-6 with age may have contributed to the higher PHA response by cells in all three diet groups at age 6 weeks.
Although not the main purpose of the present study, significant differences were observed in immune cell types and function between infants who had and those who had not been fed commercial formula during the first 10 d of life and are summarised in Fig. 2 (A). None of the infants recruited consumed formula that contained DHA or AA. Although the ability to proliferate (as estimated by the rate of [3H]thymidine uptake and the production of IL-2) was not different, cells from infants fed formula before the baseline measure produced more TNF-α (2 times) in the absence of mitogen and 1.8 times more TNF-α (even after correction for the unstimulated) and 2.5 times more IFN-γ after incubation with PHA. The greater proportion of T cells (total and CD28+) and fewer CD14+ cells in the formula-exposed group may have contributed to this response. Cells from both groups of formula-fed infants had a lower proportion of monocytes (CD14+ cells) at both 2 and 6 weeks of age, compared with HM-fed infants. Monocytes and macrophages play a central role in both specific and non-specific immunity against bacterial, viral and fungal infection. At 6 weeks, after stimulation, both formula groups had a lower proportion of CD16+CD11c+ cells. As the concentration of CD16+ cells was not different between groups, before and after stimulation, the lower expression of CD11c (an integrin) suggests a lower monocyte and macrophage or natural-killer cell response to stimulation. Natural killer cell activity was not measured in the present study but was reported to be lower at age 6 months in formula-fed infants compared with those fed human milkReference Hawkes, Neumann and Gibson25.
In conclusion, compared with cells from infants exclusively fed HM, feeding a commercial formula with added DHA and AA resulted in a lower rate of [3H]thymidine uptake in response to PHA but resulted in an immune cell distribution and cytokine profile that was more similar to that of the infants fed HM than that observed in infants fed the unsupplemented formula. Additionally, it was found that feeding formula by age 2 weeks altered the types of cytokines produced in the direction of a more pro-inflammatory response after PHA stimulation. Differences in the ability and type of immune response produced by minor changes in the lipid composition of formula may be of physiological importance but require further study.
Acknowledgements
We acknowledge Susan Goruk for outstanding technical assistance and Bodil Larsen for her excellent skills in coordinating the study. We also acknowledge the significant help in the design and conducting of the present study by Kathryn Pramuk of the Medical Affairs Department of Wyeth Nutrition. The present study was supported by a grant from Wyeth Nutrition and MTI Meta Tech Inc.


