


Obesity is a common feline nutritional disorder, with surveys reporting between 25 and 57 % of cats characterised as overweight or obese( Reference Scarlett, Donoghue and Saidla 1 , Reference Linder and Mueller 2 ). Obesity can be defined as an excess of body fat sufficient to impair health or body function and is generally recognised as 20–25 % above ideal body weight (BW) in cats( Reference Linder and Mueller 2 ). Obese cats face an increased risk of musculoskeletal problems, diabetes mellitus and hepatic steatosis( Reference Lund, Armstrong and Kirk 3 , Reference Zoran 4 ).
The underlying cause of obesity is an imbalance between energy intake and energy expenditure, resulting in increased energy storage as fat. Exogenous factors leading to energy imbalance include activity level, diet composition and palatability, as well as environment and lifestyle. Endogenous factors include age, sex, reproductive status, hormonal abnormalities and genetics. Of endogenous factors, neutering is the most evinced. Studies have shown that intact adult cats generally weigh less than neutered cats of the same breed and size( Reference Duch, Chow and Homar 5 – Reference Fettman, Stanton and Banks 9 ). Neutering in cats leads to increased food intake and weight gain due, in part, to changes in growth-promoting and satiety hormones( Reference Flynn, Hardie and Armstrong 8 , Reference Martin, Siliart and Dumon 10 – Reference Wei, Fascetti and Kim 14 ). Treatment of obesity frequently focuses on energy restriction; however, lack of owner compliance often results in failure. Therefore, additional strategies are needed to promote weight loss in cats.
One potential strategy involves manipulation of the faecal microbiota. The gut harbours a collection of viruses, bacteria, fungi and parasites collectively referred to as the faecal microbiota( Reference Clemente, Luke and Laura 15 ). Bacteria are the most well-characterised members of the faecal microbiota and have been shown to influence host metabolism( Reference Everard and Cani 16 ) including the development of obesity in humans( Reference Everard and Cani 17 ). Undesired changes in bacterial composition or function are thought to increase BW and adiposity through a variety of mechanisms including increased inflammation( Reference Belkaid and Timothy 18 ), increased energy extraction from diet( Reference Kallus and Brandt 19 ) and altered production of host satiety hormones( Reference Flint 20 ). In humans, obese individuals are reported to have greater proportions of Firmicutes and reduced levels of Bacteriodetes compared with lean controls( Reference Ley, Bäckhed and Turnbaugh 21 ). Transplanting faecal microbiota from obese mice into germ-free mice recapitulated the obese phenotype in the germ-free mice, whereas germ-free mice receiving microbes from lean mice remained lean( Reference Ley, Turnbaugh and Klein 22 ). One factor shown to greatly alter the faecal microbiota is diet. In mice, high-fat diets have been shown to increase the Firmicutes:Bacteroidetes ratio( Reference Murphy, Cotter and Healy 23 ) and increase blood concentrations of bacterial-derived pro-inflammatory products containing pathogen-associated molecular compounds (i.e. flagellin, lipopolysaccharide)( Reference Cani, Bibiloni and Knauf 24 , Reference Vijay-Kumar, Aitken and Carvalho 25 ). These bacterial products bind to host immune receptors and induce chronic low-grade inflammation, which over time can lead to impaired satiety hormone signalling resulting in hyperphagia( Reference de La Serre, Ellis and Lee 26 ).
Manipulation of gut bacterial populations using diet or antibiotics may be a viable strategy to promote a healthy BW in cats. Studies have characterised the feline faecal microbiota( Reference Ritchie, Burke and Garcia-Mazcorro 27 , Reference Deusch, O’Flynn and Colyer 28 ); however, few have examined the effect of neutering, obesity and weight loss. The aim of this study was to compare the feline faecal microbiota composition in (1) lean neutered and lean intact cats, (2) lean neutered and obese neutered cats and (3) obese neutered cats before and after 6 weeks of energy restriction with the goal of identifying microbial shifts that occur with neutering or energy restriction.
Methods
Approval of the experimental protocol (Protocol 17261) was granted by the Institutional Animal Care and Use Committee of the University of California, Davis.
Animals and diets
In all, twenty-four adult (range 1–12 years; median age 6·4 years), specific pathogen free, domestic shorthair cats owned by the University of California were used in this study. There were eight obese (four male and four female); eight lean intact (four male and four female); and eight lean neutered (six male and two female) cats. A nine-point body condition score (BCS) system was used( Reference Laflamme 29 ), where a score of 5 was considered ideal, a score >5 and <7 was considered overweight and a score >7 was considered obese. All cats were group-housed in a light (14 h light–10 h dark cycle)- and temperature (18–24°C)-controlled facility at the University of California, Davis, in an enriched environment (perches, rotating toys and scratching poles) and were brushed and socialised once a day. Cats were individually housed for faecal and blood collections. Fresh water was available at all times, except before body composition determination. All cats consumed the same extruded dry-type diet for at least 8 weeks before entering and throughout the study. All cats were fed the same batch of diet for the duration of the study. The nutrient composition of the diet provided by the manufacturer (Mars Petcare) was 39·84 % protein, 12·52 % fat, 38·28 % N-free extract, 2·66 % total dietary fibre (2·3 % insoluble and 0·3 % soluble dietary fibres) and 6·7 % ash (all on an as-fed basis; calculated metabolisable energy=14585 kJ/kg). The main ingredients in the diet were poultry by-product meal, maize gluten meal, soyabean meal, brewers rice, ground yellow maize, ground wheat and animal fat. The diet met the nutritional recommendations for all life stages in cats( 30 ).
Study design
Before the start of the study, each cat underwent a physical examination and blood collection for a serum chemistry panel and complete blood count.
Lean intact and lean neutered cats
The lean intact (four male and four female; mean age 5·75 years (range 1–10 years)) and lean neutered (six male and two female; mean age 6·25 years (range 4–12 years)) cats were group-housed and consumed the previously described diet ad libitum for at least 8 weeks. Neutered cats were castrated or spayed 1–6 years before entering the study. Food intake was not measured in these two groups. It may be argued that this would be a study limitation; however, cats were weighed weekly and remained weight-stable long before and throughout the duration of the study, indicating that these cats were consuming food in a quantity close to the standards of maintenance requirements. The night before blood and faecal collection for body composition determination and microbe analysis, cats were BCS and moved into individual cages. Following collection of final blood and faecal samples, all cats were returned to group housing in the feline facility.
Energy restriction of obese neutered cats
The obese neutered cats (four male and four female; mean age 7·25 years (range 1–11 years)) were castrated or spayed 1–6 years before entering the study. Cats were briefly individually housed twice a day and fed the above-described diet ad libitum for 10 d, during which time their BW and food intake were stable. The cats were then fed 60–70 % of their previously measured energy intake for a period of 6 weeks. The target for weight loss was 0·5–1 % of BW/week. We confirmed that the diet would still meet the National Research Council’s recommended allowance for adult cats, even with up to 40 % energy restriction( 31 ). Iodine was the one nutrient that was just below the National Research Council’s recommended allowance for adult cats, but it exceeded the Association of American Feed Control Officials recommendations( 30 ). Body composition was determined, and faecal and blood samples were taken before the start and end of energy restriction. BW was measured weekly and BCS was determined every other week by the same person.
Parameters evaluated
Body composition determination
Estimation of body fat mass (FM) and lean mass was determined using the deuterium oxide (D2O) isotopic dilution method previously described( Reference Backus, Havel and Gingerich 32 ) with modifications( Reference Wei, Fascetti and Villaverde 33 ). D2O was purchased from Fisher Scientific. A basal blood sample (3 cc), without D2O enrichment, was obtained by jugular venepuncture. Cats were fasted (12 h) before sample collection, and water was withheld from cats 2 h before collection. D2O (0·4 g D2O/kg BW) was administered to the cats subcutaneously and allowed to equilibrate for 3 h, after which a D2O-enriched blood sample (3 cc) was collected. Condensed serum water samples were analysed on an ATI Mattson Infinity Series Fourier transform IR spectrometer equipped with a class 2A laser.
Faecal collection and characterisation of faecal microbiota via bacterial 16 S rRNA gene sequencing
Fresh faecal samples for each cat were collected from the litter box once daily over 3 consecutive days into sterile tubes, stored at −80°C and pooled. Cats were observed every 15 min by the primary author and staff at the facility, and faeces was only considered fresh if collected within 15 min of defecation. Bacterial DNA was extracted by a bead-beating method using a commercial DNA extraction kit (Mo Bio PowerSoil Kit; Qiagen) according to the manufacturer’s instructions. The bead-beating step was performed on a homogeniser for 60 s at a speed of 4 m/s. Amplification of the 16S rRNA genes was carried out using a universal bacterial primer (27F-519R) for V3–V4 region to amplify DNA in a single-step, 30-cycle PCR reaction using the HotStarTaq Plus Master Mix Kit (Qiagen) under the following conditions: 94°C for 3 min, followed by twenty-eight cycles of 94°C for 30 s, 53°C for 40 s and 72°C for 1 min, after which a final elongation step at 72°C for 5 min was performed. Following the PCR reaction, all amplicon products from different samples were pooled in equal concentrations and purified using AgencourtAmpure beads (Agencourt Biosciences). Samples were sequenced using Roche 454 FLX titanium instruments and reagents according to the manufacturer’s guidelines.
16S rRNA gene data processing
The Q25 sequence data were processed using a proprietary analysis pipeline (www.mrdnalab.com)( Reference Capone, Dowd and Stamatas 34 , Reference Swanson, Dowd and Suchodolski 35 ). In brief, sequences were trimmed of barcodes and primers, and then sequences <150 bp were removed, as were sequences with ambiguous base calls and homopolymer runs exceeding 6 bp. Operational taxonomic units (OTU) were generated by clustering at 3 % divergence (97 % similarity) from de-noised sequences, and chimeras were removed. Final OTU were taxonomically classified using BLASTn (closed reference) against a curated database generated from sequences from GreenGenes( Reference DeSantis, Hugenholtz and Larsen 36 ) and Ribosomal Database Project (RDP-II)( Reference Cole, Wang and Fish 37 ) and National Center of Biotechnology Information (NCBI). We obtained a mean of 7701 (sem 1362) individual sequencing reads per sample (min.=4423; max.=17 893). After data processing, the average number of sequences for each sample passing through to OTU classification was 4491 (sem 351). The average number of OTU per sample was 548. Data were compiled into each taxonomic level as the percentage of sequences within each sample that map to the designated taxonomic classification. Rarefaction was performed to reduce sequencing depth bias. The depth cutoff (2818) was defined by the samples with the lowest number of reads. Alpha and beta diversity measures were calculated using the QIIME software (QIIME 1.8.0). Raw sequences reads were deposited at NCBI’s Sequence Read Archive (http://www.ncbi.nlm.nih.gov/Traces/sra) under accession no. SRP066010.
Statistical analysis
Very low abundance taxa (<0·1 %) or taxa not represented within at least 50 % of the samples within a group were excluded from analysis. Partial least squares-discriminant analysis (PLS-DA) was performed on unadjusted means of genus-level microbiota abundance data. For group comparisons, ANCOVA was performed with sex and age as covariates (Fig. 2(a)–(c)). Significance of differences between lean intact v. lean neutered cats and lean neutered v. obese neutered cats was assessed by Tukey’s honest significant difference test while controlling for a family-wise type I error. Significance of difference between obese neutered cats before and after energy restriction was assessed by paired, two-tailed Student’s t test. A Spearman’s correlation matrix of age and body composition v. bacterial genera was obtained to assess magnitudes of their correlation. All statistical analyses were performed using R. A two-sided P value of 0·05 was considered significant. A P value ≤0·1 is considered as representative of a trend.
Results
No adverse clinical changes were observed throughout the experiment. There were no significant effects of sex or age on any of the variables. Average food intake by obese cats during ad libitum and energy restriction phases was 73·7 and 51·6 g/d, respectively.
Body weight and composition
There were no differences in BW, lean or FM between the lean intact and lean neutered cats (Table 1). The lean neutered cats had a lower (P<0·05) lean body mass compared with the obese neutered cats. After 6 weeks of energy restriction, the obese cats lost, on average, 1 % of BW/week, resulting in an 18 % reduction in FM but not lean mass and a small but significant reduction in BW.
Table 1 Body composition of lean intact, lean neutered and obese neutered cats before and after 6 weeks of energy restriction (Mean values with their standard errors; n 8/group)
* Significance assessed by two-tailed paired Student’s t test.
† ANCOVA for group comparisons in mean, adjusted for age and sex as covariates for first three independent groups (lean intact, lean neutered and obese neutered).
‡ Tukey’s honest significant difference test for post hoc pairwise comparisons on ANCOVA-adjusted means.
Microbial diversity
Alpha and beta diversity measures of the faecal microbiota were examined. Only the lean neutered group showed a difference in alpha diversity using the phylogenetic measure, Faith’s whole-tree phylogenetic diversity (Fig. 1(a), online Supplementary Table S1). This reduced diversity was not observed using non-phylogenetic measures of diversity such as Shannon, Chao or the number of observed species. Beta diversity was also evaluated. Principal coordinates analyses using unweighted and weighted UniFrac distances clearly demonstrated lack of separation of the groups, indicating no difference in beta diversity between the groups (Fig. 1(b) and (c)).
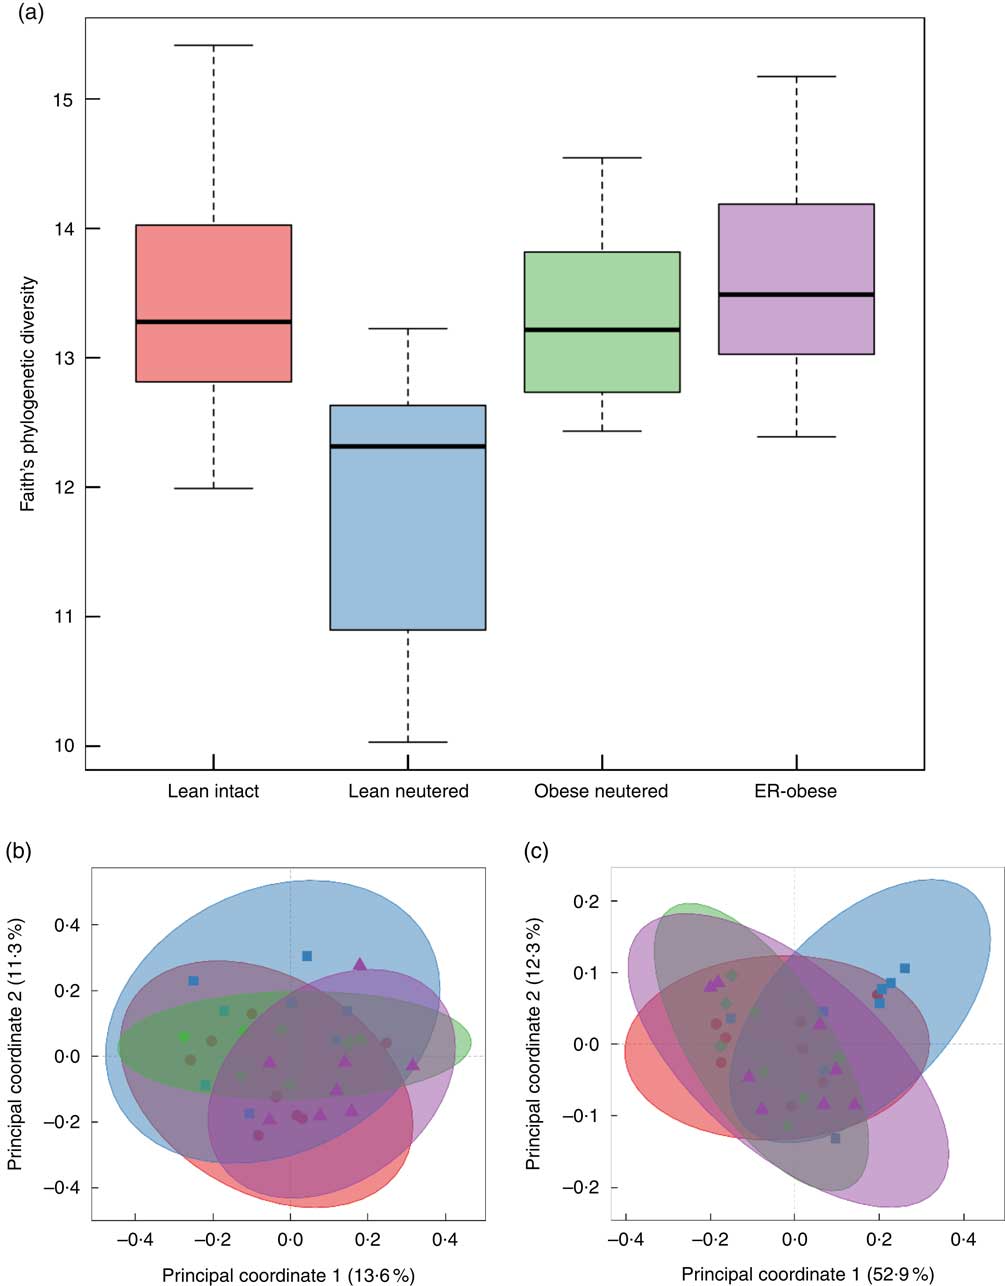
Fig. 1 Alpha diversity and beta diversity of faecal microbiota. Alpha diversity was evaluated using Faith’s whole-tree phylogenetic diversity metric. (a) Phylogenetic metrics, unweighted (b) and weighted (c) UniFrac, were used to assess beta diversity of the faecal microbiota. b and c: ![]() , Lean intact;
, Lean intact; ![]() , lean neutered;
, lean neutered; ![]() , obese neutered;
, obese neutered; ![]() , energy-restricted (ER)-obese.
, energy-restricted (ER)-obese.
Multivariate analyses of faecal microbiota
As an initial investigation to determine whether we could identify signatures related to the effects of neutering (Fig. 2(a)), obesity (Fig. 2(b)) and energy restriction in the context of obesity (Fig. 2(c)), we performed PLS-DA using genus-level abundance data. Indeed, in each comparison, PLS-DA discriminated the groups as shown by the scores plots. The loadings show the relative contributions of specific variables to group separation in each comparison. To assess the statistical importance of the variables driving the separation of the groups, we calculated variable importance in projection scores and used scores above the 90th percentile as a cutoff for the most significant contributors (online Supplementary Table S2). Notably, different genera were identified as discriminatory for each comparison. When comparing lean intact v. lean neutered cats, we identified the genera Bacteroides, Eubacterium, Faecalibacterium, Phascolarctobacterium and Sutterella as important discriminators of the intact v. neutered state. In obesity, we identified Prevotella, Acidaminococcus and Phascolarctobacterium as important in distinguishing lean v. obese neutered cats. In the case of energy restriction, Acidaminococcus, Bacillus, Dorea, Phascolarctobacterium, Sarcina and Staphylococcus were the key contributors to the distinction of the same cat before and after energy restriction.
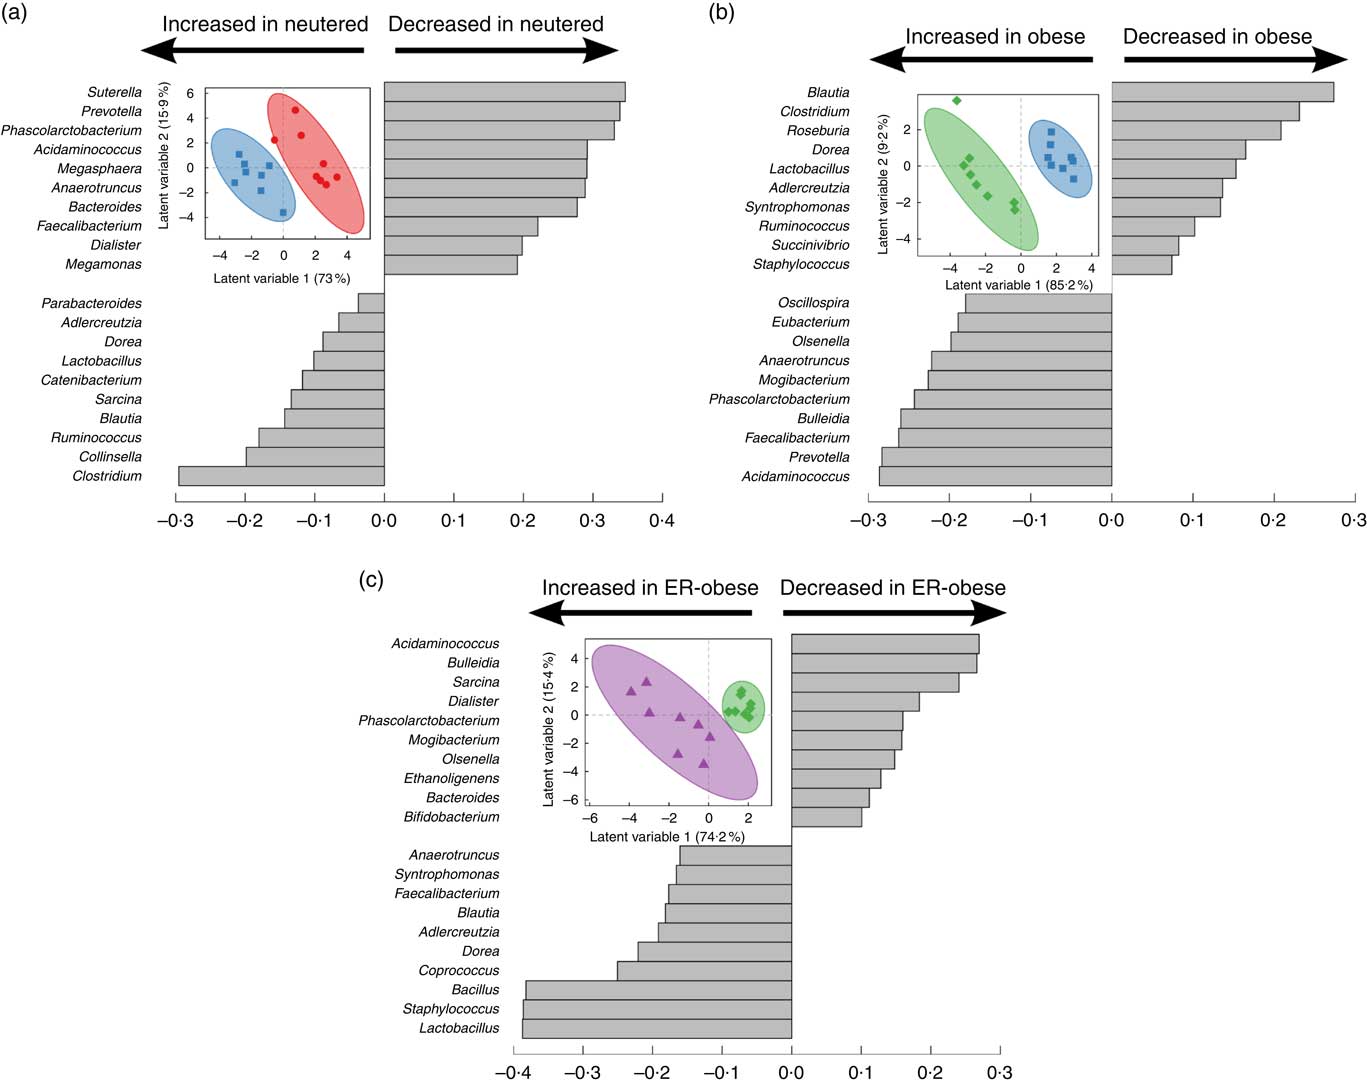
Fig. 2 Partial least squares-discriminant analysis reveals discriminating characteristics of genus-level microbiota with respect to neutering between lean intact (![]() ) v. lean neutered (
) v. lean neutered (![]() ) (a), obesity (lean neutered (
) (a), obesity (lean neutered (![]() ) v. obese neutered (
) v. obese neutered (![]() )) (b) and energy restriction (obese neutered (
)) (b) and energy restriction (obese neutered (![]() ) before v. after energy restriction (
) before v. after energy restriction (![]() , energy-restricted (ER)-obese)) (c). Inset in each panel displays the scores plot (clustering based on group assignment), with the coloured ellipses representing the 95 % confidence of the populations as calculated based on Hotelling’s T2 test; each symbol represents an individual cat. Discrimination of the groups in the scores plot was explained by the variance in the variables indicated in the loadings plot in each panel.
, energy-restricted (ER)-obese)) (c). Inset in each panel displays the scores plot (clustering based on group assignment), with the coloured ellipses representing the 95 % confidence of the populations as calculated based on Hotelling’s T2 test; each symbol represents an individual cat. Discrimination of the groups in the scores plot was explained by the variance in the variables indicated in the loadings plot in each panel.
Phylum-level faecal microbiota
The overall mean phylum-level proportions observed in the cat faecal microbiota from all groups in decreasing order of abundance were as follows: Firmicutes (65·8 %), Bacteroidetes (25·2 %), Proteobacteria (3·52 %), Actinobacteria (2·20 %) and Fusobacteria (0·3 %). The majority of change in the faecal microbiota was observed between the lean neutered and obese neutered cats. The lean neutered cats had significantly greater proportions of the phylum Firmicutes (P<0·05) and significantly lower proportions of Bacteroidetes (P<0·05) (Table 2) compared with obese neutered cats. There was also a trend (P<0·10) towards the lean neutered cats showing this same shift in Firmicutes and Bacteroidetes populations compared with the lean intact cats. There were no other phylum-level differences between lean intact and lean neutered cats or obese neutered cats before and after energy restriction.
Table 2 Predominant bacterial phyla (expressed as a percent abundance) in the faeces of lean intact, lean neutered and obese neutered cats before and after 6 weeks of energy restriction (Mean values with their standard errors; n 8/group)
* ANCOVA for group comparisons in mean, adjusted for age and sex as covariates for first three independent groups (lean intact, lean neutered and obese neutered).
† Tukey’s honest significant difference test for post hoc pairwise comparisons on ANCOVA-adjusted means.
‡ Significance assessed by two-tailed paired Student’s t test.
Family-level faecal microbiota
A total of eighteen bacterial families were identified in the faecal samples. Within the Firmicutes phylum, Lachnospiraceae, Peptostreptococcaceae, Veillonellaceae and Ruminococcaceae were the predominant families identified in cat faeces (Table 3). The greater abundance of Firmicutes and reduced proportions of Bacteroidetes in the lean neutered cats compared with obese neutered cats was driven by significantly greater proportions of Peptostreptococcaceae (P=0·015) and reduced proportions of Prevotellaceae (P=0·05). An unidentified family within the order Bacteroidales showed a trend for an increase in the obese neutered cats (P=0·077). There were notable family-level differences between lean intact and lean neutered cats; however, these did not reach statistical significance. There was a trend for 2-fold greater abundance of Peptostreptococcaceae (P=0·057) in the lean neutered cats compared with lean intact cats. In addition, there was a tendency towards decreased Clostridiaceae (P=0·063) in obese cats after energy restriction.
Table 3 Bacterial families (expressed as a percent abundance) in the faeces of lean intact, lean neutered and obese neutered cats before and after 6 weeks of energy restriction (Mean values with their standard errors; n 8/group)
* ANCOVA for group comparisons in mean, adjusted for age and sex as covariates for first three independent groups (lean intact, lean neutered and obese neutered).
† Tukey’s honest significant difference test for post hoc pairwise comparisons on ANCOVA-adjusted means.
‡ Significance assessed by two-tailed paired Student’s t test.
§ Unknown family within the order Bacteroidales.
|| Unknown family within the order Clostridales.
¶ Unknown family within the Class Clostridia.
Genus-level faecal microbiota
Blautia, Bacteroides, Catenibacterium, Clostridium, Megasphaera, Oscillospira, Prevotella, Ruminococcus and Sarcina were the predominant genera identified in cat faeces (Table 4). Most of the statistically significant differences observed were between lean neutered and obese neutered cats. Significant changes were greater abundances in the Bacteriodetes Prevotella and reduced proportions in the Firmicutes Blautia and Clostridium in the obese neutered cats. In the lower abundance genera, there was an increase in Acidaminococcus, Bulleidia and Phascolarctobacterium and a trend for increased Faecalibacterium (P=0·069) in the obese neutered group. After energy restriction, there was a significant decrease in Acidaminococcus and a significant increase in Staphylococcus. Although statistically insignificant at the 0·05 level, several trends were noted including decreases in Bulleidia (P=0·058) and Sarcina (P=0·091) and increases in Bacillus (P=0·059) and Lactobacillus (P=0·055) after energy restriction. Prevotella was less abundant in lean neutered cats (P<0·05) compared with obese neutered cats, and the relative absence of this bacteria was the main contributor to the reduced abundance of Bacteroidetes in this group. Blautia, Clostridium and Lactobacillus were the main bacteria contributing to the greater abundance of Firmicutes observed in lean neutered cats. A notable trend was the 1·9-fold greater abundance of Clostridium (P=0·057) in the lean neutered cats compared with the lean intact cats. While not meeting the P≤0·1 cutoff as a trend, the lean intact and lean neutered group include a nearly 2·5-fold reduced abundance of Prevotella (P=0·104); however, these differences were not statistically significant because of high variability among individual cats (Table 4). Correlations among bacterial genera and age, BW, lean and FM are presented in Fig. 3. Several bacteria significantly correlated with age and body composition.
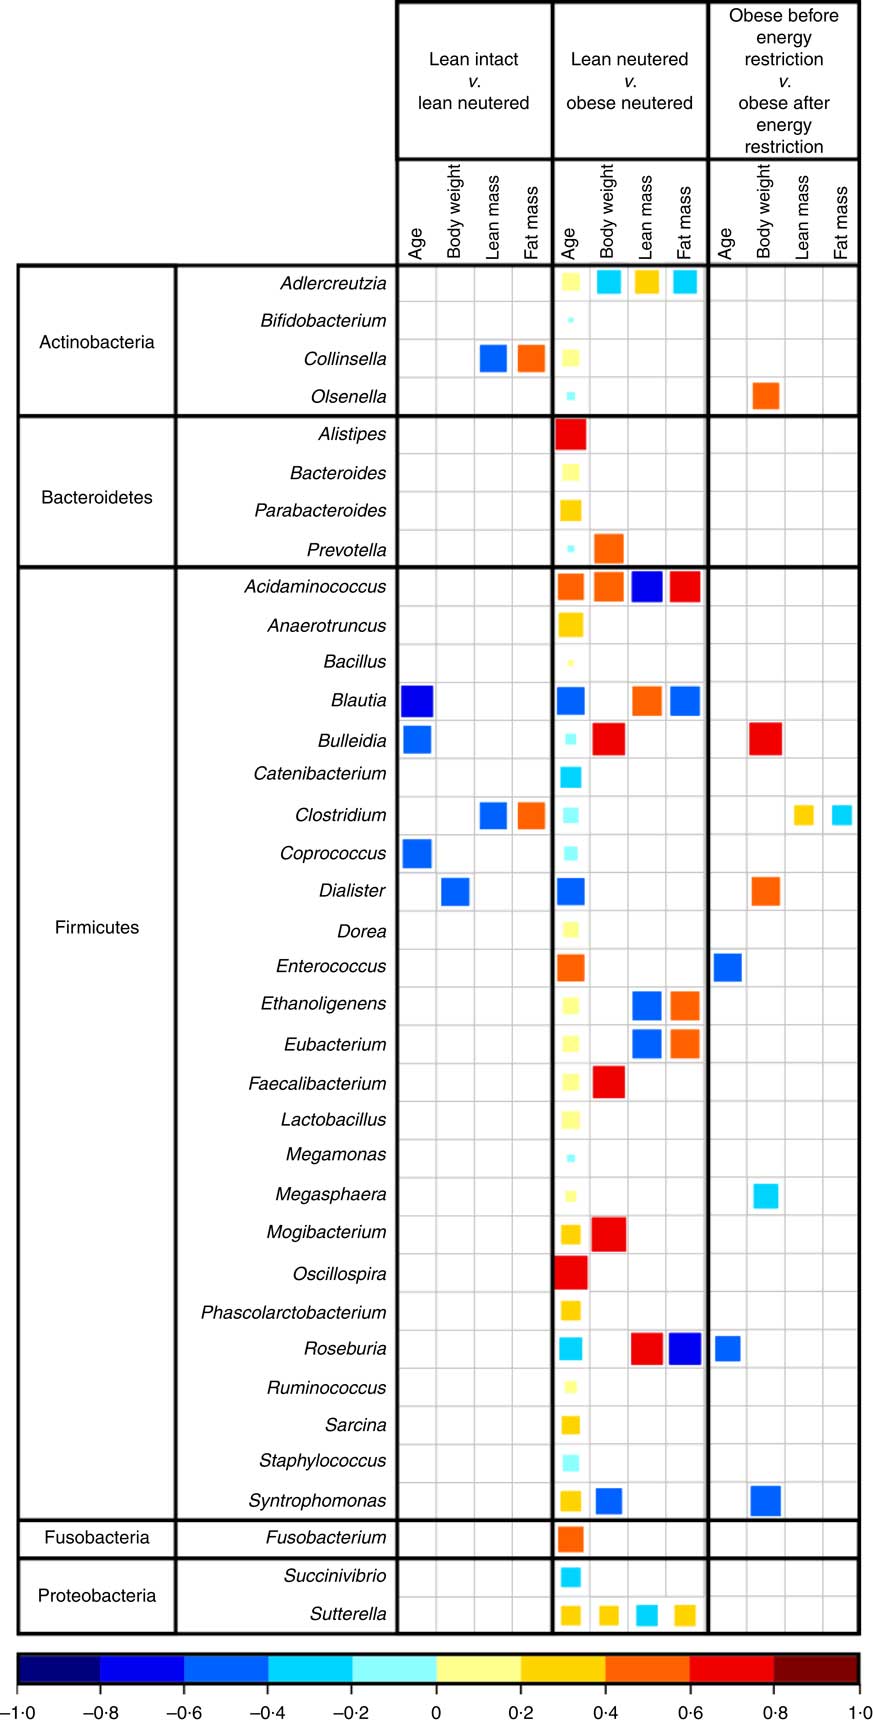
Fig. 3 Spearman’s correlation matrix of age and body composition v. bacterial genera. Only significant correlations are shown (P≤0·05). The coloured bar below the plot indicates positive or negative correlation (Spearman’s ρ rank correlation coefficient) and size of the square indicates strength of correlation (i.e. larger square indicates strong relationship).
Table 4 Bacterial genera (expressed as a percent abundance) in the faeces of lean intact, lean neutered and obese neutered cats before and after 6 weeks of energy restriction (Mean values with their standard errors; n 8/group)
* ANCOVA for group comparisons in mean, adjusted for age and sex as covariates for first three independent groups (lean intact, lean neutered and obese neutered).
† Tukey’s honest significant difference test for post hoc pairwise comparisons on ANCOVA-adjusted means.
‡ Significance assessed by two-tailed paired Student’s t test.
Discussion
To our knowledge, this is the first study comparing gut microbial diversity in lean intact, lean neutered and obese neutered cats before and after energy restriction. The goal of this study was to identify bacterial signatures that distinguish these groups from one another and determine how these bacterial shifts relate to changes in body composition. Inclusion of the lean neutered cats made this study especially unique because cats usually gain weight after neutering, and therefore this group of cats is less common. Post-neutering weight gain is variable, with 6 months post-neutering BW gain ranging from 3 to 53 %( Reference Wei, Fascetti and Kim 14 ); however, the reasons behind this variation have not been fully elucidated. Increased food intake (hyperphagia), due at least in part to neutering-induced hormonal alterations and not decreased energy expenditure, has been identified as the main driver of post-neutering weight gain( Reference Fettman, Stanton and Banks 9 , Reference Kanchuk, Backus and Calvert 11 , Reference Wei, Fascetti and Kim 14 ). Interestingly, previous studies in mice have demonstrated a relationship between the faecal microbiota and FM( Reference Ley, Bäckhed and Turnbaugh 21 ), hyperphagia( Reference Raybould 38 ) and sex hormones( Reference Yurkovetskiy, Burrows and Khan 39 ). Understanding this complex relationship may prove invaluable in the prevention and/or treatment of post-neutering weight gain.
The faecal bacteria identified in this study are comparable to previous studies. The five identified bacterial phyla (Firmicutes, Bacteroidetes, Proteobacteria, Actinobacteria and Fusobacteria) are consistent with previous studies analysing faecal microbiota in cats( Reference Ritchie, Burke and Garcia-Mazcorro 27 , Reference Deusch, O’Flynn and Colyer 28 , Reference Ritchie, Steiner and Suchodolski 40 ). The majority of sequences from the thirty-two faecal samples were classified as Firmicutes, followed by Bacteroidetes. Firmicutes are known to be the predominant phylum in the intestinal tract of animals, and our results were consistent with previous findings in cats( Reference Ritchie, Burke and Garcia-Mazcorro 27 , Reference Deusch, O’Flynn and Colyer 28 , Reference Ritchie, Steiner and Suchodolski 40 , Reference Bermingham, Kittelmann and Henderson 41 ) and dogs( Reference Middelbos, Vester Boler and Qu 42 , Reference Handl, German and Holden 43 ).
The lean neutered cats in this study had 13 % more BW and an increase in percent FM of 18 % compared with the lean intact cats. Group comparisons revealed a trend for the lean neutered cats to harbour significantly more members of the Firmicutes phylum, especially those in the genus Clostridium when compared with lean intact cats. PLS-DA analysis also highlighted the importance of this genus in the discrimination of the groups. Previous studies have found Clostridium to positively correlate with carbohydrate oxidation and negatively correlate with fat oxidation( Reference Kelder, Stroeve and Bijlsma 44 ). We also observed the genus Clostridium to negatively correlate with lean body mass and positively correlate with FM in the lean intact and lean neutered cats. Taken together, these results imply that members of Clostridium may influence host macronutrient metabolism and body composition.
Compared with the obese neutered cats, the lean neutered cats had significantly more Firmicutes and less Bacteroidetes, which is in contrast to that commonly reported for obese mice( Reference Turnbaugh, Backhed and Fulton 45 ) and humans( Reference Ley, Turnbaugh and Klein 22 , Reference Turnbaugh, Hamady and Yatsunenko 46 ). This seemingly contradictory observation lends support to the notion that shifts at lower taxonomic levels (i.e. family or genus) may be more relevant rather than broad phylum-level changes. At the family level the main difference was >2-fold reduced abundance in Peptostreptococcaceae (P=0·015) and an almost 2·5-fold reduced abundance in Prevotellaceae (P=0·05) in obese neutered cats compared with lean neutered cats. Peptostreptococcaceae has been found to negatively correlate with life span in mice and decrease with energy restriction( Reference Zhang, Li and Yang 47 ). Another study found that feeding rats a high-fat diet for 4 weeks increased Peptostreptococcaceae and decreased Prevotellacae. To understand how these changes in the microbiota relate to phenotypic changes, correlation analyses revealed a negative correlation between Roseburia and FM in the lean and obese neutered cats. Roseburia was previously shown to negatively correlate with fasting hyperglycaemia, glucose intolerance, hepatic TAG accumulation and hypercholesterolaemia( Reference Neyrinck, Possemiers and Verstraete 48 ). Roseburia is known to produce butyrate( Reference Duncan, Hold and Barcenilla 49 ), which has been shown to have a number of health benefits including reducing BW gain and increasing insulin sensitivity, as well as satiety hormones( Reference Canani, Costanzo and Leone 50 , Reference Tolhurst, Heffron and Lam 51 ). Results from these studies imply that these bacteria may interact with the host to influence metabolism and may therefore warrant further investigation in relation to weight maintenance.
We found 6 weeks of energy restriction in obese cats to have little impact on the faecal microbiota, with only a few changes in bacterial taxa. This may have been due, in part, to the short period of energy restriction in this study. Short-term studies in cats that have observed drastic changes in the microbiota usually are related to shifts to the diet composition, indicating that diet strongly shapes the faecal microbiota( Reference Bermingham, Kittelmann and Henderson 41 , Reference Lubbs, Vester and Fastinger 52 , Reference Barry, Wojcicki and Middelbos 53 ). In our study, the same diet was used during the weight-loss phase for the obese cats, demonstrating that reducing energy intake by 30–40 % for 6 weeks was not enough to induce significant changes in the faecal microbiota. Nevertheless, weight loss was significant, achieving the target weight loss rate of approximately 1 % BW per week and inducing significant changes in body composition. Our goal was not to promote marked weight loss, but to evaluate the effect of a moderate energy restriction on changes in faecal microbiota early in the weight loss process that could be driving physiological responses to weight change. We wanted to determine what changes occurred during initial weight loss rather than waiting to see what happens after significant weight loss had already been achieved. Understanding the changes that occur initially during weight loss may aid in identifying targets that may help promote greater weight loss. Longer-term weight-loss trials examining the faecal microbiota at multiple time points may be a useful approach to determine which bacteria change with weight loss.
In conclusion, the present study reports changes in the faecal microbial population in lean and obese and intact and neutered domestic cats. We observed the greatest alterations in the faecal microbiota when we compared the lean cats with obese cats. We were also able to detect shifts as a result of neutering, but only minor changes elicited by energy restriction in obese cats. Multivariate analyses using PLS-DA discriminated the groups when we specifically examined the effects of neutering, obesity or energy restriction in the context of obesity and identified the genera that contributed to the distinction of those groups. Correlations among faecal bacteria and body composition were observed, which were consistent with previously published findings. Additional work is needed to understand the mechanisms behind how neutering, obesity and weight loss induce changes to the feline microbiota and how these in turn affect host physiology. This information can then potentially be leveraged to develop probiotic supplements that can favourably affect host metabolism and body composition.
Acknowledgements
The authors would like to thank Deborah Bee for her assistance and care of the cats.
The study was supported by a grant to M. M. F. from the Coordenação de Aperfeiçoamento de Pessoal de Nível Superior (CAPES) foundation, Brasília, Brazil (7131/12-7). Additional study support was provided by the Center for Companion Animal Health (2012-44-F), the Sommer Endowment and the Department of Molecular Biosciences, School of Veterinary Medicine, University of California-Davis. Research was supported by National Institutes of Health grant U24-DK092993 (UC Davis Mouse Metabolic Phenotyping Center). Diet was provided by Mars Petcare, USA, Franklin TN. Mars Petcare had no role in the design, analysis or writing of this article. All authors contributed fundamentally to the present paper.
M. M. F. contributed to all facets including research design, data collection, calculations and writing the manuscript. A. M. K. contributed to data interpretation, manuscript preparation and mentored the primary author. D. A. K. and T. A. K. contributed to data, statistical analysis and interpretation; wrote sections of the results and discussion; and created figures, read and edited all versions of paper. K. K. contributed to data and statistical analysis, assisted with writing of statistical analysis and results section and read and edited the paper. A. W. assisted with designing and study planning, worked with animals and collected data. J. J. R. and A. J. F. developed study idea; designed the study plan; mentored the primary author; contributed to data, statistical analysis and interpretation; and read and edited all versions of the paper.
A. J. F. served in an intermittent advisory capacity to Nutro Products, Inc. at the time of the study. The remaining authors declare that there are no conflicts of interest.
Supplementary material
For supplementary material/s referred to in this article, please visit https://doi.org/10.1017/S0007114517002379


