


Among the pleiotropic effects of fatty acids (FA), CVD prevention is the most documented one, with recent results from clinical trials providing new insights into the integrative effects of FA in CVD prevention( Reference Hammad, Pu and Jones 1 – Reference Willett 4 ). In addition, the intakes of several FA as risk factors is subject to continuous evolution, including the important aspect of their replacement by other nutrients( Reference Anand, Hawkes and de Souza 5 – Reference Mozaffarian, Micha and Wallace 9 ). Consequently, it is important to periodically re-assess FA intakes in different populations( Reference Eilander, Harika and Zock 10 – Reference Honors, Harnack and Zhou 13 ).
As most international and national organisations, The French Agency for Food, Environmental and Occupational Health & Safety (ANSES) regularly issues statements regarding dietary recommendations for major nutrients such as fats. The last updated recommendation establishing French population recommended dietary intakes (RDI) for FA in 2010 looks for optimal intakes and optimum health conditions in the general population, in a primary prevention of CVD perspective( 14 ).
However, accurate data combining updated food composition and recent evolution in food consumption in large populations are scarce, even in countries such as France. In addition, the evolving factors that may drive FA intakes have not been deeply studied. This prompted us to perform a large analysis combining the set of national data publicly available on food consumption (the French National Survey INCA 2 performed in 2006 and 2007) and the nutritional content of food consumed in France updated by Ciqual (the French Information Center on Food Quality) in 2013.
The main objective of our study was to explore fat intakes in French adults using the most recent and accessible data, in order to identify the contributions of key food categories and discrepancies in the observed intake levels. For this purpose, we built a weighted fat adherence score combining the intakes of different FA and their importance in terms of CVD risk prevention. Individual scores were computed in relation to the recommended French daily intakes, looking for potential explanatory factors.
Methods
Description of data
The statistical analysis involved a combination of INCA 2 data with data on the nutritional composition of basic food products, drawn from ANSES Ciqual 2013 database (https://pro.anses.fr/TableCIQUAL/).
Participants in the INCA 2 study were selected using a three-stage random probability design stratified by region of residence, size of urban area and population category (adults or children). This design was summarised into sampling weights provided for each surveyed individual representing the frequency in the entire French population. Each participant was asked to complete a 7-d food diary as well as other questionnaires on anthropometric and socio-economic factors. Food items declared were subsequently categorised into 1305 ‘as consumed’ food items for which the nutritional content was either available in the Ciqual database or could be deduced through their recipe. Following the methodology recommended by ANSES (cf. https://www.data.gouv.fr/fr/datasets/donnees-de-consommations-et-habitudes-alimentaires-de-letude-inca-2-3/), results are presented for a weighed representative sample of the French population (2624 adults).
INCA 2 data also included some information about dietary supplements that participants may have taken, but this was a very infrequent practice in the studied sample (and in general in France), particularly for FA intakes, and therefore this was ignored with the exception of margarines supplemented with n-3 FA.
The following nutrients were considered:
-
∙ Total energy intake excluding alcohol (EIEA), total energy intake, alcohol intake, total fat and cholesterol.
-
∙ Total SFA, with details of butyric acid (4 : 0), caproic acid (6 : 0), caprylic acid (8 : 0), capric acid (10 : 0), lauric acid (12 : 0), myristic acid (14 : 0), palmitic acid (16 : 0) and stearic acid (18 : 0); lauric, myristic and palmitic acids were summed up as specific SFA following ANSES nomenclature.
-
∙ Total MUFA, including oleic acid (18 : 1n-9 cis), the main MUFA in the n-9 family.
-
∙ Total PUFA including α-linolenic acid (18 : 3n-3 c9, c12, c15) (ALA), DHA (22 : 6n-3 c4, c7, c10, c13, c16, c19) and EPA (20 : 5n-3 c5, c8, c11, c14, c17c) from the n-3 family and linoleic acid (18 : 2n-6 c9, c12) (LA) and arachidonic acid (20 : 4n-6 c5, c8, c11, c14) (AA) from the n-6 family.
Trans-FA could not be analysed, as they were not included in the Ciqual 2013 database, not considered by the ANSES as a national health issue.
Quality of data
As the process of matching up the product names used in the two databases has not been completed, techniques for dealing with the missing values were applied for 149 of the 1342 food products having no direct correspondence. For 137 of them, we allocated values of food being very close in terms of compositions (e.g. ‘olive oil added to cooking’ has been assigned values of ‘virgin olive oil’, unique olive oil reference in the INCA 2 nomenclature). For the remaining eleven foods (the last being the ‘uncodified food’ that is excluded from our analysis), we used values of Ciqual 2008 when food nomenclature was available, and for those not available we calculated the average value of the food subgroup using Ciqual 2008 data.
Recommended fatty acid intake
The mean French population intakes were compared with the recommended intake levels and ranges for total fat and FA for adults as established by ANSES: total fat 35–40 %EIEA, total SFA <12 %EIEA, specific SFA (lauric, myristic and palmitic acids) <8 %EIEA, ALA 1 %EIEA, linolenic acid 4 %EIEA, oleic acid 15–20 %EIEA, DHA 250 mg/d, and EPA 250 mg/d( 14 ).
Fat adherence score
To investigate the extent to which FA intakes deviated from recommendations and consequently from potential cardiovascular benefits, a weighted fat adherence score was created combining the intakes of the different FA and their relative weight in a perspective of CVD prevention. The individual scores were computed in relation to the recommended daily intakes, with a ranking of 0 to 4, where 4 represents the highest adherence to guidelines and 0 represents the lowest:
-
∙ for SFA: <8 %EIEA (coded 4), 8–10 %EIEA (3), 10–12 %EIEA (2), 12–14 %EIEA (1) and >14 %EIEA (0);
-
∙ oleic acid: <7·5 %EIEA (0), 7·5–10 %EIEA (1), 10–12·5 %EIEA (2), 12·5–15 %EIEA (3) and >15 %EIEA (4);
-
∙ total n-6: <2 %EIEA (0), 2–4 %EIEA (1), 4–6 %EIEA (3) and >6 %EIEA (4);
-
∙ n-3 as the maximum between DHA and ALA:
-
o DHA: <100 mg/d (0), 100–200 mg/d (1), 200–250 mg/d (2) and >250 mg/d (4);
-
o ALA: 0–1 g/d (0), 1–2 g/d (2) and >2 g/d (4);
-
-
∙ total cholesterol: <200 mg/d (0), 200–300 mg/d (1) and >300 mg/d (2).
The final score is the combination of the six separated scores, based on the relative weight we estimated for each nutrient on CVD prevention: SFA count for 1/3, PUFA count for 1/3 (n-3 1/6 plus n-6 1/6), and MUFA and cholesterol count for 1/6 each.
Potential explanatory factors
The following factors were considered as modulators of consumption patterns, and were included as potential explanatory factors for score variations:
-
∙ Socio-demographic data (age, sex, region, social category of the household chief, diploma);
-
∙ Alcohol consumption, fish consumption and consumption of different types of margarines including those supplemented with n-3 FA;
-
∙ Smoking status, BMI or nutritional status, elderly (>75 years), physical activity, reading labels on food products, being informed about nutrition, being on a diet (for medical reason or other reasons) and being on hormonal substitution treatment.
Some of these factors are quite rare in the data but are still of interest regarding our goal of linking FA intakes and specific diseases: diet for diabetes 44/2624, diet for high cholesterol 74/2624 and diet for CVD 32/2624.
Quantitative data analysis
Daily intakes were computed for each adult and each of the forty-four food groups of the INCA 2 database on the total period of time on which the individuals filled in their consumption (7 d for most of them). The results are expressed in terms of daily intake in g/d or mg/d when necessary (for EPA, DHA and cholesterol) or as a percentage of EIEA.
All statistical analyses were performed using R – namely, the Survey package integrating weights in all classical analysis (mean, regression, ANOVA)( Reference Lumley 15 ) and the FactoMineR package for multivariate analysis( Reference Lê, Josse and Husson 16 ). For each intake, basic statistics were computed such as means, standard deviations, percentiles and percentages of data over or below recommended daily intakes.
To evaluate the significance of the differences in intakes by region or education level, the effects of age and sex were taken into account through type II tests, so that age and sex are not confusion factors in the results for region and education levels.
A scaled principal component analysis (PCA) was performed on the detailed FA intakes (eight SFA, one MUFA, five PUFA), using the weights, so that the analysis is representative of the French population. The goal of this multivariate analysis was to identify some structures in the data. The fat adherence score (denoted as d.score in Fig. 2) was added as a supplementary variable, to see how it relates to detailed FA intakes.
A simple ANOVA was run on the fat adherence score against all potential explanatory factors listed in the previous section (still weighting the data as recommended by ANSES). The tests conducted were type II, meaning that in each case when testing the significance of a factor all others factors were included into the model, so that other effects were controlled when considering a given factor.
Results
The major values of French adults’ total fat and FA daily intakes and the French Food Safety Agency RDI levels are shown in Table 1 along with comments below with respect to ANSES recommendations. Summary statistics for detailed FA intakes and detailed FA intakes by age, region and education level are available in the online Supplementary Material.
Table 1 Mean daily intake of the French adult population (INCA 2–Ciqual) (Mean values and standard deviations; 2·5th and 97·5th percentiles; percentages and 95 % confidence intervals)
EIEA, energy intake excluding alcohol; ANSES, French Agency for Food, Environmental and Occupational Health & Safety; RDI, recommended dietary intakes; ALA, α-linolenic acid; LA, linoleic acid.
* Lauric acid, myristic acid and palmitic acid.
† Considered as ≥1 % for the calculation of percentage meeting the RDI.
‡ Considered as ≥250 mg for the calculation of percentage meeting the RDI.
§ Considered as ≤4 % for the calculation of percentage meeting the RDI.
Total fat
The mean fat intake of French adults was 38·0 % of the total EIEA (%EIEA). This figure met the guideline for the RDI defined by the ANSES in 2010 for FA, that is 35–40 %EIEA. A total of 36·1 % French adults met the recommendation, with 29·3 % of the French adult population below 35 %EIEA and 34·5 % over 40 %EIEA.
SFA
The mean SFA total intake was 14·4 %EIEA, 20 % above the ANSES RDI (12 %EIEA). A broad 5-fold variation was reported across the French adult population between P2·5 and P97·5. Specifically, the three SFA (lauric acid, myristic acid and palmitic acid) accounted for more than 9·5 %EIEA, whereas ANSES recommends that it should not exceed 8 %EIEA. Only 21·5 % of the population did satisfy this 8 %EIEA recommendation. The mean palmitic acid intake itself reached 7·3 %EIEA.
MUFA
The mean daily intake of oleic acid, the main MUFA in the n-9 family, was 23·7 g/d or 10·8 %EIEA, a low level compared with the RDI (15–20 %EIEA). Large variations were observed as follows: intakes ranged from 8·7 to 43·3 g/d (from P2·5 to P97·5). Only 6·8 % of the adults did meet the guideline of 15–20 %EIEA, with 92·3 % being below 15 %EIEA.
PUFA
The average daily intake of polyunsaturated n-3 FA was 0·4 %EIEA for ALA (RDI: 1 %), 137 mg for DHA (RDI: 250 mg) and 102 mg for EPA (RDI: 250 mg), with tremendous variations, particularly for long-chain n-3 PUFA. Only 14·6 % of the adult population appeared to meet the RDI of 250 mg/d for DHA, 7·8 % for EPA and 7·0 % for both DHA and EPA.
The mean intake of the main polyunsaturated n-6 FA, LA, was 8·4 g/d and 3·9 %EIEA. This value met the ANSES RDI (4 %EIEA) in 65·1 % of the population. The low ALA intake translated into a mean LA:ALA ratio of 9·6, whereas the ANSES recommendation is <5; 95 % of the adult population had a ratio exceeding 5.
Cholesterol
For French adults, the mean dietary cholesterol intake was 304 mg/d. Intakes varied from 112 (Q2·5) to 563 mg/d (Q97·5). About 50 % of adult population had mean cholesterol intakes below 300 mg/d. The correlation between cholesterol intake and SFA intake was strong (r 0·72), and was milder with MUFA (r 0·61) and PUFA (r 0·44).
Food categories contributions
Different food categories with major contribution to FA intakes are reported in Table 2.
Table 2 Main food groups contributing to fatty acid intake in French adults
The major contributors to total FA intakes were cheese and butter (19 %) with a similar weight (9·6 and 9·4 %, respectively) as well as oil with a contribution of 12 % to total FA.
Regarding SFA, the main contributions were animal fats (43·5 %), particularly butter (14·7 %) and cheese (14·8 %).
For MUFA, the main source was oil (17·3 %) followed by animal fats (29·7 %): butter (6·2 %), cheese (7·2 %), meat products (9·3 %) and meat (7 %).
For n-3 PUFA, the main contributor of DHA and EPA was fish (54·6 and 48·1 %, respectively), and ALA intake was from pastries and cakes (11·2 %), oil (9·7 %), and condiments and sauces (9·5 %).
For n-6 PUFA, oil was again the main contributor, especially for LA (20·5 %).
Differences in intakes by sex, age, education level and region
Overall, in the French adult population, we observed influences of sex, age, level of education and region on FA intake. Detailed results are available in the online Supplementary Material; only the main findings are described below.
Regarding age, intake of PUFA increased with age significantly only in men. n-3 FA intakes increased with age for both men and women. Among SFA, only capric acid intake increased significantly with age and only in men.
Intakes of oleic acid and n-3 PUFA (EPA, DHA and ALA) increased with French level of education.
With regard to regional consumption, lauric acid presented a significantly higher intake in the north-west part of France than in the south, whereas intakes of oleic acid and more generally of MUFA were higher in the south. The most significant regional differences were essentially observed for PUFA. Intake of n-3 PUFA (EPA and DHA) was higher in Paris area and in the west and south-west regions, whereas n-6 PUFA intakes were higher in the south.
Analysis of the fat adherence score
Fig. 1 shows the distribution of the fat adherence score: it was mildly skewed to the right with a mean of 1·43 (sd 0·57) and median of 1·33, ranging from 0·5 (P2·5) to 2·67 (P97·5).
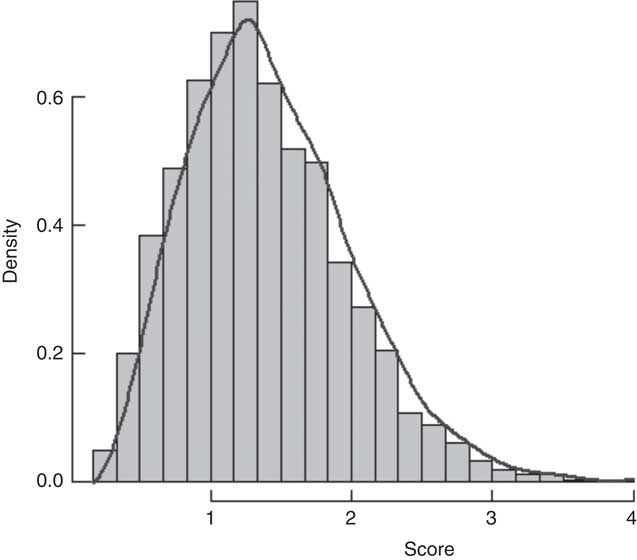
Fig. 1 Distribution of the fat adherence score. The score is between 0 (poor quality lipid diet) and 4 (optimal lipid diet) by construction.
The PCA performed on all individual FA (Fig. 2) resulted in three principal components (totalising 54·8+14·8+10·3=79·9 % of the data inertia). The first component was mainly driven by SFA (specific SFA), the second component by MUFA and the third one mostly by EPA and DHA (fish consumption). On the basis of position of the fat adherence score on the correlation circle (added as a supplementary variable), it is clear that individuals with high scores had higher EPA and DHA intakes (positive correlation) and lower SFA intakes (negative correlation).
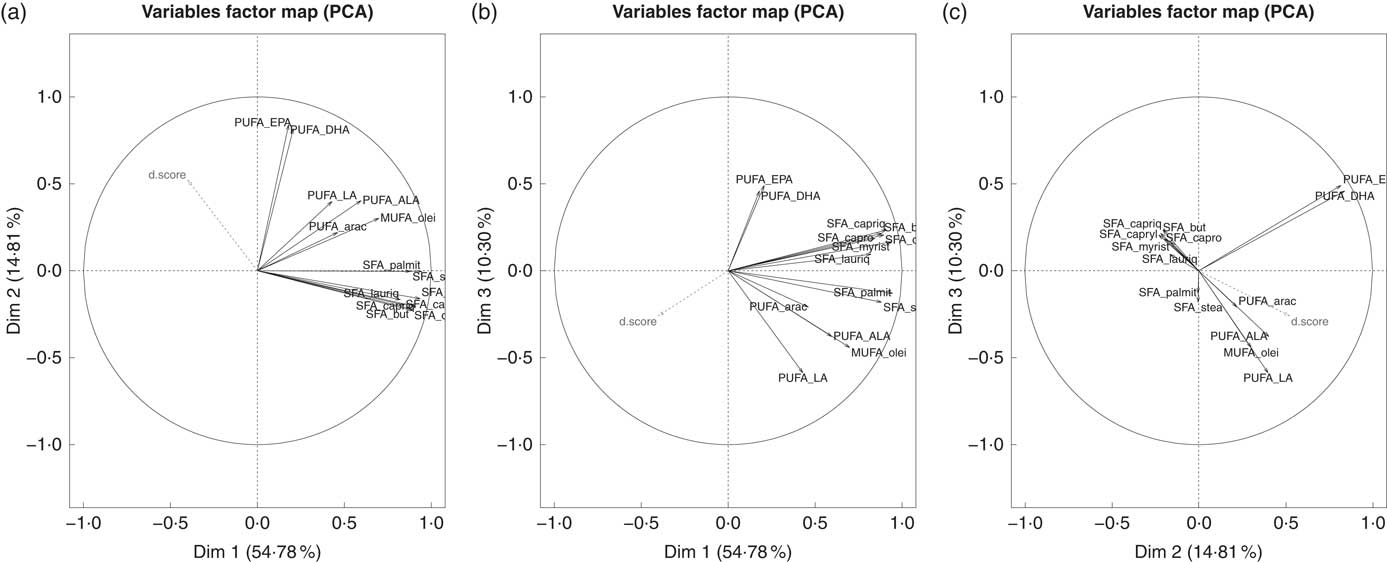
Fig. 2 Correlation circles from principal component analysis (PCA) analysis on weighted data (d.score is the fat adherence score). ALA, α-linolenic acid; LA, linoleic acid; arac, arachidonic acid; stea, stearic acid; lauriq, lauric acid; olei, oleic acid; palmit, palmitic acid; myrist, myristic acid; capriq, capric acid; capryl, caprylic acid; capro, caproic acid; but, butyric acid.
Table 3 gives the factors in decreasing order of importance, based on a simple ANOVA that was run on the score against all available factors.
Table 3 Multivariable analysis of the factors with influence on the score of healthy lipid diet according to French Agency for Food, Environmental and Occupational Health & Safety French recommended dietary intakes 2010Footnote ‡
* P<0·05, ** P<0·01, *** P<0·001.
† P<0·1.
‡ The adjusted R 2 is 0·156.
Regarding the direction of effects, we observed that the higher the fish consumption is, the higher the score is; the south of France had higher scores, as consuming margarines supplemented with n-3 FA (essentially ALA) increased the score as well as being a woman. Higher alcohol intakes were associated with lower scores (high consumption: 1·37 (sd 0·03); moderate consumption: 1·46 (sd 0·02); no consumption: 1·48 (sd 0·03); P=9·64e−4). Being on a hypocholesterolaemic diet led to higher scores (1·88 (sd 0·09) v. 1·42 (sd 0·01); P=1·36e−3); conversely, scores of people following a diet for diabetes (1·59 (sd 0·08) v. 1·44 (sd 0·01); NS) or CVD (1·69 (sd 0·15) v. 1·43 (sd 0·01); NS) were similar to controls.
Discussion
Data from this large INCA 2 survey in the French population show a significantly elevated intake of SFA and a low intake of MUFA and n-3 PUFA v. current French recommendations( Reference Dubuisson, Lioret and Touvier 17 ). This high SFA intake remains mostly because of consumption of butter and cheese. n-3 PUFA intake is related to low levels of fish consumption. Furthermore, we found by using a weighted score of healthy lipid intake (fat adherence score) that an optimal FA intake is positively associated with consumption of fish and sources of n-3 FA, living in the south of France, being female, and having a higher education level, whereas alcohol consumption was associated with poor FA intake.
An important finding of this survey is the persistently high level of SFA intake in the French population (14·4 %), which is in the higher ranges of SFA intake compared with other population surveys( Reference Eilander, Harika and Zock 10 , Reference Harika, Eilander and Alssema 12 ). In agreement, Eilander et al.( Reference Eilander, Harika and Zock 10 ) in a previous combined analysis of different European studies reported a range of SFA intake from 8·9 % in Portugal to 15·5 % in France of total energy intake. Comparable high SFA intake levels are reported in the USA( Reference Micha, Khatibzadeh and Shi 18 , Reference Slining and Popkin 19 ). Our detailed analysis on food consumption indicates that this elevated French SFA intake is mainly due to a high consumption of cheese and butter, including the three SFA pointed out by ANSES (lauric, myristic and palmitic). These results suggest that national educational cardiovascular prevention programmes relative to food consumption should focus more on these food items in order to reduce SFA intake in the French population. This is a challenge in a country where cheese is a cultural food having a particular place in the diet and a major source for micronutrients such as Ca and vitamin D( Reference Coudray 20 ).
Although the observed n-6 LA mean intake level almost met the ANSES recommendation, the low n-3 PUFA intake level is another important piece of information in our survey, with a value far below the French Agency recommended intake. As indicated by data on foods consumption, this low n-3 PUFA level is mainly because of a low level of fish consumption. Interests of n-3 PUFA in cardiovascular prevention have been widely studied( Reference Michas, Micha and Zampelas 7 , Reference Chowdhury, Warnakula and Kunutsor 21 – Reference de Souza, Mente and Maroleanu 23 ). Long-chain EPA and DHA have positive effects on many cardiovascular markers, and consumption of fish and seafood n-3 PUFA is associated with lower CHD death( Reference Zheng, Huang and Yu 24 ). Recommendation of two servings of fish per week remains a strong one both in primary and in secondary prevention( Reference Gil and Gil 25 ). Our present data showing both low levels of fish consumption in the French population and its pivotal role on EPA and DHA intakes must reinforce our advice for fish consumption in the general population. French SFA intake level is also high and replacing SFA with PUFA, including those from non-hydrogenated vegetable oil sources (ALA as well as LA), may be an efficient option in terms of cardioprotection objectives( Reference Mozaffarian, Micha and Wallace 9 , Reference Mensink, Zock and Kester 26 ). As a consequence, practical recommendations to the general population should not only be on limiting intakes of animal SFA but also on promoting consumption of PUFA fat from plant sources and/or complex carbohydrates.
We also show that MUFA intake is significantly under the recommended level. Although data on the benefit of MUFA intake on CVD prevention have been challenged( Reference Schwingshackl and Hoffmann 27 , Reference Schwingshackl and Hoffmann 28 ), many studies have reported a beneficial effect of a Mediterranean diet rich in MUFA on CVD( Reference Gillingham, Harris-Janz and Jones 29 , Reference Guasch-Ferré, Babio and Martínez-González 30 ). According to our data, the relatively low consumption of oleic acid is the leading factor responsible for the low MUFA intake in the French population. Living in the south of France is associated with a better FA intake, this is likely due to a higher consumption of oleic acid with frequent use of olive oil, specifically in this part of France.
In this study, the ANSES recommendations were used as reference, being the one communicated to the French population in a perspective of public health. Several international organisations produce fat intake recommendations, based on various types of criteria and evidence, leading to different values of RDI. As an example, the WHO recommends 20–35 % of total energetic intake (EI) for total fat and the Dietary Guidelines for Americans (DGA) recommend 25–35 %EI compared with 35–40 %EIEA for ANSES( 31 , Reference Millen, Abrams and Adams-Campbell 32 ). These apparently more stringent recommendations are actually satisfied for 99·9 % (WHO) and 98·1 % (DGA) of our sample, because of the expression as %EI of these recommendations compared with %EIEA for ANSES.
Using a fat adherence score, we have been able to show that some factors such as consumption of fish and margarines supplemented with PUFA, living in the south of France, female sex and a higher education level are associated with a better FA intake, whereas alcohol consumption is associated with a poor FA intake. The fact that consumption of fish and margarines supplemented with PUFA is associated with optimal fatty intake is consequently in line with the national recommendations. Female sex was also associated with a better FA intake. We assume that females are more interested and concerned about food information. Accordingly, a higher education level is also another factor associated with a better FA intake. This point has also been reported in previous studies( Reference Woo, Leung and Ho 33 ). One possible explanation is that educated people are more concerned about diet, good health and CVD prevention. The fact that alcohol consumption was associated with a bad FA intake is an interesting piece of information in a country where the French paradox has been putatively conferred to alcohol consumption.
The ageing of INCA 2 data (10 years) is a limitation of the interpretation of our results. To estimate whether they are still representative of the current consumption of French adults, we considered the CRÉDOC (Research Center for the Study and Observation of Living), studies that regularly collect consumer data in France, their most recent campaign dating from 2013. These data do not suggest a change in consumer trends over the last decade (unpublished results).
In conclusion, INCA 2 data indicate that French adults have SFA intakes persistently higher than ANSES national recommendations, combined with very inadequate intakes of PUFA, n-3 and MUFA. This situation is quite similar to what is observed in other developed countries such as the USA, where most Americans exceed the recommendations for SFA and about three-fourth of the population has an eating pattern that is low in vegetable oils. This situation appears unfavourable in terms of cardiovascular prevention and should encourage the French authorities and health professionals to communicate more broadly and more efficiently to the general public in order to reverse this imbalance in dietary FA.
Acknowledgements
We thank French ANSES and Ciqual for providing public and open source data that were used in this study.
Note: At the end of 2015, ANSES issued a report on the fatty acid intake of the French population living in France, based on the INCA 2 consumption study data and an internal unpublished updated version of the Ciqual composition table( 34 ). Reported intake levels are strictly comparable with those presented in this study, with the exception of a slightly superior AA intake (0·07 %EIEA in ANSES report v. 0·05 %EIEA in our results), due to modified composition data in eggs and derived products.
The statistical analyses presented in this manuscript were funded by Terres Univia, the interbranch organisation representing the interests of French vegetable oils and proteins.
J. T. processed the statistical analyses and co-wrote the manuscript; P. M., B. V. and S. P. co-wrote the manuscript; C. L. G. and N. S. reviewed the manuscript and provided critical feedback.
S. P. is a consulting with Terres Univia; C. L. G. and N. S. work with Terres Univia; P. M. has no conflict of interest to report with the food industry.
Supplementary Material
For supplementary material/s referred to in this article, please visit https://doi.org/10.1017/S000711451600413X


 Open access