


The metabolic syndrome (MetS) is a cluster of conditions including abdominal obesity, dyslipidaemia, elevated blood pressure and insulin resistance, which together increase the risk of CVD and type 2 diabetes(Reference Lutsey, Steffen and Stevens1). With its rapidly increasing prevalence in recent decades, the MetS has been regarded as an important public health issue affecting approximately 30–40 % of the population in developed countries in parallel with obesity and diabetes(Reference McCracken, Monaghan and Sreenivasan2).
Diet plays a critical role in the development of the MetS(Reference Chung, Lee and Lee3). Fruits and vegetables are important components of the diet, and low intake of fruits and vegetables is a risk factor for many chronic diseases, such as cancer and CVD, because fruits and vegetables contain abundant minerals, vitamins and phytochemicals(Reference Aune, Giovannucci and Boffetta4).
Epidemiological studies have evaluated the relationship between fruit and vegetable intake and risk of the MetS. However, the results remain controversial. Some studies(Reference Kim, Kwak and Kim5,Reference Kouki, Schwab and Hassinen6) have reported that fruit consumption is significantly associated with a decreased risk of the MetS, while others(Reference Babio, Bullo and Basora7–Reference Esmaillzadeh, Kimiagar and Mehrabi9) have shown no association between fruit intake and risk of the MetS. Several studies(Reference Esmaillzadeh, Kimiagar and Mehrabi9) revealed an inverse association between vegetable intake and risk of the MetS, while others(Reference Babio, Bullo and Basora7,Reference Jung, Han and Song10) showed no relationship.
Two meta-analyses have shown a significant relationship between fruit or/and vegetable consumption and the MetS(Reference Tian, Su and Wang11,Reference Zhang and Zhang12) . However, these studies only identified the relationship between fruit or/and vegetable consumption and risk of the MetS in the highest v. lowest categories of food consumption. The data provided by the dose–response meta-analysis would be useful for determining the right level of fruit or vegetable consumption for the prevention of the MetS, through the evaluation of the linear and non-linear relationships. To the best of our knowledge, no studies have investigated the dose–response relationship between fruit or vegetable consumption and risk of the MetS.
Therefore, we performed a systematic review and meta-analysis combining available data from observational studies to examine the dose–response relationship between fruit or vegetable consumption and chance of the MetS.
Methods
Registry and protocol
The protocol for this systematic review with meta-analysis was not registered in a trial registry. The present study followed the Meta-Analysis of Observational Studies in Epidemiology (MOOSE) guidelines.
Literature search strategy
Two investigators (M. L. and M. L.) searched the literature independently. A systematic literature search was conducted using the PubMed, MEDLINE and Embase databases for articles published from June 1958 to October 2018. The following search terms were used: (‘fruit’ or ‘vegetable’) and (‘metabolic syndrome’ or ‘metabolic syndrome X’ or ‘insulin resistance’). The PubMed search used the medical subject heading terms ‘metabolic syndrome’, ‘metabolic syndrome X’ and ‘insulin resistance’. In addition, references from the articles retrieved and previous review articles or meta-analyses were reviewed to identify additional relevant studies. The references were stored in EndNote X7 (Clarivate Analytics).
Study selection
Studies have to be observational (cross-sectional, case–control, cohort study), have fruit or vegetable consumption as the exposure variables, have the MetS as the outcome, report OR or relative risk (RR) and their CI in humans and to be published in English language journals. If duplicate publications from the same study were identified, the result with the largest number of cases from the study was included. At first, titles and abstracts were reviewed, and then full texts were reviewed.
Two investigators (M. L. and M. L.) reviewed all identified studies independently, and discrepancies were discussed and resolved by a third investigator (J. K.).
Data extraction and quality assessment
Two investigators (M. L. and M. L.) conducted study selection and data extraction and held further discussion to resolve any disagreement after reviewing the original article. The following data were extracted from each study: first author’s name, publication year, study location, study design, follow-up period, number of subjects and cases, age and sex of subjects, dietary assessment method, MetS criteria, OR/RR with 95 % CI for the MetS across dietary intake levels and adjusted variables. The most-adjusted model among the multivariable adjustment models was used.
Two investigators (M. L. and M. L.) independently evaluated the quality of cohort and cross-sectional studies using the modified Newcastle–Ottawa quality assessment scale(Reference Modesti, Reboldi and Cappuccio13) for the following criteria: representativeness of the sample, justification of sample size, non-respondents, ascertainment of the risk factor, comparability of subjects and clear description of the statistical test. The evaluation scores ranged from 0 to 10. Total scores ≥ 7 (out of 10) indicated high quality. Any discrepancies in quality assessment between the two reviewers were resolved by discussion until a consensus was reached. To avoid selection bias, no study was rejected because of these quality criteria.
Statistical analysis
The effect size from each study was estimated from OR, and the RR for one study was deemed equivalent to OR. For the linear or non-linear dose–response analysis, the natural logarithm of the OR from each study was pooled using random-effect models, which incorporate both within-study and between-study variations(Reference DerSimonian and Laird14). If a study reported the estimates separately according to individual fruits or vegetables(Reference Cheraghi, Mirmiran and Mansournia15–Reference Shin, Lim and Sung17) or sex(Reference Kouki, Schwab and Hassinen6), the effect estimates in the same study were combined using a random-effect model in the main analysis.
The dose–response association between dietary factor (fruit or vegetables) and outcome (MetS) was examined using generalised least-square trend estimation analysis to estimate the study-specific slope lines first and then derive an overall slope, which requires the number of cases and subjects(Reference Greenland and Longnecker18,Reference Orsini, Bellocco and Greenland19) . When these numbers were not available, variance-weighted least-squares meta-regression analysis was used to estimate the dose–response slopes(Reference Greenland and Longnecker18,Reference Orsini, Bellocco and Greenland19) . For these two analyses, the median or mean value for each category of intake level was used. For studies not providing the median or mean intake of each category, the mid-point of the upper and lower boundaries in each category was used as the average intake. Fruit or vegetable consumption reported as servings or times per d or week was converted to g/d.
To visualise and summarise the associations between fruit or vegetable consumption and the MetS, the OR from each study as well as a pooled OR are presented as forest plots, where the size of the data markers (squares) corresponds to the inverse of the variance of the natural logarithm of OR from each study and the diamond indicates a pooled OR.
A two-stage random-effects dose–risk meta-analysis was performed to examine a non-linear dose–response relationship between fruit or vegetable consumption and the MetS. After modelling fruit consumption using restricted cubic splines with three knots at fixed percentiles (10, 50, 90 %) of the distribution(Reference Harrell, Lee and Pollock20–Reference Smith22), a generalised least-squares method and multivariate maximum-likelihood method were used to estimate a summary non-linear dose–response relationship while taking random effects into account(Reference Orsini, Bellocco and Greenland19). A P value for non-linearity was calculated by testing the null hypothesis that the coefficient of the second spline was equal to 0.
A subgroup analysis and a meta-regression analysis were conducted to explore potential sources of heterogeneity and compare them among groups. The analyses were performed according to study design (cohort/cross-sectional), study location (Asia/Europe), MetS criteria (National Cholesterol Education Program Adult Treatment Panel III and others), study quality (good and others) and adjustment factors (alcohol, smoking, physical activity, education, family history of diabetes, energy intake and meat intake). A sensitivity analysis was conducted in which one study at a time was removed and the remaining studies were assessed to evaluate the impact of the removed study. To explore the presence of heterogeneity and inconsistency, the Q test and I² statistic (100 % × (Q – df)/Q) were calculated(Reference Higgins and Thompson23,Reference Higgins, Thompson and Deeks24) . The assumption of heterogeneity was considered valid for P values <0·10 based on the Q statistic. To estimate the between-study variance, the τ 2 statistic was calculated.
Potential small study effects were evaluated by visual inspection of the funnel plot with a pseudo 95 % CI that was tested by Egger’s regression asymmetry test(Reference Egger, Davey Smith and Schneider25). The results were considered to indicate a small study effect when the P value was <0·10(Reference Sterne, Sutton and Ioannidis26). In addition, the Doi plot and the Luis Furuya-Kanamori (LFK) index were implemented for the detection of asymmetry of a small study effect(Reference Furuya-Kanamori, Barendregt and Doi27). Statistical analysis was performed using Stata/SE 14.2 (STATA). The LFK index has been implemented into MetaXL version 5.3 (EpiGear International). A two-tailed P value <0·05 was considered statistically significant.
Results
Literature search for dose–response meta-analysis
Originally, 2421 papers were searched and 1024 duplications were excluded. Three articles were added from bibliography review. In total, 1092 articles were excluded based on title and abstract (online Supplementary Table S1). Full-text of 308 articles was reviewed and the following 299 articles were excluded (online Supplementary Table S2): 119 studies not related to dietary factors, seventy-seven studies not related to outcome, twenty-four reviews or letters, thirty-eight studies for which no full text was available, twenty-two studies that did not report OR/RR or 95 % CI, eight studies not published in English, six studies that did not report data for fruit or vegetable consumption, two clinical studies, one duplicate study and two studies that focused on patients with specific diseases. As a result, a total of nine articles(Reference Kim, Kwak and Kim5–Reference Jung, Han and Song10,Reference Cheraghi, Mirmiran and Mansournia15,Reference Shin, Lim and Sung17,Reference Harrell, Lee and Pollock20) were identified as eligible for the present meta-analysis (Fig. 1).
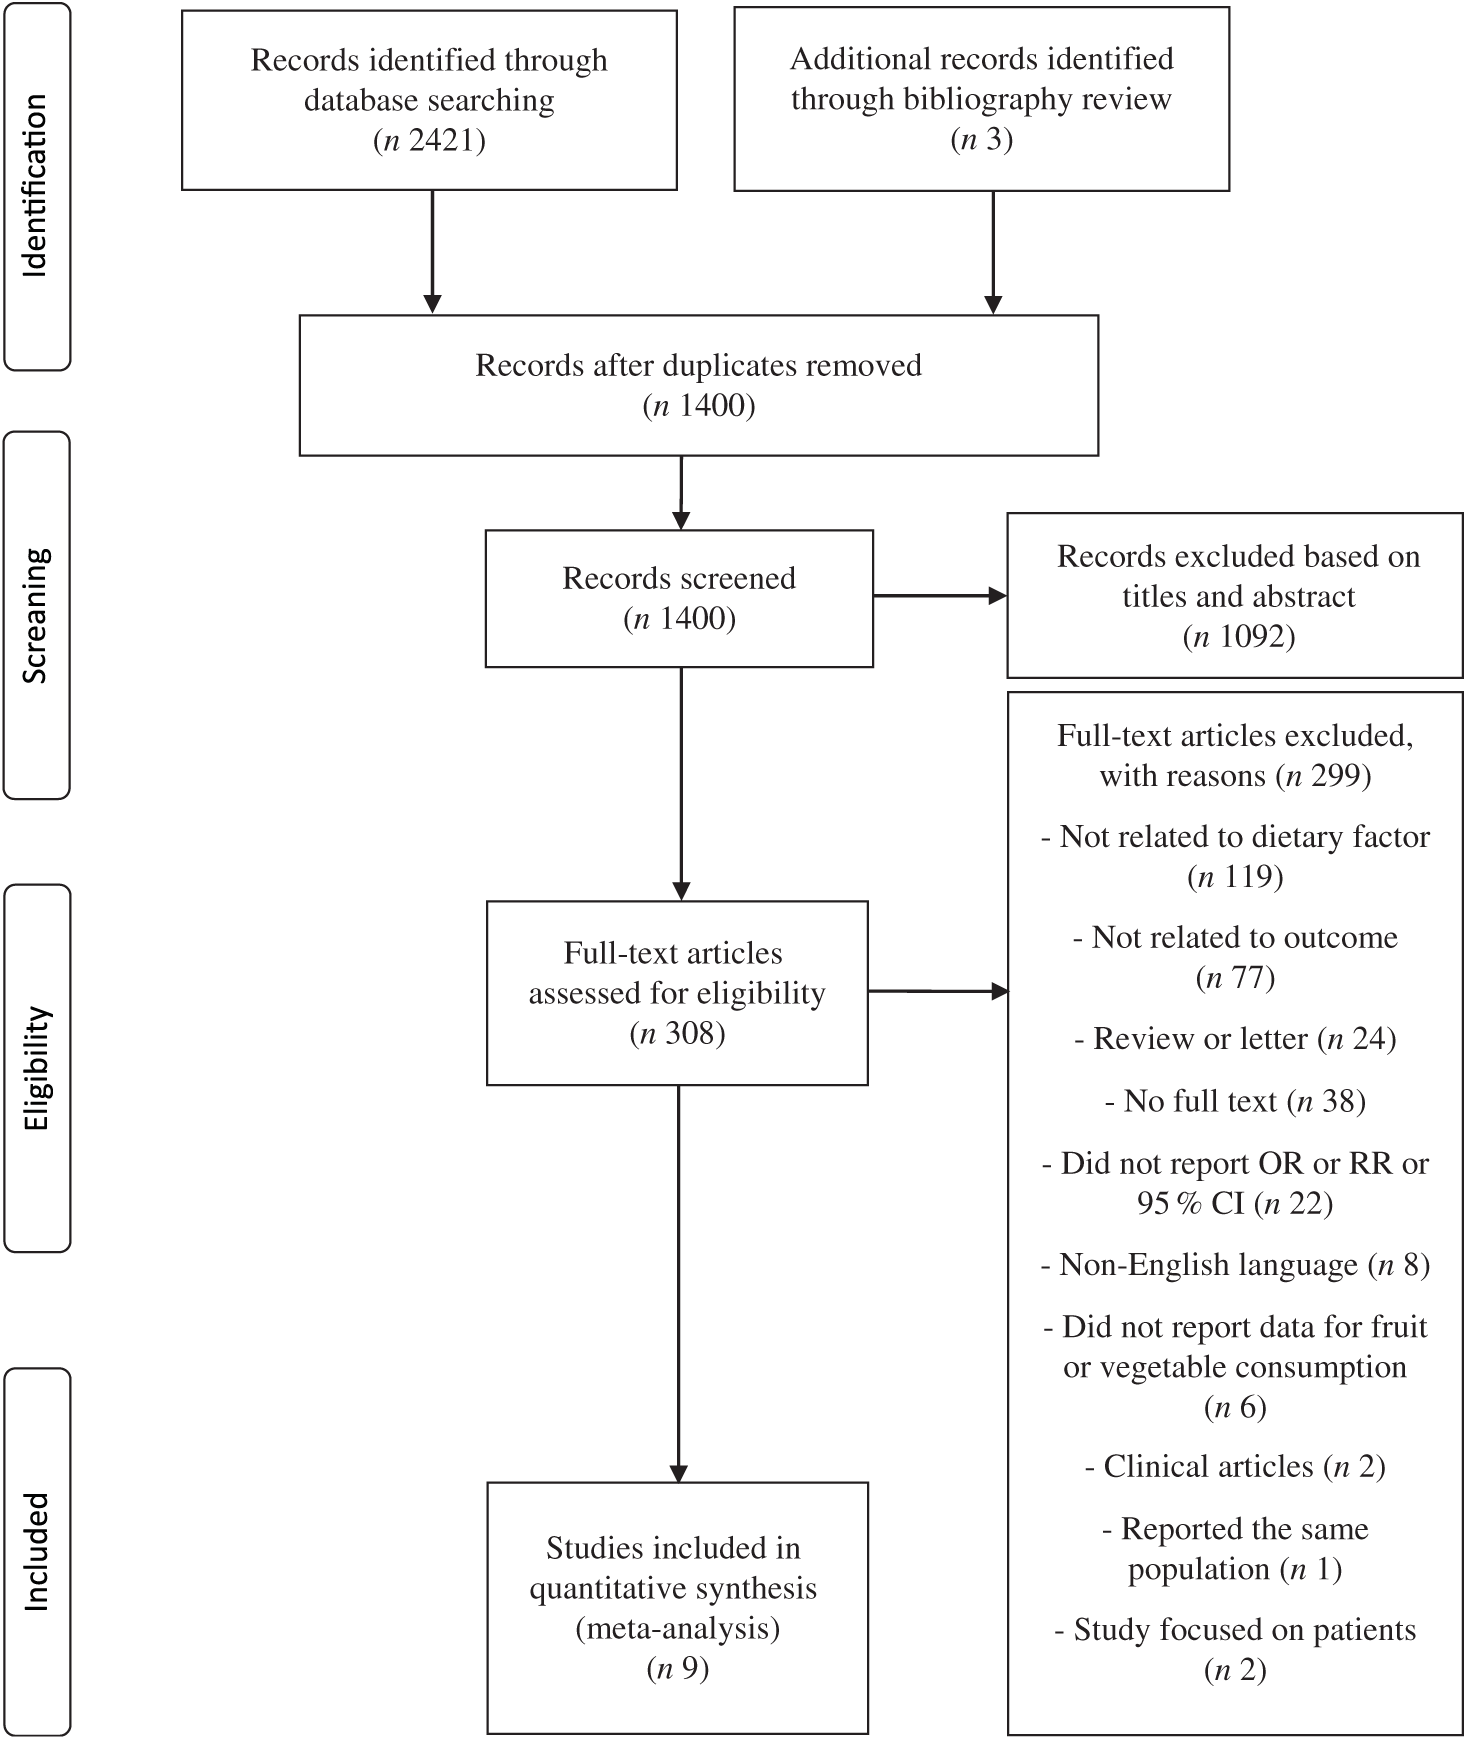
Fig. 1. Flow chart of the selection process according to the Preferred Reporting Items for Systematic Reviews and Meta-Analyses (PRISMA) statement. RR, relative risk.
Study characteristics
Nine studies(Reference Kim, Kwak and Kim5–Reference Jung, Han and Song10) including seven cross-sectional studies(Reference Kim, Kwak and Kim5–Reference Babio, Bullo and Basora7,Reference Montano16,Reference Shin, Lim and Sung17) and two cohort studies(Reference Baik, Lee and Jun8,Reference Cheraghi, Mirmiran and Mansournia15) were used in the dose–response meta-analysis of the association between fruit or vegetable consumption and chance of the MetS (Table 1). Six studies(Reference Kim, Kwak and Kim5,Reference Baik, Lee and Jun8–Reference Jung, Han and Song10,Reference Cheraghi, Mirmiran and Mansournia15,Reference Shin, Lim and Sung17) were conducted in Asia, and three studies(Reference Kouki, Schwab and Hassinen6,Reference Babio, Bullo and Basora7,Reference Montano16) were conducted in Europe. Seven studies(Reference Kim, Kwak and Kim5–Reference Baik, Lee and Jun8,Reference Jung, Han and Song10,Reference Cheraghi, Mirmiran and Mansournia15,Reference Montano16) included both male and female participants, and two studies(Reference Esmaillzadeh, Kimiagar and Mehrabi9,Reference Shin, Lim and Sung17) included only male or female participants. Four studies(Reference Kouki, Schwab and Hassinen6,Reference Babio, Bullo and Basora7,Reference Esmaillzadeh, Kimiagar and Mehrabi9,Reference Shin, Lim and Sung17) defined the MetS according to the guidelines of the National Cholesterol Education Program Adult Treatment Panel III(28), and three studies(Reference Kim, Kwak and Kim5,Reference Jung, Han and Song10,Reference Cheraghi, Mirmiran and Mansournia15) defined the MetS using the modified National Cholesterol Education Program Adult Treatment Panel III criteria. One study(Reference Baik, Lee and Jun8) defined the MetS using criteria of the International Diabetes Federation(29). One study(Reference Montano16) defined the MetS as the presence of two out of four criteria considered in diagnostic investigation (diabetes, obesity, dyslipidaemia and hypertension). Most studies were adjusted for age(Reference Kim, Kwak and Kim5–Reference Jung, Han and Song10,Reference Shin, Lim and Sung17) and smoking(Reference Kouki, Schwab and Hassinen6–Reference Esmaillzadeh, Kimiagar and Mehrabi9,Reference Cheraghi, Mirmiran and Mansournia15–Reference Shin, Lim and Sung17) . Two studies provided the adjusted OR for alcohol(Reference Kouki, Schwab and Hassinen6,Reference Baik, Lee and Jun8) . Four studies provided the adjusted OR for education(Reference Kim, Kwak and Kim5,Reference Kouki, Schwab and Hassinen6,Reference Baik, Lee and Jun8,Reference Cheraghi, Mirmiran and Mansournia15) . Four studies(Reference Babio, Bullo and Basora7,Reference Baik, Lee and Jun8,Reference Montano16,Reference Shin, Lim and Sung17) received a score indicating high quality.
Table 1. Characteristics of studies on the association between fruit and vegetable consumption and the Metabolic syndrome (MetS)

RR, relative risk; NCEP ATP III, National Cholesterol Education Program Adult Treatment Panel III; FTO, fat mass and obesity-associated.
Dose–response meta-analysis on the chance of the metabolic syndrome associated with fruit and vegetable consumption
Nine studies(Reference Kim, Kwak and Kim5–Reference Jung, Han and Song10,Reference Cheraghi, Mirmiran and Mansournia15–Reference Shin, Lim and Sung17) involving 8422 cases and 38 188 participants investigated the association between fruit or vegetable consumption and the MetS. In the dose–response meta-analysis, an increase of 100 g/d of fruit intake was associated with 3 % lower odds of the MetS (OR 0·97; 95 % CI 0·95, 0·99), with no statistically significant heterogeneity (I² = 26·7 %, P = 0·21; τ 2 = 0·0002) (Fig. 2). Compared with people who had no daily consumption of fruit, the estimated OR of the MetS were 0·97 (95 % CI 0·95, 0·99) for 50 g/d, 0·95 (95 % CI 0·91, 0·99) for 100 g/d (one serving), 0·88 (95 % CI 0·78, 0·97) for 200 g/d, 0·81 (95 % CI 0·69, 0·94) for 300 g/d, 0·75 (95 % CI 0·58, 0·92) for 400 g/d, 0·69 (95 % CI 0·50, 0·88) for 500 g/d and 0·66 (95 % CI 0·44, 0·88) for 600 g/d (Fig. 3(a)). However, there was no evidence of a non-linear relationship between fruit intake and the MetS in the cubic spline model (P non-linearity = 0·25); therefore, a weighted linear regression model was fitted (Fig. 3(b)).
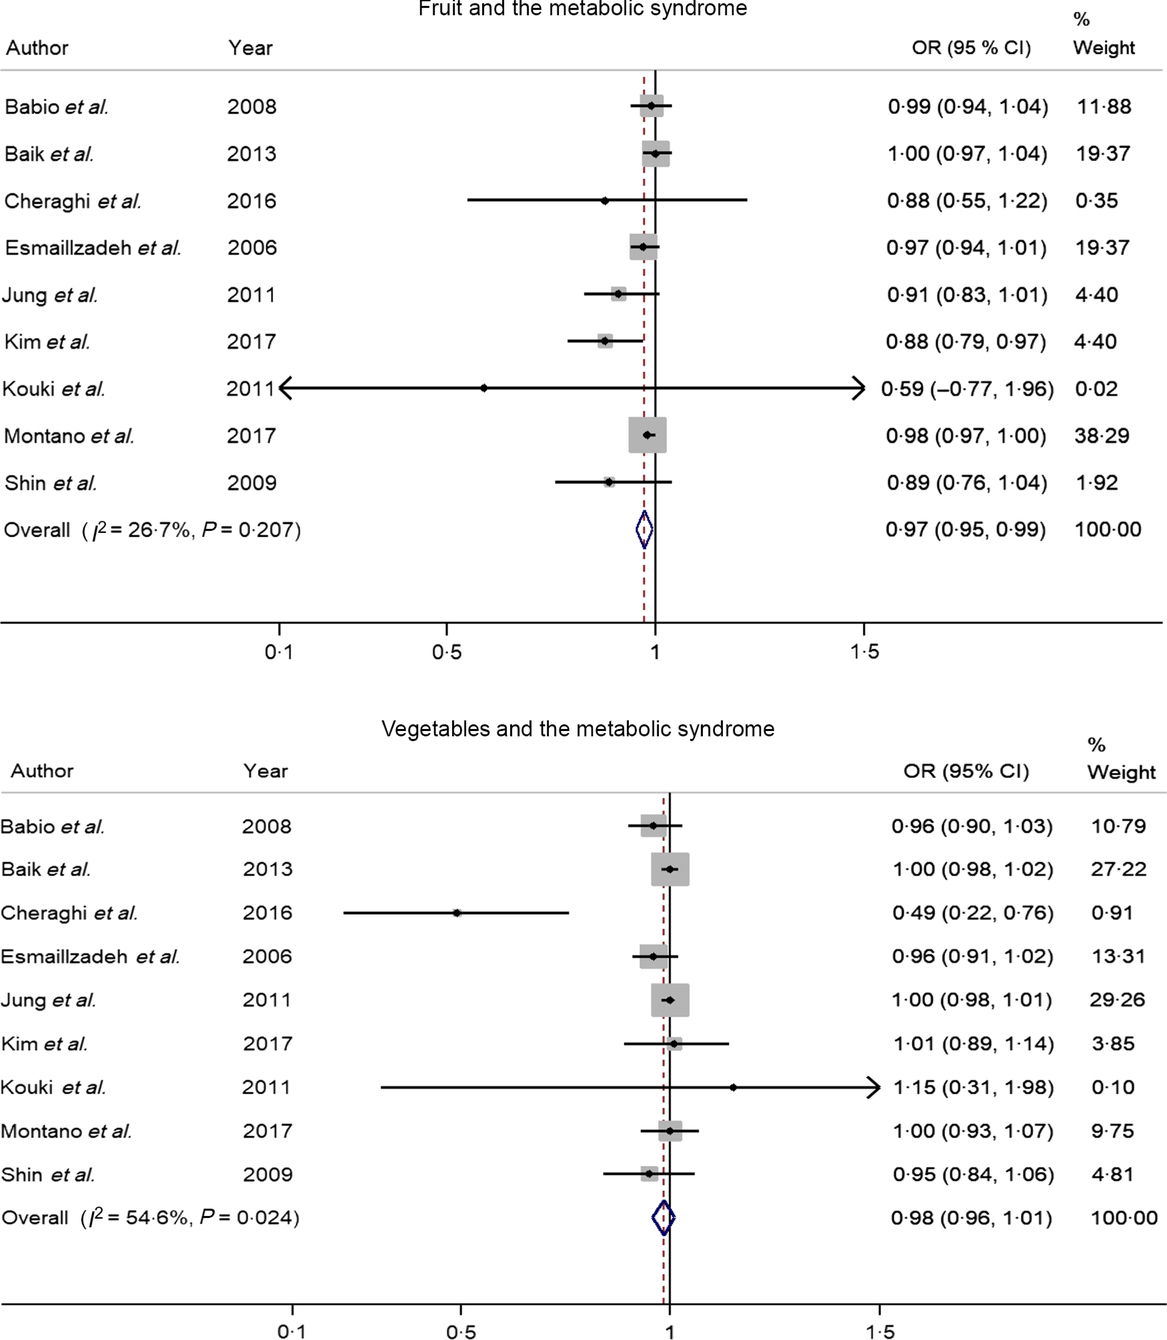
Fig. 2. Forest plot of the odds ratio of the metabolic syndrome per 100 g/d increment in fruit or vegetable consumption.
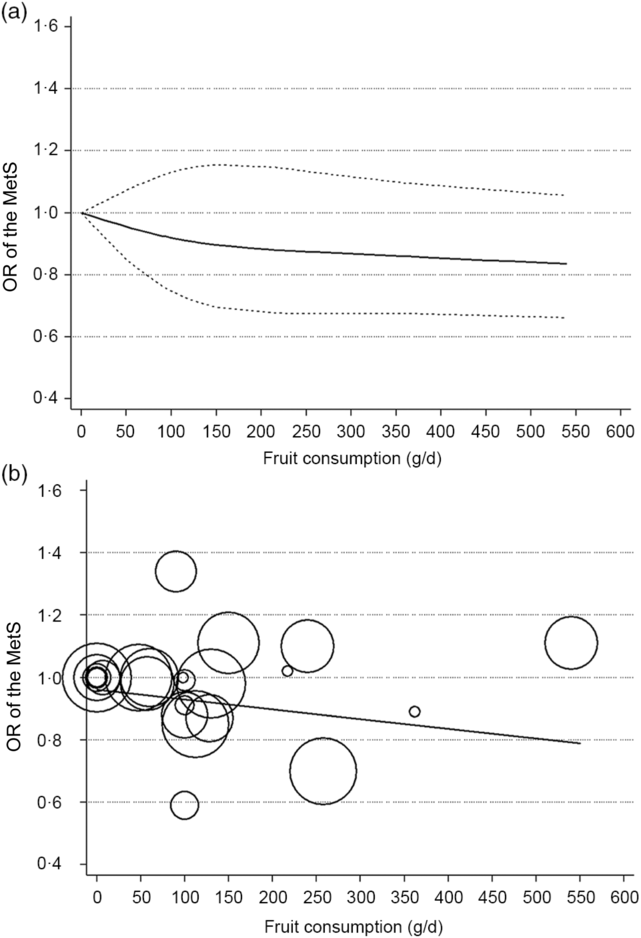
Fig. 3. Association between the risk of the metabolic syndrome (MetS) and fruit consumption in observational studies in the meta-analyses. (a) Restricted cubic splines in a multivariate random-effects dose–response model. The solid curve represents estimates of the OR for the risk of the MetS across fruit consumption relative to a reference value of 0 g/d, and the dashed lines represent the 95 % CI for the spline model. (b) Linear dose–response regression model. The solid line represents the weighted regression line, with weights proportional to the precision of the OR. The vertical axis is on a log scale.
Nine studies(Reference Kim, Kwak and Kim5–Reference Jung, Han and Song10,Reference Cheraghi, Mirmiran and Mansournia15–Reference Shin, Lim and Sung17) involving 8422 cases and 38 188 participants investigated the association between vegetable consumption and the MetS. One study(Reference Cheraghi, Mirmiran and Mansournia15) revealed an inverse association, while the other eight studies(Reference Kim, Kwak and Kim5–Reference Jung, Han and Song10,Reference Montano16,Reference Shin, Lim and Sung17) indicated no relationship. In a dose–response analysis, an increase of 100 g/d of vegetable intake was not associated with odds of the MetS (OR 0·98; 95 % CI 0·96, 1·01), with moderate heterogeneity (I² = 54·6 %, P = 0·02; τ 2 = 0·0005). There was no evidence of a non-linear association between vegetable intake and the MetS in the cubic spline model (P non-linearity = 0·35).
Subgroup, meta-regression and sensitivity analyses
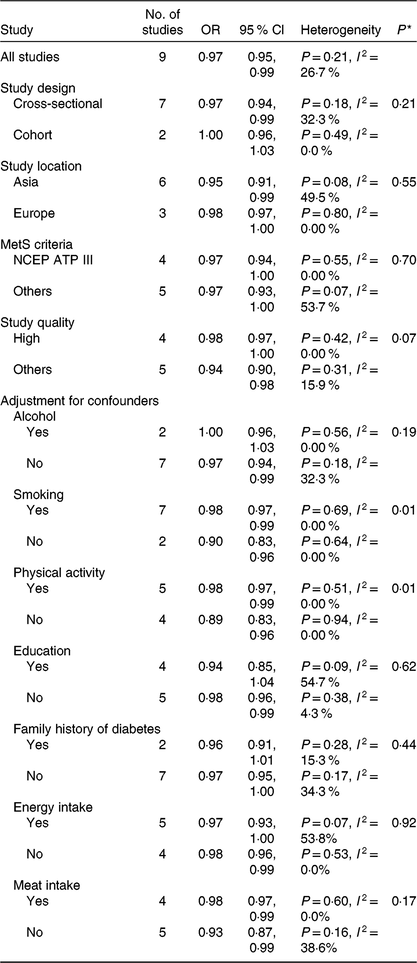
Results for the subgroup analyses and meta-regression analyses of fruit consumption and chance of the MetS are shown in Table 2. Cross-sectional studies showed significant inverse associations (OR 0·97; 95 % CI 0·94, 0·99), while cohort studies showed a non-significant inverse association; however, the difference was not significant (P = 0·21). Asian studies (OR 0·95; 95 % CI 0·91, 0·99) showed significant inverse associations, while European studies showed a non-significant inverse association; however, the difference was not significant (P = 0·55). Subgroup analyses found no significant difference in the MetS criteria (P > 0·3 for all comparisons). Study quality (P = 0·07) and adjustment factors such as smoking (P = 0·01) and physical activity (P = 0·01) seemed to contribute to the heterogeneity in this analysis. With regard to the adjustment factors, such as alcohol, education, family history of diabetes, energy intake and meat intake, no significant differences were found based on the results of meta-regression analyses (P > 0·1 for all comparisons). When one study was deleted from the model at a time, the summary OR ranged from 0·96 (95 % CI 0·93, 0·99) to 0·98 (95 % CI 0·96, 1·00).
Table 2. Subgroup analyses of fruit consumption and chance of the metabolic syndrome (MetS)
NCEP ATP III, National Cholesterol Education Program Adult Treatment Panel III.
* P values for heterogeneity between subgroups with meta-regression analysis.
Subgroup and meta-regression analyses of vegetable intake and the MetS are shown in Table 3. The subgroup analyses found no significant difference in study design, study location, the MetS criteria, the quality assessment of studies (P ≥ 0·1 for all comparisons) and adjustment factors (P ≥ 0·1 for all comparisons). In the sensitivity analysis of vegetable intake and the MetS, the summary OR ranged from 0·97 (95 % CI 0·93, 1·01) to 1·00 (95 % CI 0·99, 1·01). When one study(Reference Cheraghi, Mirmiran and Mansournia15), by Cheraghi et al., was excluded, the significance for heterogeneity disappeared (I 2 = 0·0 %, P = 0·77), and the same result was obtained (OR 1·00 per 100 g/d; 95 % CI 0·99, 1·01).
Table 3. Subgroup analysis of vegetable consumption and chance of the metabolic syndrome (MetS)
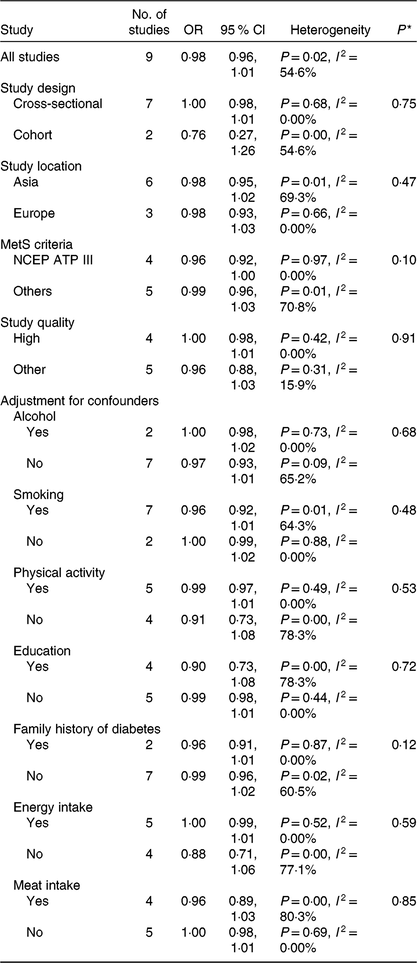
NCEP ATP III, National Cholesterol Education Program Adult Treatment Panel III.
* P values for heterogeneity between subgroups with meta-regression analysis.
Small study effect
There was no indication of a small study effect for a dose–response meta-analysis of fruit consumption and the MetS based on Egger’s test (Egger’s P = 1·00), but an LFK index indicated evidence of a study effect (LFK index = −5·78). For vegetable consumption, the test revealed evidence of a small study effect (Egger’s P = 0·03, LFK index = −2·62).
Discussion
This meta-analysis of seven cross-sectional studies and two cohort studies revealed an inverse relationship between fruit consumption and chance of the MetS. The association between fruit consumption and the MetS was linear; no non-linear association was found. In a dose–response meta-analysis, an increment of 100 g/d in fruit consumption was related to a 3 % lower risk of the MetS. Vegetable consumption (nine studies) was not associated with risk of the MetS.
These results are consistent with the findings from previous studies showing the beneficial association of fruit consumption with the incident MetS in the highest v. lowest categories of an observational meta-analysis(Reference Tian, Su and Wang11,Reference Zhang and Zhang12) . A meta-analysis of sixteen studies including thirteen cross-sectional and three cohort studies showed that fruit consumption was associated with a significantly decreased OR for the MetS. The summary OR for the MetS was 0·87 (95 % CI 0·82, 0·92) for fruit consumption(Reference Tian, Su and Wang11). A meta-analysis of twenty-six observational studies including twenty cross-sectional, one case–control and five cohort studies reported that the summary OR for the MetS in the highest category of fruit consumption compared with that in the lowest category of the fruit consumption was 0·81 (95 % CI 0·75, 0·88)(Reference Zhang and Zhang12). Another meta-analysis, including eight randomised controlled trials with 396 participants, reported that fruit intake was negatively associated with diastolic blood pressure in patients with the MetS (standardised mean differences = −0·29; 95 % CI −0·57, −0·02)(Reference Shin, Kim and Kang30).
Mechanisms have been suggested to explain the beneficial effects of fruit intake on the MetS. Fruits have many nutrients, such as vitamins, minerals and phytochemicals, which have favourable effects on health outcome. Fruits contain abundant antioxidants such as vitamins C and E, Mg, K, folic acid and phytochemicals. A higher intake of antioxidants can modulate oxidative stress by reducing levels of reactive oxygen species in both humans and animal models(Reference Khalil, Gaudreau and Cherki31,Reference Bokov, Chaudhuri and Richardson32) . The protective effects of fruits against the MetS may be mediated through the effect of favourable components on inflammatory markers such as C-reactive protein and TNF-α(Reference Watzl, Kulling and Moseneder33,Reference Hermsdorff, Zulet and Puchau34) . Higher consumption of fruits is associated with a lower plasma level of C-reactive protein(Reference Mahoney and Loprinzi35). Phytochemicals may also play a major role in preventing insulin resistance by increasing the body’s production of insulin, which has a critical function in preventing the MetS(Reference Jayaprakasam, Vareed and Olson36). Intake of fibre, which is abundant in fruits and vegetables, is also inversely associated with the MetS(Reference Chen, Chen and Wang37).
Unlike in previous meta-analyses, vegetable intake was not significantly associated with the chance of the MetS in this dose–response meta-analysis. Two meta-analyses published previously reported that the pooled OR for the MetS in the highest category of vegetable consumption were 11–15 % lower than those in the lowest category(Reference Tian, Su and Wang11,Reference Zhang and Zhang12) . The present study included different publications from the previous studies because the present meta-analysis only included studies to provide data on the chance of the MetS (OR/RR and 95 % CI) according to vegetable intake to reveal a dose–response association. Also, the studies used different inclusion criteria and analytical methods for the data. The discrepancy in results may be due to differences in the variety of vegetables consumed or the cooking methods of vegetables consumed among studies. The biological effect of vegetables may vary with their variety(Reference Park, Ham and Lee38). Therefore, the consumption of different vegetable types might affect the association between vegetable consumption and risk of the MetS. Luo et al. found that the consumption of white vegetables, such as radish, sprouts and pumpkin was inversely associated with risk of cancer, while green vegetable intake was not(Reference Luo, Fang and Lu39). A recent meta-analysis revealed that the total vegetable intake was associated with risk of the MetS, while green vegetable intake was not associated with the MetS in a subgroup analysis(Reference Zhang and Zhang12). In addition, fruits are more commonly eaten raw than cooked, whereas vegetables are consumed after various cooking methods. Vegetables are eaten steamed or boiled and mixed with a variety of seasonings, such as salt, pepper or dressing. These different cooking methods among various populations might influence the association between vegetable intake and chance of the MetS.
Between-study heterogeneity is common in meta-analysis. In the present study, the adjustment for smoking and physical activity was associated with heterogeneity. The effect of fruit consumption on the chance of the MetS was smaller in studies with adjustment for smoking or physical activity. Therefore, these potential risk factors for the MetS should be considered in the analysis of the association between dietary factors and risk of the MetS.
To the best of our knowledge, this is the first study to reveal a dose–response relationship between fruit or vegetable consumption and chance of the MetS. The present study provided quantitative data on the association between fruit consumption and chance of the MetS. A relatively large number of participants were included, which reduced the sampling error and enabled a much greater possibility of reaching reasonable conclusions. Most studies included in the meta-analysis were of good quality, and the included studies were analysed based on the most adjusted results. Most analyses had a very narrow 95 % CI, and it proves that the estimates had high precision.
The study has some limitations. Most studies included in the meta-analysis were cross-sectional studies; large-scale cohort studies should be included to confirm the results. Although most of the included studies adjusted for most of the major confounding factors, there is a possibility of residual or unmeasured confounding factors on the association between fruit intake and the MetS, based on a rather small E-value(Reference VanderWeele and Ding40). The use of different diagnosis criteria for the MetS, different methods of dietary assessment or a small study effect might affect the strength of the link between fruit or vegetable consumption and chance of the MetS. The potential for ecological bias exists since meta-analyses use aggregate data rather than analysing individual characteristics. Additionally, failure to identify non-linearity in the cubic spline models can result in overestimated or underestimated relationships.
In conclusion, the dose–response meta-analysis of observational studies showed that an increase of 100 g/d in fruit consumption was associated with 3 % lower odds of the MetS, but vegetable consumption was not associated with the MetS. For future research, a meta-analysis including cohort studies with high-quality or well-designed randomised clinical trials should be conducted to confirm the association between fruit or vegetable intake and the risk of the MetS. Also, the effects of different varieties of fruits (e.g. citrus fruit, non-citrus fruit and carotene-rich fruit) and vegetables (e.g. green and white, cruciferous, carotene-rich and green leafy) on the risk of the MetS should be examined.
Supplementary material
For supplementary material/s referred to in this article, please visit https://doi.org/10.1017/S000711451900165X
Acknowledgements
This research was supported by the Basic Science Research Program of the National Research Foundation of Korea (NRF), funded by the Ministry of Education, Science, and Technology (NRF2017 R1D1A1B03931307). The NRF had no role in the study design, data analysis, or writing of this article.
All of the authors had a significant role in the study. M. L. contributed to the data analysis and manuscript writing. M. L. contributed to the literature search and data analysis. J. K. contributed to research design and manuscript writing; she has the primary responsibility for the final content. All authors read and approved the final manuscript.
The authors declare that there are no conflicts of interest


