


Obesity is a growing health problem worldwide and a main driver in the development of chronic diseases such as type 2 diabetes, CVD and some cancers( Reference Hurt, Kulisek and Buchanan 1 ). Foods with high satiating capacity could be a strategy to limit food intake, thereby contributing to the prevention of energetic overconsumption and subsequent development of obesity and chronic diseases( Reference Swinburn, Caterson and Seidell 2 ). Thus, a better understanding of the mechanisms by which different foods influence postprandial responses of glucose, insulin and appetite hormones, and how these responses are related to specific food components, is urgently needed.
In epidemiological studies, high whole grain intake has consistently been associated with reduced risks of developing type 2 diabetes, CVD and colorectal cancer( Reference Mellen, Walsh and Herrington 3 – Reference Tang, Wang and Long 6 ). This has been suggested to be related to a high content of dietary fibre and the presence of certain bioactive compounds in whole grain( Reference Fardet 7 ). Rye is one of the most widely consumed cereals in Scandinavia( Reference Frølich, Åman and Tetens 8 ), usually in the form of whole grain( Reference Åman, Andersson and Rakha 9 ). It is also, among cereals, the richest source of dietary fibre( Reference Andersson, Fransson and Tietjen 10 ), as well as a rich source of bioactive compounds( Reference Mattila, Pihlava and Hellström 11 ).
Intake of whole grain rye-based foods, such as porridge, soft breads and crispbread, compared with corresponding refined wheat foods, has also shown beneficial effects such as increased satiety( Reference Isaksson, Fredriksson and Andersson 12 – Reference Johansson, Lee and Risérus 16 ) and lower postprandial insulin and, in certain cases, glucose responses( Reference Johansson, Lee and Risérus 16 – Reference Sandberg, Björck and Nilsson 18 ). The mechanisms underlying the beneficial effects of rye foods have not been fully elucidated, although specific features of rye bread microstructure, such as a dense structure and an amylose layer surrounding starch granules, have been suggested to be important factors( Reference Juntunen, Laaksonen and Autio 19 ). However, processing can alter microstructure, composition and bioavailability of different compounds, which might affect the postprandial responses to a food.
Sourdough fermentation is commonly used in the production of rye bread to improve its structure and flavour( Reference Brummer and Lorenz 20 ). Beneficial effects in the form of reduced insulin and glucose responses have also been demonstrated for sourdough breads( Reference Liljeberg, Lönner and Björck 21 , Reference Najjar, Parsons and Duncan 22 ). This has been attributed to an increased content of organic acids in sourdough-fermented bread, leading to reduced starch digestibility or gastric emptying rate( Reference Östman, Nilsson and Liljeberg Elmståhl 23 – Reference Liljeberg and Björck 25 ). Increased satiety has also been observed for breads supplemented with vinegar or sodium propionate, although effects on satiety has, to our knowledge, not been observed for sourdough-fermented breads( Reference Liljeberg, Lönner and Björck 21 ). Furthermore, fermentation has been shown to increase the content of some bioactive compounds, for example folates, free phenolic acids, lignans and alkylresorcinols( Reference Katina, Liukkonen and Kaukovirta-Norja 26 ). A high content of phenolic compounds in sourdough may contribute to lowering the glycaemic and insulin responses( Reference Jung, Ran Kim and Hwang 27 – Reference Bondia-Pons, Nordlund and Mattila 30 ). Moreover, soluble viscous dietary fibres (arabinoxylan and β-glucan) are degraded during fermentation by endogenous enzymes, leading to reduced molecular weight( Reference Rakha, Åman and Andersson 31 ). This has been suggested as a mechanism explaining a lower insulin response to unfermented compared with yeast-fermented rye crispbread( Reference Johansson, Lee and Risérus 16 ), because the high molecular weight of soluble fibre contributes to increased digesta viscosity, which might reduce gastric emptying rate and the digestion and absorption rate of nutrients( Reference Wood 32 ). Despite demonstrated effects caused by sourdough fermentation and a consumer perception that sourdough bread is healthy( Reference Dewettinck, Van Bockstaele and Kuhne 33 ), studies evaluating the role of sourdough for appetite and metabolic responses remain scarce.
In the present acute breakfast intervention study in apparently healthy men and women, we investigated the hypothesis that sourdough-fermented rye crispbread and unfermented rye crispbread decreased hunger and lowered insulin secretion compared with refined wheat crispbread, and that the decreased hunger, partly, is due to stimulation of the satiety hormone glucagon-like peptide-1 (GLP-1). We further hypothesised that sourdough-fermented rye crispbread may alter the microstructure and composition of dietary fibres, as well as the gastric viscosity, and that such effects are reflected by differences in appetite and postprandial metabolic responses.
Methods
Subjects
Apparently healthy men and women were recruited through advertisements in local newspapers and through personal invitations sent to participants in previous studies. After screening, subjects who met the eligibility criteria were invited to participate in the study. The criteria were age 18–70 years, BMI 18·5–30 kg/m2, physical activity level <2, fasting plasma glucose <6·0 mmol/l, fasting serum insulin <11 mE/l, serum thyroid-stimulating hormone <2·5 mIE/l, plasma LDL <5·3 mmol/l, fasting plasma TAG <1·8 mmol/l, non-smoker, no medication likely to affect appetite, no medical conditions involving the gastrointestinal tract, no gluten intolerance or food allergies, no physical problems with eating, habitual consumption of breakfast, lunch and dinner, no dieting or self-reported fluctuations in body weight of more than 10 % in the 3 months before screening, no recent participation in a dietary study, no pregnancy and no lactation.
The study was carried out in compliance with the Helsinki declaration and was approved by the regional ethics committee in Uppsala (registration no. 2014/484). Recruitment started on 20 January 2014, and the last subject was enrolled on 2 June 2014. The experimental work was completed by 2 March 2015. Individuals interested in participating were given written and oral information about the study and were informed that they could withdraw from the study at any time without any justification. Before inclusion in the study, written consent was obtained from all subjects. The study was registered retrospectively at ClinicalTrials.gov (identifier: NCT02793297).
Study design
A single-blinded, randomised cross-over trial was conducted with three different isoenergetic treatments consisting of crispbreads served as part of a complete standardised breakfast (Table 1).
Table 1 Food and nutrient composition of the breakfast diets
* As analysed by the Uppsala method with inclusion of fructans.
† Energy content was calculated using a conversion factor of 37 kJ/g for fat, 17 kJ/g for proteins and carbohydrates, and 8 kJ/g for fibre.
Each subject received all treatments and was randomly allocated to one of three pre-selected sequences/treatment orders by using stratified randomisation to ensure balance in the three sequences (http://www.randomization.com/). The selected sequences were wheat–unfermented rye–sourdough-fermented rye; sourdough-fermented rye–wheat–unfermented rye; unfermented rye–sourdough-fermented rye–wheat. Between each treatment, there was a wash-out period of at least 6 d for each subject. On the day before visiting the clinic at the Uppsala University Hospital, subjects were asked to refrain from alcohol and fibre-rich foods and to fast from 22.00 hours. On arrival at the clinic (07.30–08.00 hours), a cannula was inserted in the arm vein and subjects were seated in the same room, at a round table, and instructed to eat the breakfast provided within 15 min. The test ended 6 h after consumption of the breakfast. In the first 4 h, the subject had to remain at the clinic, whereas the last 2 h could be spent at a location of their choice. During the test period, the subjects were not allowed to eat or drink anything not included in the study.
Test meals
Sourdough-fermented whole grain rye crispbread, unfermented whole grain rye crispbread and refined wheat crispbread (to serve as a control) were included in the study as part of the standardised breakfast, together with coffee/tea (150 ml), margarine, cheese and juice (150 ml) (Table 1). The total energy provided by the breakfast was based on experiences gained in two previous studies( Reference Forsberg, Aman and Landberg 15 , Reference Johansson, Lee and Risérus 16 ) and represented about 20 % of daily energy intake, which is in accordance with general guidelines on meal size issued by the Swedish Food Agency. Information from product labels was used for calculation of energy and composition for margarine, cheese and juice.
All crispbreads were produced and supplied by Barilla, Sweden, and have rated well in consumer acceptance tests (Italian manufacturer Barilla, unpublished results). The sourdough-fermented rye crispbread was made using whole grain rye flour, whole grain rye sourdough (19 %), yeast, barley malt, emulsifier (mono- and diglycerides or fatty acids), salt and water. The sourdough, with an in-house culture mixture, was fermented for 40 h and then mixed with the other ingredients. This was followed by a two-step fermentation, first for 120 min at 29°C, followed by 35 min with an increase from 30 to 38°C. Unfermented rye crispbread was mixed with water at 12°C and then whipped at 6°C to incorporate air into the dough. According to data provided by the manufacturer, 30–42 % of particles in the flour used for the unfermented rye crispbread were <125 µm in diameter and 20–28 % were >1040 µm, whereas the corresponding fractions in the flour used for sourdough-fermented rye crispbread comprised 51–57 and 3–6 %, respectively. Yeast-fermented refined wheat crispbread was made from refined wheat, yeast, salt and water. All crispbreads were baked.
Chemical analysis of crispbreads
Crispbread samples were milled with a cyclone sample mill (Retsch). Extractable and unextractable dietary fibre content and composition were analysed by the Uppsala method( Reference Theander, Åman and Westerlund 34 ). Concentration of arabinoxylan and arabinogalactan was calculated assuming an arabinose/galactose ratio of 0·69 in extractable arabinogalactan( Reference Loosveld, Grobet and Delcour 35 ). Concentration of β-glucan, fructan and resistant starch was analysed using a K-BGLU kit, a K-FRUC kit and a K-RSTAR kit, respectively (Megazyme). Calcofluor average molecular weight of β-glucan (Mcf) was analysed using size-exclusion chromatography with fluorescence detection( Reference Rimsten, Stenberg and Andersson 36 ). Crude fat was determined according to the method described in the Official Journal of the European Communities and protein was determined according to the Kjeldahl method (N×6·25). The amounts of l-lactic acid, d-lactic acid and acetic acid were determined enzymatically (Roche and R-Biopharm). An amount of 10 g of sample was mixed with 100 ml of distilled water and homogenised. The mixture was heated to 60°C and kept there for 5 min and was then cooled to room temperature in an ice bath. The pH was adjusted to 7 with NaOH and the mixture was then put in an ultrasonic batch for 5 min. The sample was then centrifuged and filtered through a 0·2µm membrane filter and stored at −20°C until determination. All analyses were made in duplicate.
Subjective appetite rating
Participants completed a Three-Factor Eating Questionnaire-R21( Reference Cappelleri, Bushmakin and Greber 37 ) and recorded their subjective sensation of fullness and hunger immediately before breakfast and every 30 min postprandially until 360 min after breakfast, using an electronic visual analogue scale (VAS). The use of electronic monitoring of VAS is well established, has a good reproducibility and the digital version is in agreement with the analogue version( Reference Stubbs, Hughes and Johnstone 38 , Reference Flint, Raben and Blundell 39 ). If the Palm computer was not functioning properly, the participants indicated appetite ratings on a paper 100 mm VAS. On arriving at the study centre, each participant was provided with a Palm computer model z22 (Palm Inc.), which prompted the participants to answer three questions: ‘How hungry do you feel right now?’, ‘How full do you feel right now?’ and ‘How strong is your desire to eat right now?’. The participants marked their answer on a line anchored at each end with an extreme answer to each question: ‘Not at all hungry’/‘Extremely hungry’, ‘Not at all full’/‘Extremely full’ and ‘Extremely strong’/‘Not strong at all’, respectively. The computer then translated the mark to a number between 0 and 100.
Physiological and clinical measurements
Venous blood was collected by a trained nurse 15 min before breakfast (fasting) and at 15, 35, 50, 65, 95, 125, 155, 185 and 230 min after breakfast. Blood was drawn from an antecubital vein and treated as previously described( Reference Johansson, Lee and Risérus 16 ). The aliquots of plasma were stored at −80°C before the analysis. Analyses of all clinical parameters were performed by established routine methods at the certified laboratory of the Department of Clinical Chemistry at Uppsala University Hospital. Plasma glucose was measured on an Architect c8000 and c16000 (Abbott). Plasma insulin was measured on a Roche cobas 8000 e602 module (Roche Diagnostics GmbH). Within- and between-batch CV for both assays did not exceed 10 %.
Total GLP-1 was analysed by ELISA using the EZFABP3-38K Human FABP3 ELISA Kit (Merck Millipore). Two quality controls and a blank were included in duplicate, along with an in-house plasma pooled quality control sample in each plate. Inter-batch variation, calculated as CV of average absorbance values for each set of duplicate quality control samples on different plates, did not exceed 10 %.
Simulated gastric digestion
Samples were masticated in vivo by one of the investigators on all occasions before simulated gastric digestion according to the method used by Ballance et al.( Reference Ballance, Sahlstrøm and Lea 40 ). Water was added to the collected boluses to give the same dry content, approximately 25 %, in all samples. To the bolus/water mixture, simulated gastric fluid, prepared as described by Minekus et al.( Reference Minekus, Alminger and Alvito 41 ), was added to give a final 1:1 ratio (bolus/water mixture:simulated gastric fluid) after adjustment of pH. Following the method described by Johansson et al.( Reference Johansson, Vázquez-Gutiérrez and Landberg 42 ), gastric digestion was then performed in a Rapid Visco Analyzer (Newport Scientific Pvt. Ltd) with a modified cup (three vertical baffles added) using a rate of 120 rpm, a temperature of 37°C and a run time of 2 h in order to follow the disintegration process. Samples for microscopy were collected and immediately frozen in liquid N2 and stored at −80°C until analysis. Sodium bicarbonate was added to the remaining sample to neutralise the pH and stop the pepsin activity. The samples were then stored in a fridge at 4°C until the analysis of particle size, which was carried out on the same day. Simulated gastric digestion was performed in triplicate for each of the three crispbread types.
Wet sieving was used for particle size determination as described by Johansson et al.( Reference Johansson, Vázquez-Gutiérrez and Landberg 42 ). Mesh sizes of the sieves used were 3150, 2000, 1000, 600, 425 and 250 µm.
Microscopy
For bright-field microscopy, samples were embedded in Technovit 7100 as has previously been described( Reference Ballance, Sahlstrøm and Lea 40 ). The embedded samples were then cut into 1·5-μm-thick sections with an ultra-microtome (Leica EM UC6; Leica) and stained with Lugol’s solution, which colours protein yellow and starch dark blue/violet and also distinguishes between amylopectin-rich areas (beige/brown) and amylose (blue). The stained sections were examined using a Nikon Eclipse Ni-U microscope and the images were captured with a Nikon Digital Sight DS-Fi2 camera and processed with the software NIS-Elements BR (Nikon Instruments Inc.).
For visualisation of β-glucan and arabinoxylan using immunolabelling, samples were embedded in Optimal Cutting Temperature compound and frozen and then 10-µm-thick sections were cut in a Leica CM1860 cryostat (Leica). The immunolabelling was performed as previously described( Reference Johansson, Vázquez-Gutiérrez and Landberg 42 ). Micrographs were acquired using a Zeiss LSM 780 confocal laser scanning microscope (CLSM) with a Plan-Apochromat 20× objective (NA 0·8). Two different lasers (488 nm Argon laser and 561 nm diode pumped solid-state laser) were used as excitation source. Fluorescence emissions of the secondary antibodies were collected between 493–578 nm and 570–640 nm, respectively. Zen2012 software (Carl Zeiss) was used in image acquisition and ImageJ (fiji.sc/Fiji) for processing the micrographs.
Statistical analysis
The primary outcome was AUC for appetite ratings. With a power of 0·9 and α-level of 0·05 for a two-sided test, twelve participants are sufficient to detect a meaningful 10 % difference in mean appetite ratings over 4·5 h in a comparison with a control food( Reference Flint, Raben and Blundell 39 ).
Statistical analyses were performed using SAS version 9.3 (SAS Institute Inc.). Normality of distribution of the parameters studied was tested using the Shapiro–Wilks and Kolmogorov–Smirnov test. Logarithmic transformation was applied to the concentrations of glucose and insulin, as the distributions of observed values were skewed, and values are presented as back-transformed least-square means and 95 % CI. Other values are presented as least-square means with their standard errors.
Treatment effects were evaluated using a mixed model that included fixed effects of diet, sampling time, visit occasion and interaction between diet and sampling time. Individual subject was included as a random factor. The model included an additional statement for repeated measurements, with assumption of autoregressive covariance structure. For plasma glucose, insulin and total GLP-1, the model also included baseline values as covariates. If overall effect of diet was P<0·05, then the least-square means procedure (PDIFF option) was used to compare means between three diets. The effect of visit occasion was excluded from final models because of lack of significance.
Furthermore, AUC was calculated for each individual subject after breakfast, using the trapezoid rule. Differences in postprandial insulin, glucose and GLP-1 responses were evaluated using the total AUC (0–230 min) and that for the first 120 min (0–120 min). Differences in subjective appetite rating were evaluated using the total AUC (0–360 min). The models included the same factors as above, except for time points. Differences were considered significant at P<0·05. AUC values were approximately normally distributed and were not subjected for further transformation. GraphPad Prism 4 (GraphPad Software) was used to generate the graphical elements.
Results
Crispbread characterisation
The yeast-fermented refined wheat crispbread had a higher content of fat and protein than the rye crispbreads, whereas its content of fibre was lower (Table 1). The fibre content was also lower in the sourdough-fermented than in the unfermented rye crispbread, mainly because of a lower content of fructan (Table 2). The content of lactic acid was higher in the sourdough-fermented rye crispbread compared with the other crispbreads. Acetic acid was low in all crispbreads and compared with the acid equivalents total lactic and acetic acid was low in the crispbreads. This can be because of the presence of other acids that were not analysed.
Table 2 Dietary fibre content and composition of unfermented rye crispbread, sourdough-fermented rye crispbread and yeast-fermented refined wheat crispbread (% of DM)
* Calculated as the sum of fructan and total dietary fibre as analysed by the Uppsala method( Reference Rakha, Åman and Andersson 31 ).
† Calculated as the sum of fructan and total extractable dietary fibre as analysed by the Uppsala method( Reference Rakha, Åman and Andersson 31 ).
‡ Calculated from the sum of arabinose, xylose and galactose, assuming an arabinose:extractable galactose ratio of 0·69 in arabinogalactan( Reference Wood 32 ).
§ Calculated as the difference between total β-glucan and glucose residues as analysed by the Uppsala method( Reference Rakha, Åman and Andersson 31 ).
In the rye crispbreads, highly swollen starch granules made up the continuous phase of the food matrix, whereas protein formed extended networks surrounding less swollen starch granules in the refined wheat crispbread (Fig. 1). In the rye crispbreads, and most prevalent in the unfermented rye crispbread, leakage of amylose could also be observed. In line with this starch also appeared more swollen/gelatinised in the unfermented than in the sourdough-fermented rye crispbread. Furthermore, the rye crispbreads had a more heterogeneous structure, with bran fragments spread throughout the matrix. These fragments were larger in the unfermented than in the sourdough-fermented rye crispbread. Lamellas in the yeast-fermented refined wheat crispbread and in the unfermented rye crispbread also appeared thinner than those in the sourdough-fermented rye crispbread.
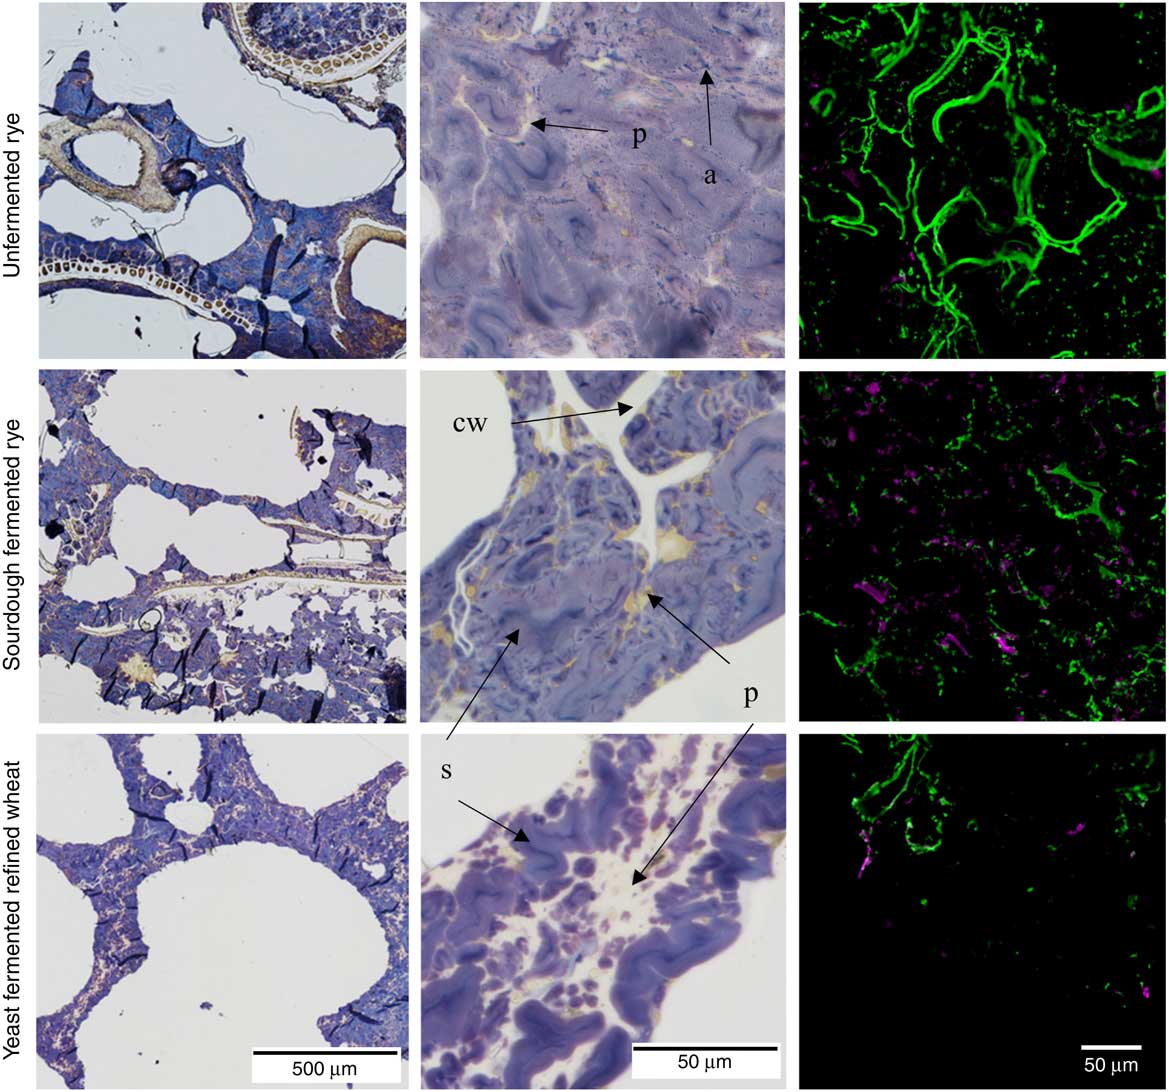
Fig. 1 Light microscope (LM) and confocal laser scanning microscope (CLSM) micrographs of unfermented rye crispbread, sourdough-fermented rye crispbread and refined wheat crispbread. Left and centre: LM micrographs of the crispbreads stained with iodine. Protein (p) is stained yellow, starch (s) purple, amylopectin brown and amylose (a) blue. Cell walls (cw) are unstained, but can be seen in the starch/protein matrix. Right: CLSM micrographs of immunolabelled β-glucan (![]() ) and arabinoxylan (
) and arabinoxylan (![]() ) in the crispbreads.
) in the crispbreads.
In the unfermented rye crispbread, the viscous β-glucan and arabinoxylan appeared more intact and to a higher degree located in the cell walls compared, whereas in both the yeast-fermented refined wheat crispbread and sourdough-fermented rye crispbread it appeared more degraded and distributed throughout the food matrix (Fig. 1, right). The immunolabelling of arabinoxylan was weak in the unfermented rye crispbread.
Subjects
In total, thirty-three subjects were screened. Of these, twenty-four healthy, non-smoking Swedish adults (thirteen males and eleven females) met the eligibility criteria and were included in the study (Table 3). All completed the study.
Table 3 Baseline characteristics of participants who completed the study (Least-square mean values with their standard errors)
TFEQ, Three-Factor Eating Questionnaire.
* One of the participants refused to donate blood samples, and thus samples for glucose, insulin and glucagon-like peptide-1 measurements were provided by twenty-three participants.
† Systolic/diastolic pressure determined as a mean of two determinations after 15 min rest.
Effects on subjective appetite ratings
Significant overall effects of diet for hunger and desire to eat (P=0·03 for both) were observed when comparing AUC (0–360 min), but diet did not affect these parameters when modelling the curves (P=0·07 and 0·09, respectively) (Fig. 2). The differences in AUC for hunger were because of lower scores after sourdough-fermented rye crispbread v. yeast-fermented refined wheat crispbread, whereas the difference in desire to eat was because of lower scores for both rye breads v. yeast-fermented refined wheat crispbread (Fig. 2, right). The main effect on fullness did not reach statistical significance for AUC (P=0·08) or for curves (P=0·06) (Fig. 2, left).
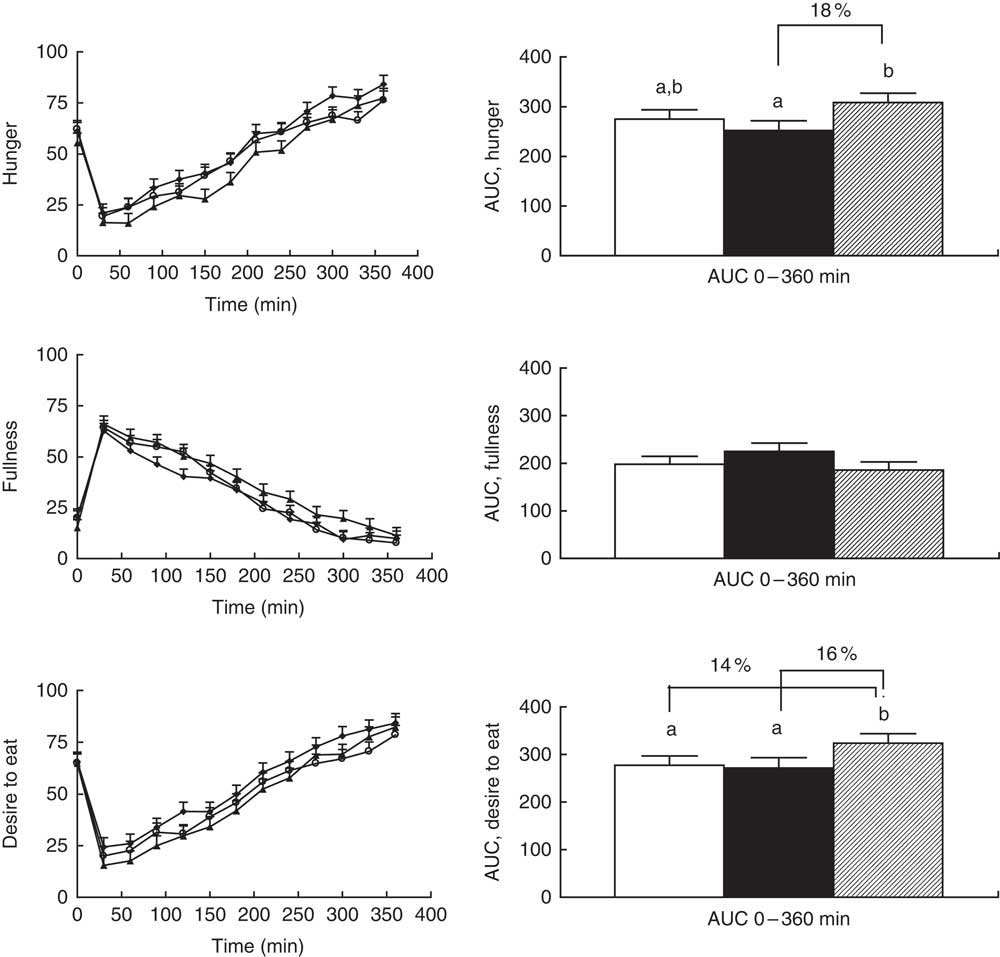
Fig. 2 Left: subjective appetite ratings reported by twenty-four participants. Values are least-square means with their standard errors for ratings obtained immediately before breakfast and at different time points after breakfast. ![]() , Unfermented rye;
, Unfermented rye; ![]() , sourdough-fermented rye;
, sourdough-fermented rye; ![]() , refined wheat. No significant effect of diet was found for hunger (P=0·066), fullness (P=0·089) or desire to eat (P=0·063). The effect of sampling time was significant for hunger, fullness and desire to eat (P<0·001). No significant diet×sampling time interaction was found for hunger, fullness or desire to eat (P>0·1). Right: AUC for subjective appetite ratings reported by twenty-four participants. A statistically significant difference between diets was found for hunger (P=0·032) and desire to eat (P=0·028) but not for fullness (P=0·077). Values are adjusted least-square means with their standard errors represented by vertical bars.
, refined wheat. No significant effect of diet was found for hunger (P=0·066), fullness (P=0·089) or desire to eat (P=0·063). The effect of sampling time was significant for hunger, fullness and desire to eat (P<0·001). No significant diet×sampling time interaction was found for hunger, fullness or desire to eat (P>0·1). Right: AUC for subjective appetite ratings reported by twenty-four participants. A statistically significant difference between diets was found for hunger (P=0·032) and desire to eat (P=0·028) but not for fullness (P=0·077). Values are adjusted least-square means with their standard errors represented by vertical bars. ![]() , Unfermented rye;
, Unfermented rye; ![]() , sourdough-fermented rye;
, sourdough-fermented rye; ![]() , refined wheat. Differences between treatments are given as percentage difference between the least-square mean values for AUC of the diets. a,b Unlike letters denote significant differences between treatments (P<0·05).
, refined wheat. Differences between treatments are given as percentage difference between the least-square mean values for AUC of the diets. a,b Unlike letters denote significant differences between treatments (P<0·05).
Effects on postprandial glucose, insulin and total glucagon-like peptide-1 concentrations
AUC (0–125 min) and AUC (0–230 min) values for postprandial glucose were similar after intake of all crispbreads (P=0·76 and P=0·06, respectively; Fig. 3, right). No significant difference in postprandial glucose response between the different crispbreads was found when modelling the curves (P=0·15; Fig. 3, left).
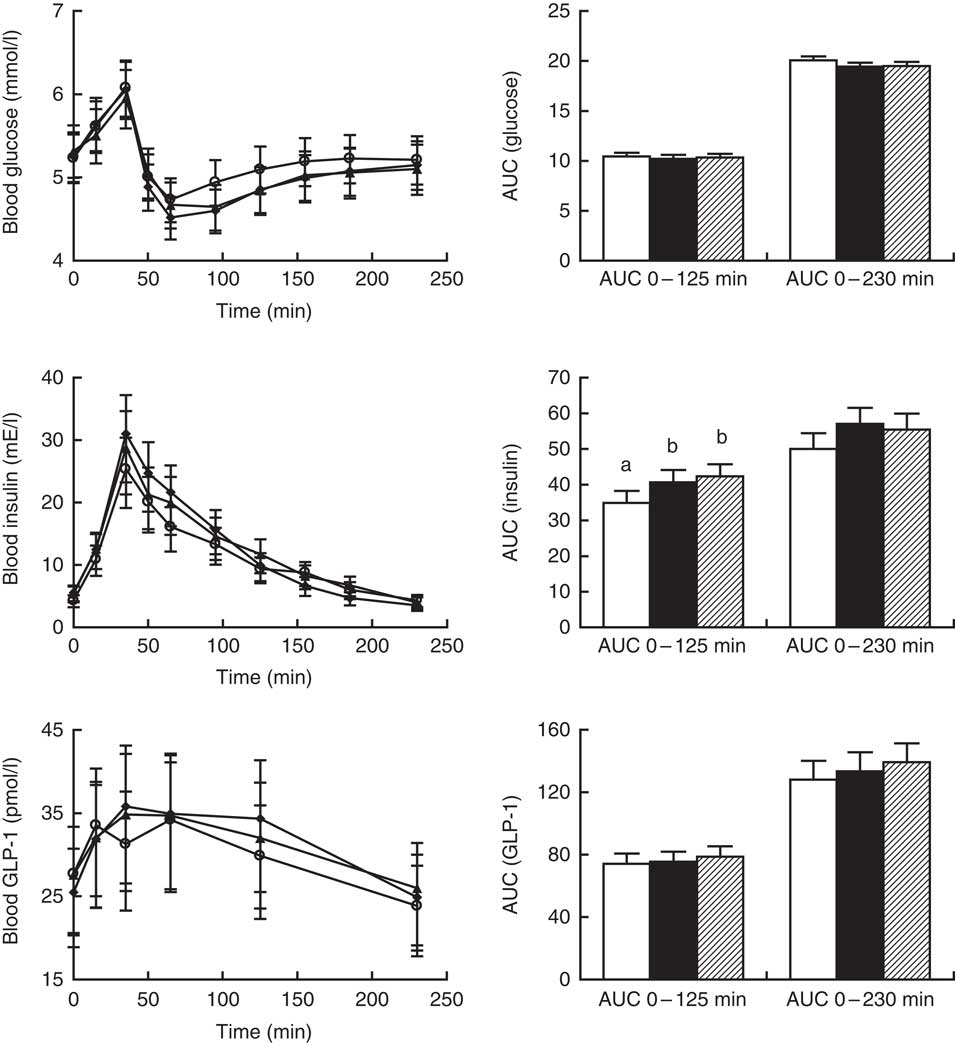
Fig. 3 Left: postprandial glucose, insulin and glucagon-like peptide-1 (GLP-1) responses for twenty-three participants. Values obtained immediately before breakfast and at different time points after breakfast are presented as least-square means with their standard errors after back-transformation to the original scale. ![]() , Unfermented rye;
, Unfermented rye; ![]() , sourdough-fermented rye;
, sourdough-fermented rye; ![]() , refined wheat. No significant effect of diet was found on glucose (P>0·1), insulin (P>0·1) and GLP-1 (P=0·095) or of diet×sampling time interaction on glucose (P>0·1), insulin (P=0·059) or GLP-1 (P>0·1). The effect of sampling time was significant for glucose, insulin and GLP-1 (P<0·001). Right: AUC for postprandial glucose, insulin and GLP-1 responses between 0–125 min and 0–230 min for twenty-three participants. AUC values are presented as least-square means with their standard errors represented by vertical bars.
, refined wheat. No significant effect of diet was found on glucose (P>0·1), insulin (P>0·1) and GLP-1 (P=0·095) or of diet×sampling time interaction on glucose (P>0·1), insulin (P=0·059) or GLP-1 (P>0·1). The effect of sampling time was significant for glucose, insulin and GLP-1 (P<0·001). Right: AUC for postprandial glucose, insulin and GLP-1 responses between 0–125 min and 0–230 min for twenty-three participants. AUC values are presented as least-square means with their standard errors represented by vertical bars. ![]() , Unfermented rye;
, Unfermented rye; ![]() , sourdough-fermented rye;
, sourdough-fermented rye; ![]() , refined wheat. A significant effect of diet was found on insulin for AUC 0–125 min (P=0·009) but not AUC 0–230 min (P=0·054). No significant effect of diet was found on AUC 0–125 min for glucose or GLP-1 responses (P>0·1) or on AUC 0–230 min for glucose (P=0·058) or GLP-1 (P>0·1). a,b Unlike letters denote significant differences between treatments (P<0·05).
, refined wheat. A significant effect of diet was found on insulin for AUC 0–125 min (P=0·009) but not AUC 0–230 min (P=0·054). No significant effect of diet was found on AUC 0–125 min for glucose or GLP-1 responses (P>0·1) or on AUC 0–230 min for glucose (P=0·058) or GLP-1 (P>0·1). a,b Unlike letters denote significant differences between treatments (P<0·05).
Insulin AUC (0–125 min) was significantly affected by diet (P=0·01), and was lowest after consumption of unfermented rye crispbread, whereas no differences were observed between sourdough-fermented rye and yeast-fermented refined wheat crispbread (Fig. 3, right). Insulin AUC (0–230 min) was not affected (P=0·06). No significant difference in postprandial insulin response between the different crispbreads was found when modelling the curves (P>0·05; Fig. 3, left).
GLP-1 AUC (0–125 min) and AUC (0–230 min) values were similar after intake of all crispbreads (P=0·45 and P=0·29, respectively; Fig. 3, right). Overall effect of diet showed no significant effect on postprandial plasma total GLP-1 concentrations (P=0·09; Fig. 3, left).
Simulated digestion
After mastication, a continuous starch phase, with a weak staining likely due to hydration, which connected intact cell structures and aleurone layers, was observed for the unfermented rye crispbread (Fig. 4). In the sourdough-fermented rye crispbread and the refined wheat crispbread, the bolus instead consisted of discrete fragments of the food matrix without a connective starch phase.
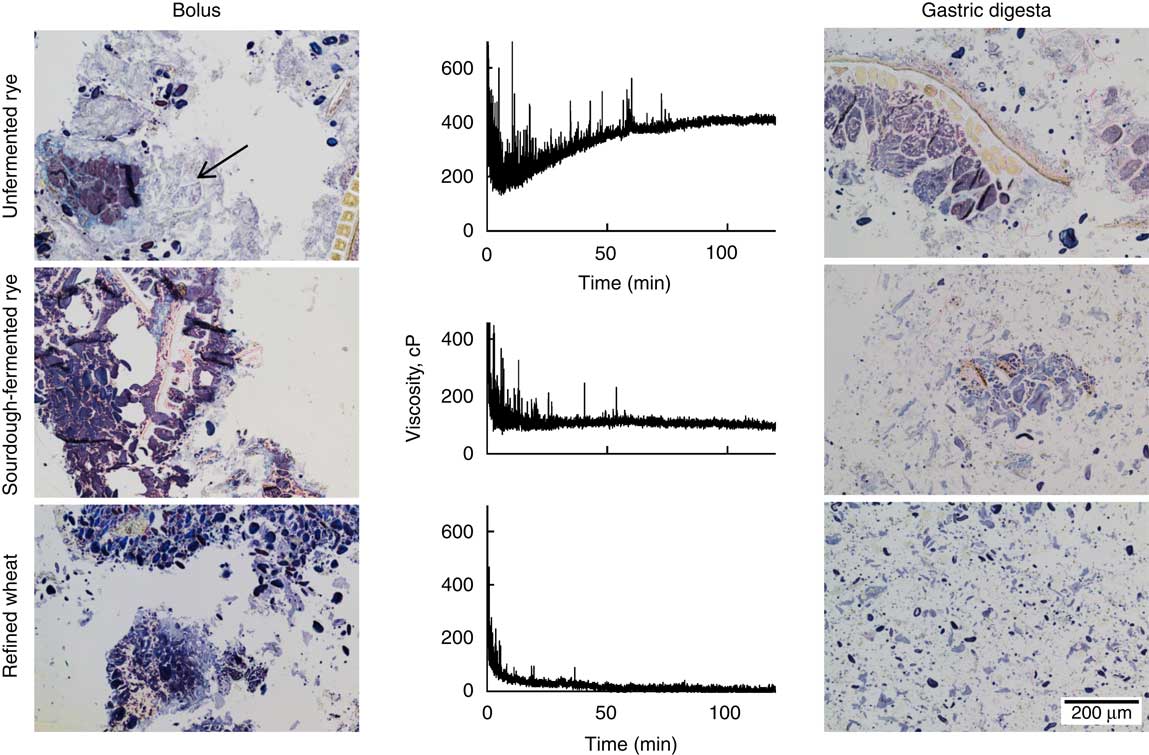
Fig. 4 Left: light microscope (LM) micrographs of the masticated samples. Centre: changes in viscosity over 120 min, measured with a Rapid Visco Analyzer at 120 rpm and 37°C. Right: LM micrographs of sample structure after 120 min simulated gastric digestion. Samples are stained with iodine. Protein is yellow, starch purple, amylopectin brown and amylose blue. Arrow indicates the presence of a hydrated starch phase.
The continuous starch phase observed in the bolus of the unfermented rye crispbread was disrupted after 120 min of simulated gastric digestion (Fig. 4, right). The digesta of the sourdough-fermented rye crispbread contained similar, but smaller, fragments compared with the bolus. For the refined wheat crispbread, the digesta mainly consisted of free starch granules and small fragments of bran.
The size of the particles in the simulated gastric digesta differed between the crispbreads, with the smallest particles found in the digesta of the refined wheat crispbread (97 % <250 µm), followed by the sourdough-fermented (90 % <250 µm) and the unfermented rye crispbread (83 % <250 µm). The unfermented rye crispbread was the only crispbread exhibiting an increase in viscosity over time (Fig. 4). The average final viscosity was 388, 97 and 40 cP for the unfermented rye crispbread, sourdough-fermented rye crispbread and yeast-fermented refined wheat crispbread, respectively. The viscosity of the unfermented rye crispbread was significantly higher than that of the two other crispbreads (P<0·001). Peaks in the viscosity curve were observed for all samples but most frequently and for the longest time for the unfermented rye crispbread (Fig. 4). The peaks are likely caused by bolus fragments, which cannot pass between the impeller and the sample cylinder wall (>2 mm in size) and therefore get caught between the baffles and the impeller.
Discussion
This study evaluated the effects of sourdough fermentation of whole grain rye crispbread on appetite and postprandial glucose, insulin and total GLP-1 response when consumed as part of a complete breakfast. Sourdough-fermented rye crispbread led to higher satiety than yeast-fermented refined wheat crispbread, whereas unfermented rye crispbread induced lower insulin response than the other two crispbread types. Overall responses were weaker in the present study of young, healthy participants compared with our previous study with older healthy volunteers( Reference Johansson, Lee and Risérus 16 ). To our knowledge, no previous study has compared unfermented with sourdough-fermented rye products on glycaemia or appetite, despite the general perception by consumers that sourdough fermentation leads to healthier products( Reference Dewettinck, Van Bockstaele and Kuhne 33 ). Consumption of whole grain rye compared with refined products has repeatedly been shown to increase satiety, an effect attributed to differences in the fibre content( Reference Clark and Slavin 43 ) and changes in colonic fermentation( Reference Ibrügger, Vigsnæs and Blennow 44 , Reference Joyce and Gahan 45 ). Colonic fermentation, indirectly measured through breath hydrogen, has been observed as early as 4 h after consumption of rye porridge( Reference Isaksson, Tillander and Andersson 14 , Reference Lee, Shi and Webb 46 ). In this study, subjective satiety was registered for 6 h after breakfast and colonic fermentation might therefore have contributed to satiety in the later stages. Sourdough fermentation has been associated with higher solubility of dietary fibre and protein in wheat breads( Reference Lappi, Selinheimo and Schwab 29 ) and reduced molecular weight of arabinoxylans and β-glucans in whole grain rye bread( Reference Andersson, Fransson and Tietjen 10 ). Higher solubility and lower molecular weight of dietary fibres could increase their fermentability in the colon, which may contribute to increased satiety. Moreover, organic acids typically produced during sourdough fermentation could affect satiety. Increased satiety has been demonstrated after intake of bread supplemented with sodium propionate( Reference Liljeberg and Björck 47 ) and after intake of wheat breads supplemented with acetic acid( Reference Östman, Granfeldt and Persson 24 , Reference Liljeberg and Björck 25 ). However, a study with propionate-rich sourdough bread did not demonstrate any influence on appetite and food intake, indicating that the salt form is required for an effect( Reference Darzi, Frost and Robertson 48 ). With regard to acetic acid, the amounts generated in the sourdough-fermented rye crispbread used in the present study was very low (0·02–0·06 g/100 g crispbread) compared with the amounts (approximately 1·1–1·7 g/serving) used by Östman et al.( Reference Östman, Granfeldt and Persson 24 ), who observed an effect on satiety. Most likely the amounts of acetic acid in the sourdough-fermented rye crispbread was insufficient to affect satiety. Although the participants were not informed about the differences between the breads, they could be distinguished by appearance and taste, which could affect satiety. Although more palatable foods can increase the intake during a meal, it does not appear to influence satiety after intake of a standardised meal( Reference De Graaf, De Jong and Lambers 49 ). However, the expected satiating capacity of a food can influence the actual satiety( Reference Brunstrom, Brown and Hinton 50 ). It is possible that the taste and appearance of the sourdough-fermented rye crispbread lead to higher expected satiety by the participants and contribute to the differences in appetite rating.
Organic acids produced during sourdough fermentation have also been shown to affect glucose and insulin responses when added in high concentrations to model breads( Reference Östman, Nilsson and Liljeberg Elmståhl 23 , Reference Liljeberg and Björck 25 , Reference Liljeberg and Björck 47 ). Interestingly, the sourdough-fermented rye crispbread did not reduce postprandial insulin response compared with the control either in the present or in a previous study( Reference Johansson, Lee and Risérus 16 ). In contrast, unfermented rye crispbread resulted in a lower insulin response compared with sourdough-fermented rye crispbread and the control. The lack of a beneficial effect caused by the sourdough fermentation may be because of too low concentrations of lactic acid in the sourdough-fermented rye crispbread used in the present study. Liljeberg et al.( Reference Liljeberg, Lönner and Björck 21 ) demonstrated an effect on glucose and insulin but had a higher concentration, approximately 18 mmol lactic acid/100 g bread (dry weight), compared with 7·7 mmol/100 g crispbread (dry weight) in the present study. The effect of lactic acid on glucose and insulin responses has been suggested to be due to increased interactions between gluten and starch, slowing down starch hydrolysis during digestion and not the lactic acid per se ( Reference Östman, Nilsson and Liljeberg Elmståhl 23 ). As there is no gluten network formed in the rye crispbreads, this effect would not be expected and could explain the lack of effect of sourdough fermentation in the present study.
Slower disintegration of the structure and higher digesta viscosity of unfermented rye crispbread may contribute to the lower insulin response observed compared with the two other crispbreads tested in the present study. The viscosity curve of the unfermented rye crispbread stabilised more slowly, with peaks in the curve occurring up to 90 min during simulated gastric digestion. These peaks are most likely because of the presence of bolus fragments, with a size above 2 mm, which may indicate higher cohesiveness of the bolus and slower disintegration during simulated gastric digestion for the unfermented rye crispbread. Solid foods are considered to be emptied from the stomach first when reaching a particle size below 1–2 mm( Reference Hellström, Grybäck and Jacobsson 51 ). A more cohesive bolus, which disintegrates slower in the gastric compartment, could then lead to starch becoming available for hydrolysis in the small intestine at a lower rate.
The composition, rather than the amount, of fibre has also been suggested as a factor responsible for the observed effects on insulin response( Reference Johansson, Lee and Risérus 16 ). A previous study has shown reduced arabinoxylan and β-glucan molecular weight as a result of fermentation of rye products, including crispbread( Reference Rakha, Åman and Andersson 31 ). Reduced molecular weight or lower fibre extractability may lead to higher diffusion rates in the digesta, resulting in increased rates of hydrolysis and absorption of starch( Reference Shelat, Vilaplana and Nicholson 52 ). Furthermore, digesta viscosity may be lowered leading to increased gastric emptying( Reference Marciani, Gowland and Spiller 53 ). Although the effects on molecular weight distribution of arabinoxylan in the rye crispbreads tested here are unknown, β-glucan in the sourdough-fermented crispbread was degraded and degradation of arabinoxylans most likely also occured( Reference Andersson, Fransson and Tietjen 10 ). This is also supported by the apparently more degraded fibres, as observed in the confocal laser scanning microscope (CLSM) micrographs (Fig. 1), compared with the unfermented rye crispbread. The simulated digesta viscosity of sourdough-fermented rye crispbread was also lower than that of unfermented rye crispbread.
Furthermore, a combination of a lower rate of disintegration, higher viscosity and the presence of larger particles in the final in vitro digesta for the unfermented rye crispbread could have contributed to a slower rate of glucose absorption and, subsequently, lower insulin response.
Specific features of rye foods, such as dense structure and the presence of an amylose layer surrounding the starch granules, have been suggested to be related to a slower rate of starch hydrolysis( Reference Juntunen, Laaksonen and Autio 19 ). Although leaked amylose was observed in the rye crispbreads used in the present study, it did not form a layer in the same manner as previously observed in soft rye breads( Reference Juntunen, Laaksonen and Autio 19 ) and, with regard to this, there was no observable difference between the rye crispbreads that could explain the differences in insulin response.
Interestingly, the lower insulin response after unfermented rye crispbread was not related to total GLP-1 concentrations, which did not differ between the treatments. In previous studies, GLP-1 strongly responds to glucose and fat( Reference Elliott, Morgan and Tredger 54 – Reference Lim and Bruebaker 56 ). In a mixed meal consisting of liquid and solids, liquid is preferentially emptied first( Reference Phillips and Powley 57 ). Early absorption of sugars provided by the juice in the standardised breakfast used here (25 % of total carbohydrates) or fat provided by the cheese or butter may therefore have attenuated differences in GLP-1, as well as early insulin and glucose responses between treatments. Higher satiety after rye consumption in the present study can be attributed to the palatability of the products, which could be a potential reason for observed differences in subjective appetite ratings. An argument in favour of this suggestion is the fact that the differences in appetite ratings were observed earlier than eventual fermentation effects would have occurred. Differences at the later stages would suggest the influence of other gut hormones such as peptide YY.
The strengths of the present study include its cross-over design, appropriate sample size and relatively homogenous population. Such a design greatly reduces the eventual effects of confounding covariates because each subject serves as its own control. Additional strengths include the fact that measures were conducted over a fairly long duration (0–230 min), in order to pick up both early effects (which could be influenced by rapidly absorbed organic acids and by palatability) and later effects (influenced by colonic fermentation). Furthermore, the unfermented rye crispbread was tested as a positive control and both in vivo and in vitro experiments were included in the present study. Finally, we included both subjective (VAS) and physiological (GLP-1) measures of appetite.
Despite these strengths, our study has some limitations. First, all participants in the study were at a young age, and thus our findings need to be confirmed in the older population. The fact that participants have not been screened for restrained eating can also be seen as a study limitation, as eating style may have an impact on appetite perception. However, we believe that in the cross-over design, which was used in our study, this effect is minimal if any. A second limitation is that we did not measure concentrations of other than GLP-1 gut hormones, which might have an effect on appetite rating (such as peptide YY). Third, we did not measure actual energy intake and how it corroborated with reported appetite scores. The fact that the study was designed as single-blind can also be seen as a study limitation. A double-blind design may provide unbiased assessment. However, a double-blind design was not possible because of the obvious differences in crispbread appearances. Finally, this acute single-meal challenge was performed in well-controlled conditions, and chronic and free-living effects were not investigated.
In summary, the results from the present study suggest that sourdough-fermented bread may have beneficial effects on self-rated appetite but no beneficial effects on either postprandial glycaemia or insulinaemia or total GLP-1 concentrations. Rather, unfermented rye crispbread with less disintegrated food structure had more beneficial effects on postprandial insulin response compared with its sourdough-fermented counterpart and, as shown previously, compared with yeast-fermented refined wheat crispbread( Reference Johansson, Lee and Risérus 16 ). This may be related to increased digesta viscosity and possibly slower rate of bolus disintegration. Our results clearly show that food processing affects the composition and structural characteristics of rye bread, which has implications for appetite and metabolic responses. Future studies are needed to investigate a potential role of other commonly used processes on appetite and metabolic responses. The long-term implication of such effects should also be investigated in relation to clinical risk factors in different populations.
Acknowledgements
The authors thank Barilla for products and for financial support to carry out this intervention study. The authors thank all participants for their outstanding contribution to the study and the nurses for great help with sampling, particularly Catarina Lövgren for coordination. Furthermore, the authors would like to thank Janicka Nilsson for excellent technical assistance, Gunnel Fransson for fibre analysis and José Vázquez-Gutiérrez for the CLSM micrographs.
R. L. holds a research grant from Barilla for funding the present study. None of the authors received salary or any other financial compensation for conducting the present study or for any other purposes. Barilla did not get access to data or participated in data analysis, interpretation or manuscript writing.
G. Z. performed statistical analysis and drafted the manuscript; D. P. J. was responsible for simulated gastric digestion and microscopy analysis, and co-wrote the manuscript; M. A. J. and L. D. performed chemical analysis (GLP-1); M. L. supervised simulated gastric digestion and microscopy analysis; P. M. H. conducted screening and had the overall medical responsibility of the trail; R. L. conceived and designed the study and had the overall responsibility as principle investigator. All authors contributed to the interpretation of the data and all critically evaluated the manuscript before submission. All authors read and approved the final manuscript.
There were no other actual or potential conflicts of interests.


