


Conjugated linoleic acids (CLA) are a group of positional and geometric isomers of linoleic acid (LA; cis-9, cis-12-18 : 2) characterised by the presence of conjugated double bounds with cis or trans configuration. Some CLA isomers have demonstrated interesting biological effects such as anti-carcinogenic, anti-adipogenic, anti-atherogenic or anti-obesity properties(Reference Benjamin and Spener1, Reference Churruca, Fernandez-Quintela and Portillo2). In contrast, in certain conditions, some CLA isomers can also exert potentially negative effects such as insulin resistance and steatosis(Reference Clément, Poirier and Niot3–Reference Stout, Liu and Belury5). In humans, the main dietary sources of CLA are dairy products and meat derived from ruminant animals. The main CLA isomer found in these products is the isomer cis-9, trans-11-18 : 2, called rumenic acid (representing 75 to 90 % of total CLA found in dairy products)(Reference Chin, Liu and Storkson6).
CLA isomers are intermediates of the biohydrogenation pathway of LA carried out by rumen bacteria, leading finally to a SFA, stearic acid (18 : 0)(Reference Jenkins, Wallace and Moate7–Reference Chilliard, Glasser and Ferlay9). It has been proposed that bacterial reduction of PUFA is a mechanism of protection against the toxicity of PUFA. Indeed, some PUFA prevent bacterial growth(Reference Coakley, Ross and Nordgren10, Reference Maia, Chaudhary and Bestwick11). The biohydrogenation pathway also leads to the production of other intermediates among which vaccenic acid (trans-11-18 : 1) is the most important. All biohydrogenation intermediates can partly escape from the rumen and be absorbed later in the ruminant intestine. Once in the animal tissues, they can be stored or further metabolised. Vaccenic acid (trans-11-18 : 1) can notably be desaturated into rumenic acid (cis-9, trans-11-18 : 2 CLA) through the activity of a Δ-9 desaturase enzyme (also called stearoyl-CoA desaturase-1; SCD-1)(Reference Griinari, Corl and Lacy12–Reference Santora, Palmquist and Roehrig14).
The vast number of micro-organisms (1014 bacteria) in the human gut creates a large metabolic potential to take into account in host physiology(Reference Cani and Delzenne15). Based on the biohydrogenation pathway observed in the rumen, some authors have proposed a similar pathway occurring in mammalian gut microbiota(Reference Devillard, McIntosh and Duncan16, Reference McIntosh, Shingfield and Devillard17). Furthermore, several arguments support a role of the gut microbiota in the endogenous production of CLA isomers. First, in vitro experiments have shown that several gut bacteria isolated from rodents or humans are able to metabolise LA into CLA isomers and vaccenic acid(Reference Barrett, Ross and Fitzgerald18). The three major genera including bacteria able to produce CLA and vaccenic acid in mice gut are Bifidobacteria spp.(Reference Coakley, Ross and Nordgren10, Reference Rosberg-Cody, Ross and Hussey19), Lactobacillus spp.(Reference Lee, Park and Seok20) and Roseburia spp.(Reference McIntosh, Shingfield and Devillard17). Second, the enzyme able to transform LA into CLA isomers, called linoleate isomerase, was sequenced in some Lactobacillus (Reference Macouzet, Robert and Lee21) and Bifidobacterium strains(Reference Macouzet, Lee and Robert22), two bacterial genera found in the gut microbiota. Third, Wall et al. (Reference Wall, Ross and Shanahan23) have shown that the fatty acid composition in host tissues was modified (including an increase of rumenic acid; cis-9, trans-11-18 : 2 CLA) after co-administration of a probiotic strain (Bifidobacterium breve) and LA in mice. Finally, another interesting study showed that increasing the amount of LA in the diet increased the tissue content of CLA isomers in conventional rats (with a normal gut microbiota) but not in germ-free rats (lacking gut microbiota)(Reference Chin, Storkson and Liu24).
Alterations in the composition and/or activity of gut microbiota – known as dysbiosis – has been proposed to contribute to the development of obesity and associated metabolic disorders including low-grade inflammation, diabetes and dyslipidaemia(Reference Delzenne, Neyrinck and Backhed25). We have previously shown that a high-fat (HF) diet leading to obesity and diabetes changes gut bacterial composition(Reference Cani, Neyrinck and Fava26–Reference Neyrinck, Possemiers and Druart29). The interactions between gut microbiota and host are, at least in part, mediated by metabolites produced by gut microbes. For example, metabolites such as SCFA – mainly produced during the fermentation of non-digestible carbohydrates by saccharolytic bacteria – are able to be used both as metabolic substrates and regulators in host tissues(Reference Samuel, Shaito and Motoike30, Reference Neish31). In the present studies, we postulated that CLA isomers endogenously produced upon metabolic cooperation between the gut microbiota and host intestinal and liver tissues can be a new kind of metabolites susceptible to regulate host metabolism.
Prebiotics are non-digestible carbohydrates allowing ‘the selective stimulation of growth and/or activity(ies) of one or a limited number of microbial genus(era)/species in the gut microbiota that confer(s) health benefits to the host’(Reference Roberfroid, Gibson and Hoyles32). Several studies have repeatedly shown that inulin-type fructans (ITF), non-digestible carbohydrates extracted from chicory root, are able to counteract obesity (diet or genetic induced) in rodents(Reference Cani, Dewever and Delzenne33–Reference Cani, Possemiers and Van de Wiele37). On the other hand, arabinoxylans (Ax) are the most important non-digestible carbohydrates present in wheat and represent a new class of potential prebiotics(Reference Neyrinck and Delzenne38). We have recently shown that the supplementation of either ITF or a concentrate of water-extractable high-molecular-weight Ax in the diet counteracted HF-induced gut dysbiosis together with an improvement in obesity(Reference Dewulf, Cani and Neyrinck28, Reference Neyrinck, Possemiers and Druart29). We decided to treat mice with a HF diet and prebiotics (ITF or Ax) in order to evaluate the potential impact of these nutritional modulations of gut bacterial composition on fatty acid profile and in particular CLA isomer profile in the target host tissues (intestines and liver).
Experimental methods
Animals and diets
We performed two experiments using the same conditions. Male C57bl6/J mice (Charles River Laboratories) aged 9 weeks at the beginning of the experiments were housed in a controlled environment (12 h daylight cycle, lights off at 18.00 hours) with free access to diet and water. After 1 week of acclimatisation, the mice were separated into three groups (eight mice per group; four mice per cage). In the first experiment, mice were fed either with a control (CT) diet (AO4; SAFE) or a HF diet (D12492; Research Diets) or the HF diet and a supplementation of inulin-type fructans (ITF; 0·2 g/d per mouse of oligofructose provided by Orafti). In the second experiment, mice were fed either with the CT diet (AO4; SAFE), or the HF diet (D12492; Research Diets) or the HF diet and a supplementation of arabinoxylans (Ax; 0·2 g/d per mouse of Naxus provided by BioActor). Dietary treatments lasted for 4 weeks. Food intake was recorded taking into account spillage twice per week. The HF diet contained 60 % lipids, 20 % proteins and 20 % carbohydrate as energy content. The HF diet provided (per 100 g): 35 g fat (soyabean oil and lard), 9 g sucrose, 16 g maltodextrin, 26 g proteins and 6·5 g cellulose (according to the manufacturer's information). We analysed the fatty acid profile of the CT diet and HF diet by GC–flame ionisation detector (see Table 1). All mouse experiments were approved by and performed in accordance with the guidelines of the local ethics committee. Housing conditions were specified by the Belgian Law of 6 April 2010 regarding the protection of laboratory animals (agreement no. LA1230 314).
Table 1 Fatty acid profile of the standard AO4 (control; CT) diet and the high-fat (HF) diet (g fatty acid/kg diet)
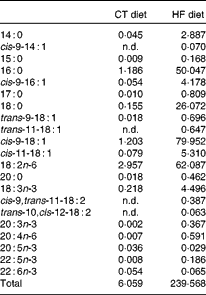
n.d., Not detectable, below the level of detection.
Tissue samples
After 4 weeks of treatment and a 6 h period of fasting, mice were anaesthetised by intraperitoneal injection of ketamine (100 mg/kg; Anesketin; Eurovet) and xylazine (10 mg/kg; Rompun; Bayer Belgium). The liver, colon and caecum were carefully collected and frozen in liquid N2 before storage at − 80°C. The caecal content was collected and frozen for further microbial analysis. Data related to body weight, body weight gain and tissue weights are presented in Supplemental Table 1.
Fat-binding capacity analysis
The fat-binding capacity (FBC) of ITF and Ax was analysed according to an in vitro method of lipid adsorption described by No et al. (Reference No, Lee and Park39). We tested in parallel starch as a negative control and chitosan (KiOnutrime-Cs™; KitoZyme S.A.) as a positive control.
Gut microbiota analysis
To study the gut microbiota composition, the QIAamp DNA stool mini kit (Qiagen) was used according to the manufacturer's instructions to extract the metagenomic DNA from the caecal content of all mice. To analyse the quantitative effect of the different treatments on the composition of the gut microbiota, quantitative PCR (qPCR) was performed. qPCR for total bacteria and specific qPCR for Bifidobacterium spp., Lactobacillus spp. and Roseburia spp. were performed as reported previously(Reference Dewulf, Cani and Neyrinck28, Reference Neyrinck, Possemiers and Druart29, Reference Possemiers, Bolca and Grootaert40). All qPCR were performed with an ABI PRISM SDS 7000 Sequence Detection System (Applied Biosystems). The statistical analysis was performed on logarithmic values.
Fatty acid profile analysis
To determine the fatty acid profile in tissues or diet, 100 mg of liver tissue or diet or 75 mg of caecal tissue were homogenised in a methanol–chloroform mixture (1:2, v/v). Homogenates were filtered with Whatman filters no. 1 (porosity 10 μm). The filters were rinsed with 2 ml chloroform and 1 ml methanol. Homogenates were purified successively with KCl (0·88 %) and KCl (0·88 %)–methanol (1:1, v/v). After centrifugation (1500 g, 5 min), the chloroform phase was collected in new tubes and then evaporated under a N2 flux.
The fatty acids were then subjected to an alkaline hydrolysis. For that purpose, a solution of KOH in methanol was added and incubated at 70°C for 2 h (saponification of lipids). The fatty acids were methylated as follows: 0·4 ml HCl in methanol (1·2 m) was added in the tube and incubated at 70°C for 20 min. Fatty acid methyl esters (FAME) were then extracted with hexane.
Quantification of FAME was made by GLC (GC Trace ThermoQuest; Thermo-Finnigan). The chromatograph was equipped with a flame ionisation detector, automatic injector and a fused silica capillary column (length 100 m; inside diameter 0·25 mm; film thickness 0·20 μm) coated with a film of biscyanopropyl polysiloxane (RT-2560; Restek) using H2 as the carrier gas at a constant pressure of 200 kPa. The initial oven temperature was 80°C, increased at 25°C/min to 175°C (held for 25 min), then increased at 10°C/min to 205°C (held for 4 min), then increased at 10°C/min to 225°C (held for 20 min) and finally decreased at 20°C/min to 80°C. The temperature of the flame ionisation detector was maintained at 255°C. H2 flow to the detector was 35 ml/min, and airflow was 350 ml/min. The identification and the quantification of each peak were made by comparison of retention times with pure FAME standards (Alltech Associates; except CLA isomers from Nu-Chek Prep).
Real-time quantitative PCR
Total RNA was extracted from the liver and colon using the TriPure isolation reagent (Roche Diagnostics Belgium). cDNA was prepared by reverse transcription from 1 μg of total RNA using the Kit Reverse Transcription System (Promega). Real-time PCR was performed with the SetpOnePlusTM real-time PCR system and software (Applied Biosystems) using SYBR-Green (Mesa Fast qPCR™; Eurogentec) for detection. Ribosomal protein L19 (RPL19) RNA was chosen as the housekeeping gene to normalise the data, and further analysed according to the 2− ΔΔC T method(Reference Livak and Schmittgen41).
Statistical analysis
Results are presented as mean values with their standard errors. Statistical significance of difference between groups was assessed by one-way ANOVA followed by Tukey's post hoc multiple comparison test (GraphPad Prism Software). P< 0·05 was considered as statistically significant. Values with unlike superscript letters are significantly different (P< 0·05) according to Tukey's post hoc ANOVA statistical analysis.
Results
Modulation of number of conjugated linoleic acid-producing bacteria in caecal content by high-fat diet and additional prebiotic treatments
In both experiments, the HF diet decreased the number of CLA-producing bacteria, calculated as the sum of the three most cited genera able to produce CLA (Bifidobacterium spp., Roseburia spp., Lactobacillus spp.) (Table 2). Prebiotic supplementations counteracted the HF diet-induced decrease of CLA-producing bacteria: ITF supplementation restored the number of CLA-producing bacteria to the CT level whereas following Ax supplementation, the number of CLA-producing bacteria increased but did not reach the CT value (Table 2). The bacterial genera modulated by each prebiotic were different (Table 2). ITF and Ax both increased Bifidobacterium spp. compared with the HF diet, but the bifidogenic effect of ITF was more important than the one of Ax. ITF decreased Roseburia spp. and Lactobacillus spp. compared with the HF diet, whereas Ax increased Roseburia spp. without modification of Lactobacillus spp. compared with the HF diet. It is worth noting that prebiotic supplementations did not change the number of total caecal bacteria compared with HF groups (Table 2).
Table 2 Gut microbiota analysis in the caecal content of mice after 4 weeks of dietary treatment* (Mean values with their standard errors)
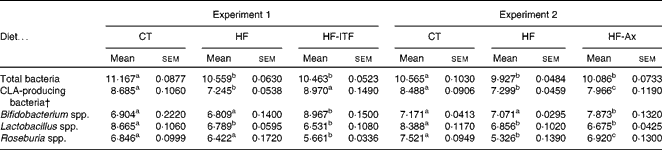
CT, control; HF, high-fat; HF-ITF, high-fat diet supplemented with inulin-type fructans; HF-Ax, high-fat diet supplemented with arabinoxylans; CLA, conjugated linoleic acids.
a,b,c Mean values within a row with unlike superscript letters were significantly different (P< 0·05; Tukey's post hoc ANOVA statistical analysis).
* Quantities of bacteria are expressed as log10 (DNA copies/total caecal content).
† CLA-producing bacteria represent the counts of bacterial groups typically associated with CLA production. This number of CLA-producing bacteria was calculated as follows (log10 (sum of Bifidobacterium spp., Lactobacillus spp. and Roseburia spp.)).
Modulation of profile of bacterial derived n-6 PUFA in the liver by high-fat diet and additional prebiotic treatments
In the caecal tissue and in the liver, changes in LA (cis-9, cis-12-18 : 2), rumenic acid (cis-9, trans-11-18 : 2 CLA) and vaccenic acid (trans-11-18 : 1), the three major fatty acids of the linoleic biohydrogenation pathway, occurred upon dietary manipulation. The amount of total fatty acids, LA (cis-9, cis-12-18 : 2) and n-6 PUFA metabolites (including bacterial derived metabolites) are presented in Fig. 1 (liver tissue) and Fig. 2 (caecal tissue).
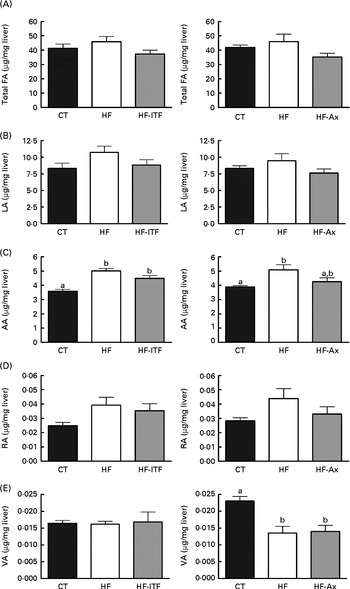
Fig. 1 Total fatty acids (FA) (A), linoleic acid (LA; 18 : 2n-6) (B) and n-6 PUFA metabolites arachidonic acid (AA; 20 : 4n-6) (C), rumenic acid (RA; cis-9, trans-11-18 : 2) (D) and vaccenic acid (VA; trans-11-18 : 1) (E) in the liver tissue of mice after 4 weeks of dietary treatment: control (CT) diet; high-fat (HF) diet; or HF diet supplemented with inulin-type fructans (HF-ITF) or arabinoxylans (HF-Ax). Values are means, with their standard errors represented by vertical bars. a,bMean values with unlike letters were significantly different (P< 0·05; Tukey's post hoc ANOVA statistical analysis).
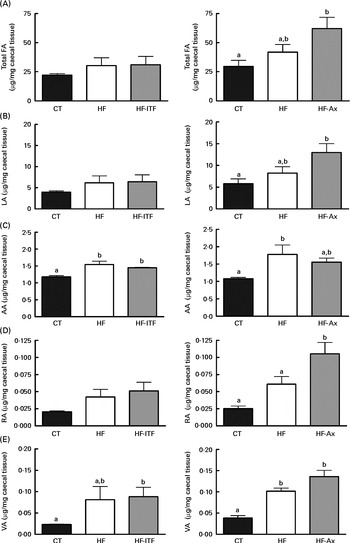
Fig. 2 Total fatty acids (FA) (A), linoleic acid (LA; 18 : 2n-6) (B) and n-6 PUFA metabolites arachidonic acid (AA; 20 : 4n-6) (C), rumenic acid (RA; cis-9, trans-11-18 : 2) (D) and vaccenic acid (VA; trans-11-18 : 1) (E) in the caecal tissue of mice after 4 weeks of dietary treatment: control (CT) diet; high-fat (HF) diet; or HF diet supplemented with inulin-type fructans (HF-ITF) or arabinoxylans (HF-Ax). Values are means, with their standard errors represented by vertical bars. a,bMean values with unlike letters were significantly different (P< 0·05; Tukey's post hoc ANOVA statistical analysis).
In the liver, we observed (in both experiments) the presence of rumenic acid (cis-9, trans-11-18 : 2 CLA) and vaccenic acid (trans-11-18 : 1) in the CT groups, despite the fact that these fatty acids were undetectable in the CT diet (Table 1). The hepatic total fatty acids and LA (cis-9, cis-12-18 : 2) contents were not significantly modified in the HF groups compared with the CT groups, whereas HF diet feeding increased arachidonic acid (20 : 4n-6) and tended to increase rumenic acid (cis-9, trans-11-18 : 2 CLA) (Fig. 1 and Supplemental Table 2). Regarding vaccenic acid (trans-11-18 : 1), its content was not modified by the HF diet in the first experiment whereas it decreased in the second experiment (Fig. 1 and Supplemental Table 2). Concerning the n-3 PUFA profile, the HF diet did not significantly change α-linolenic acid (α-LnA; 18 : 3n-3), docosapentaenoic acid (DPA; 22 : 5n-3) and DHA (22 : 6n-3) contents but decreased EPA (20 : 5n-3) (Fig. 3).
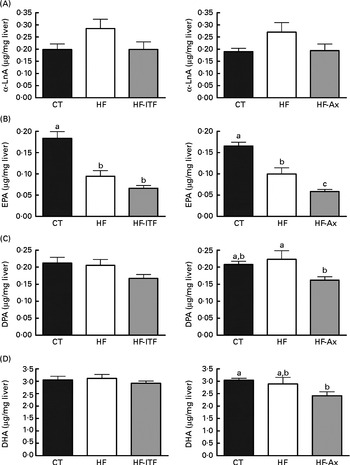
Fig. 3 α-Linolenic acid (α-LnA; 18 : 3n-3) (A) and n-3 PUFA metabolites EPA (20 : 5n-3) (B), docosapentaenoic acid (DPA; 22 : 5n-3) (C) and DHA (22 : 6n-3) (D) in the liver tissue of mice after 4 weeks of dietary treatment: control (CT) diet; high-fat (HF) diet; or HF diet supplemented with inulin-type fructans (HF-ITF) or arabinoxylans (HF-Ax). Values are means, with their standard errors represented by vertical bars. a,b,cMean values with unlike letters were significantly different (P< 0·05; Tukey's post hoc ANOVA statistical analysis).
Prebiotic supplementations (both ITF and Ax) had no significant effect on total fatty acids and the n-6 PUFA profile compared with the HF diet but induced changes in the n-3 profile. The level of EPA (20 : 5n-3), DPA (22 : 5n-3) and DHA (22 : 6n-3) was not modified by ITF supplementation whereas Ax supplementation decreased EPA (20 : 5n-3) and DPA (22 : 5n-3) and tended to decrease DHA (22 : 6n-3) compared with HF diet feeding (Fig. 3).
Modulation of profile of bacterial derived n-6 PUFA in the caecum by high-fat diet and additional prebiotic treatments
In the caecal tissue, as observed in the liver, we detected and quantified rumenic acid (cis-9, trans-11-18 : 2 CLA) and vaccenic acid (trans-11-18 : 1) in the CT groups (Fig. 2). Regarding the modifications of the n-6 PUFA profile by HF diet feeding and prebiotic supplementations, we observed different effects between experiments 1 and 2.
In experiment 1, HF diet feeding did not significantly change total fatty acids, LA (cis-9, cis-12-18 : 2) and rumenic acid (cis-9, trans-11-18 : 2 CLA) content, but HF diet feeding increased the arachidonic acid (20 : 4n-6) content (produced in host tissue from LA) and the vaccenic acid (trans-11-18 : 1) content (a bacterial metabolite of LA) (Fig. 2). Furthermore, ITF supplementation had no additional effects compared with the ones observed following HF diet feeding, except that the relative proportion of rumenic acid (cis-9, trans-11-18 : 2 CLA) (expressed as percentage of the total fatty acids identified) was increased by ITF compared with the HF diet (P= 0·05; t test) (Supplemental Table S3).
In experiment 2, HF diet feeding tended to increase total fatty acids and LA (cis-9, cis-12-18 : 2) contents compared with the CT diet (Fig. 2). Both contents in the HF group were 1·4-fold higher than the contents measured in the CT group. HF diet feeding significantly increased vaccenic acid (trans-11-18 : 1) content compared with the CT diet (Fig. 2). HF diet feeding did not significantly change the absolute content of rumenic acid (cis-9, trans-11-18 : 2 CLA) but significantly increased the relative proportion of rumenic acid (cis-9, trans-11-18 : 2 CLA) (results expressed as a percentage of the total fatty acids identified) (Supplemental Table S3). Total fatty acids and LA (cis-9, cis-12-18 : 2) content increased upon Ax supplementation (Fig. 2). The level in the HF-Ax group was 1·5 times higher than the amount measured in the HF group and two times higher than the amount measured in the CT group. Ax supplementation increased the rumenic acid (cis-9, trans-11-18 : 2 CLA) content (absolute content and relative proportion) compared with both the CT and HF groups (Fig. 2 and Supplemental Table S3). Ax supplementation had no additional effect on the vaccenic acid (trans-11-18 : 1) content compared with the effect observed upon HF diet feeding.
In addition to the changes observed in the n-6 PUFA profile, the n-3 PUFA profile was also modified after the different dietary treatments (Fig. 4). α-LnA (18 : 3n-3) content tended to be increased after HF diet feeding. The level in the HF group was about 2-fold higher than the amount measured in the CT group in both experiments. We also observed changes in the level of long- and very-long chain n-3 PUFA, consisting of a decreased EPA (20 : 5n-3) content and an increased DPA (22 : 5n-3) content following HF diet feeding whereas DHA (22 : 6n-3) content was not modified upon HF diet feeding (Fig. 4). ITF supplementation had no additional effect on the n-3 PUFA profile (α-LnA, EPA, DPA and DHA) compared with HF diet feeding (Fig. 4). Ax supplementation further increased α-LnA (18 : 3n-3) acid content, this increase appearing significant as compared with the CT group (Fig. 4). Ax supplementation had no additional effect on EPA (20 : 5n-3) content but it decreased the relative proportion of DPA (22 : 5n-3) and DHA (22 : 6n-3) compared with HF diet feeding (Supplemental Table 3).
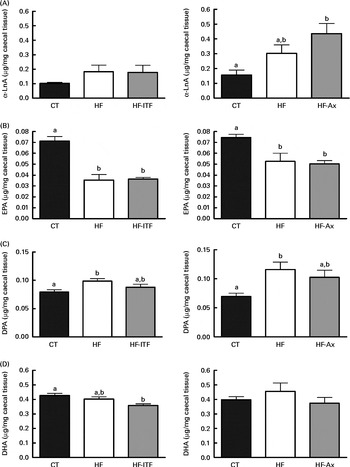
Fig. 4 α-Linolenic acid (α-LnA; 18 : 3n-3) (A) and n-3 PUFA metabolites EPA (20 : 5n-3) (B), docosapentaenoic acid (DPA; 22 : 5n-3) (C) and DHA (22 : 6n-3) (D) in the caecal tissue of mice after 4 weeks of dietary treatment: control (CT) diet; high-fat (HF) diet; or HF diet supplemented with inulin-type fructans (HF-ITF) or arabinoxylans (HF-Ax). Values are means, with their standard errors represented by vertical bars. a,bMean values with unlike letters were significantly different (P< 0·05; Tukey's post hoc ANOVA statistical analysis).
Effect of high-fat diet feeding and additional prebiotic treatments supplementation on stearoyl-CoA desaturase-1 mRNA expression and activity in the liver and caecal tissue
We observed changes in the rumenic acid (cis-9, trans-11-18 : 2 CLA) content in the caecal tissue and in the liver after HF diet feeding. Rumenic acid (cis-9, trans-11-18 : 2 CLA) may be produced directly by bacteria, or indirectly in host tissues from vaccenic acid (trans-11-18 : 1). In order to evaluate the contribution of host metabolism to the changes in rumenic acid (cis-9, trans-11-18 : 2 CLA) content observed in the caecal tissue and in the liver, we measured SCD-1 mRNA expression and estimated its activity in intestinal segments and in the liver. The expression of SCD-1 mRNA was at least 20-fold higher in the liver than in the different intestinal segments (data not shown). As shown in Table 3, SCD-1 mRNA expression was decreased by the HF diet in the liver and the colon tissue in both experiments. Both prebiotic supplementations had no major effect on SCD-1 mRNA expression in the liver and in the colon compared with the HF diet, except that Ax further decreased mRNA expression in the liver compared with the HF diet.
Table 3 Stearoyl-CoA desaturase-1 (SCD-1) mRNA expression and activity in the liver and intestinal tissues of mice after 4 weeks of dietary treatment* (Mean values with their standard errors)
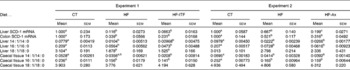
CT, control; HF, high-fat; HF-ITF, high-fat diet supplemented with inulin-type fructans; HF-Ax, high-fat diet supplemented with arabinoxylans.
a,b,c Mean values within a row with unlike superscript letters were significantly different (P< 0·05; Tukey's post hoc ANOVA statistical analysis).
* SCD-1 activity was estimated by calculation of the ‘desaturation ratio’, the ratio between the MUFA produced by the SCD-1 and their respective SFA, the substrate of the SCD-1.
In order to strengthen the SCD-1 mRNA expression results, we also estimated the SCD-1 activity by calculating ‘desaturation ratios’. In both experiments, HF diet feeding decreased the cis-9-14 : 1/14 : 0 and cis-9-16 : 1/16 : 0 ratios in the liver and in the caecal tissue whereas the cis-9-18 : 1/18 : 0 ratio was unchanged in these tissues (Table 3). Prebiotic supplementations had no additional effect compared with the effects of the HF diet (Table 3).
Fat-binding capacity of arabinoxylans and inulin-type fructans
As shown in Fig. 5, we obtained a FBC of 150 % for starch used as the negative control and a FBC of 245 % for chitosan used as the positive control. The FBC of ITF was weak (180 %) whereas Ax had a much higher FBC (403 %). This result shows the high FBC of Ax.

Fig. 5 Fat-binding capacity (FBC) of starch (negative control), inulin-type fructans (ITF), arabinoxylans (Ax) and chitosan (positive control). Values are means, with their standard errors represented by vertical bars. a,b,c,dMean values with unlike letters were significantly different (P< 0·05; Tukey's post hoc ANOVA statistical analysis).
Discussion
Gut microbiota composition/activity can influence host physiology(Reference Delzenne, Neyrinck and Backhed25). The gut microbiota interacts with the host in part through the production of metabolites, such as SCFA or bile acid metabolites(Reference Delzenne, Neyrinck and Backhed25). Bacteria can also produce lipophilic metabolites, in particular conjugated isomers of LA (CLA)(Reference Coakley, Ross and Nordgren10, Reference Devillard, McIntosh and Duncan16, Reference Barrett, Ross and Fitzgerald18, Reference Alonso, Cuesta and Gilliland42–Reference Gorissen, Raes and Weckx44) and conjugated isomers of α-LnA(Reference Gorissen, Raes and Weckx44–Reference Park, Cho and Song47). The main objective of our experiments was to study if the gut microbiota modulates the production of CLA in vivo upon HF diet feeding and to evaluate the potential effect of prebiotic supplementations in changing the amount of CLA produced by modulation of the gut microbiota composition/activity.
Although rumenic acid (cis-9, trans-11-18 : 2 CLA) and vaccenic acid (trans-11-18 : 1) were undetectable in the CT diet, these fatty acids were present both in the liver and the caecal tissue of control mice, strongly supporting their ‘endogenous’ production by the gut microbiota through the biohydrogenation pathway of LA. The gut microbiota composition of HF-fed mice was different from CT mice: for instance, the counts of bacterial groups typically associated with CLA production were decreased and this was mostly due to a decrease in Lactobacillus spp. However, the quantity of the substrate (LA; 18 : 2n-6) available for bacterial metabolism is much higher in the HF diet compared with the CT diet (the HF diet contains twenty times more LA than the CT diet). Interestingly, although the counts of CLA-producing bacteria were decreased upon HF diet feeding, we observed an increase in rumenic acid (cis-9, trans-11-18 : 2 CLA) and in vaccenic acid (trans-11-18 : 1) in the caecal tissue. This observation suggests that the quantity of substrate available is the rate-limiting factor for CLA synthesis by gut microbiota in control conditions. One explanation may be that nearly all the fatty acids are absorbed in the jejunum and ileum (proximal part) in the control conditions (CT diet), leading to very small quantities of lipids reaching the caecum. In this way, we can assume that the amount of LA (18 : 2n-6) available for CLA synthesis in the caecum, where bacteria are the most abundant, could be influenced by the dietary fat intake and the absorption capacity of the jejunum–ileum. It is important to consider that the dietary intake of LA (18 : 2n-6) and α-LnA (18 : 3n-3) in humans ranges respectively from 6·8 to 21·6 g/d and from 0·5 to 2·2 g/d according to country and sex(Reference Burdge and Calder48). The absorption efficiency of LA (18 : 2n-6) and α-LnA (18 : 3n-3) is estimated at 96 % of dietary intake, meaning that a quantity ranging from 272 to 864 mg for LA (18 : 2n-6) and from 20 to 88 mg for α-LnA (18 : 3n-3) reaches the caecum each day(Reference Burdge and Calder48). Therefore, a non-negligible quantity of LA (18 : 2n-6) is present in the caecal lumen and is available for bacterial metabolism.
In the present studies, we have regrouped the ‘CLA-producing bacteria’, taking into account the data available from in vitro studies mostly. The three major genera including bacteria able to produce CLA in the mouse gut are Bifidobacteria spp., Lactobacillus spp. and Roseburia spp.(Reference O'Shea, Cotter and Stanton49). The calculation of the number of ‘CLA-producing bacteria’ should be cautiously interpreted. Even if our data suggest that Roseburia spp. could be particularly interesting, we have insufficient knowledge to really claim the link between one group of bacteria and CLA production. In fact, only cultivable bacteria have been tested for their capacity to metabolise LA or α-LnA in vitro. A limited number of bacterial strains have been tested up to now and found to be able to produce CLA as individual strains. Moreover, in complex microbial ecosystems, interactions and competition exist between bacteria, which are not studied upon simple culture conditions in vitro, and would require analysis in complex biosystems mimicking the in vivo situation, or transcriptomic analysis to point out key bacterial functions associated with CLA production.
Wall et al. (Reference Wall, Ross and Shanahan23) have already shown that supplementation of mice with LA (18 : 2n-6) together with Bifidobacterium breve increased rumenic acid (cis-9, trans-11-18 : 2 CLA) content in host tissues compared with supplementation with LA (18 : 2n-6) alone. In our studies, we have shown that a higher content of LA (18 : 2n-6) in the diet without any pre- or probiotic interventions is able to increase LA (18 : 2n-6) availability for bacterial metabolism and is sufficient to observe an increase in rumenic acid (cis-9, trans-11-18 : 2 CLA) content in host tissue(Reference Wall, Ross and Shanahan23). By using a HF diet, in the present studies we showed for the first time in mice that increasing the substrate (LA; 18 : 2n-6) availability for bacterial metabolism increased the proportion of metabolites such as rumenic acid (cis-9, trans-11-18 : 2 CLA) and vaccenic acid (trans-11-18 : 1) in host tissues. Unfortunately, we cannot exclude that the presence of vaccenic acid (trans-11-18 : 1) and rumenic acid (cis-9, trans-11-18 : 2) in the HF diet, probably due to the presence of lard used as an ingredient, contributed to the increased amount of these fatty acids observed in host tissues after HF diet feeding. It would be interesting to perform an analysis of the fatty acid profile in the gut content, namely in the caecal content, in order to evaluate if we could observe a difference in PUFA, CLA and vaccenic acid content after HF diet feeding and/or prebiotic supplementation. Such analysis would give information on the availability of PUFA in the distal part of the gut and would be a strong evidence of PUFA metabolism and CLA production by the gut microbiota.
In order to evaluate the relative contribution of bacterial species in the production of bacterial derived LA metabolites, we added two non-digestible carbohydrates (ITF and Ax) prone to selectively modulate the gut microbiota(Reference Dewulf, Cani and Neyrinck28, Reference Neyrinck, Possemiers and Druart29, Reference Roberfroid, Gibson and Hoyles32, Reference Neyrinck and Delzenne38). Interestingly, we observed that both prebiotic supplementations in the HF diet increased the number of CLA-producing bacteria even if the bacterial genera modulated by each prebiotic were different. Neither prebiotic changed the total number of bacteria and Lactobacillus spp. compared with HF diet feeding. Both prebiotics increased the number of Bifidobacterium spp. compared with HF diet feeding but ITF had a stronger bifidogenic effect than Ax. ITF decreased Roseburia spp. whereas Ax increased this bacterial genus compared with HF diet feeding.
Regarding the effects of prebiotic supplementations on the host tissue fatty acid profiles, we observed that Ax, but not ITF, significantly increased the rumenic acid (cis-9, trans-11-18 : 2 CLA) content and tended to increase the LA (18 : 2n-6) content and vaccenic acid (trans-11-18 : 1) content in the caecal tissue. This difference between the two prebiotic supplementations could be explained by the different modulation of the gut microbiota. Indeed, Roseburia spp., that were increased upon Ax supplementation, possess the highest linoleate isomerase activity and thus the highest capacity to produce CLA and other metabolites of LA(Reference Devillard, McIntosh and Duncan16). In fact, this observation supports the idea that the presence of Roseburia spp. is more important than the presence of Bifidobacterium spp. for CLA production. Another important difference between the two prebiotics used in our studies is their capacity to bind dietary fat. In fact, in vitro data showed that ITF have a weak FBC whereas Ax have a strong FBC. Ax supplementation could thus also promote CLA production by increasing LA (18 : 2n-6) availability in the lower part of the gut. Indeed, we observed that Ax increased total fatty acid, LA (18 : 2n-6) and α-LnA (18 : 3n-3) contents in the caecal tissue compared with HF diet feeding whereas ITF supplementation had no effect on these fatty acid contents.
Even if we observed a higher proportion of rumenic acid (cis-9, trans-11-18 : 2 CLA) and vaccenic acid (trans-11-18 : 1) in the liver following HF diet feeding, the further increase of these two fatty acids upon prebiotic supplementations was observed in the caecum but not in the liver. This observation supports the idea that modulation of the bacterial metabolites of LA is restricted to intestinal tissues, the tissues situated near the production site of CLA. However, we have previously found an increase in rumenic acid (cis-9, trans-11-18 : 2 CLA) in adipose tissue after Ax supplementation, suggesting that the increase in rumenic acid (cis-9, trans-11-18 : 2 CLA) after Ax supplementation is not restricted to intestinal tissue but also concerns tissues situated far from the intestine(Reference Neyrinck, Possemiers and Druart29). In view of this, we postulate that rumenic acid (cis-9, trans-11-18 : 2 CLA) produced by the gut microbiota can have some systemic effects, in addition to the local effects in intestinal tissue. However, due to the rather low increase in vaccenic acid and rumenic acid content in host tissue, the size of the effect attributed to these changes in the fatty acid profile should be interpreted cautiously. Even if the changes in vaccenic acid and rumenic acid content in host tissue are relatively modest, a metabolic effect could be expected since in the cow, a dose as small as 0·05 % of trans-10, cis-12-18 : 2 CLA is able to inhibit the mammary biosynthesis of milk fat by a down-regulation of the enzymes implicated in mammary lipid synthesis(Reference Bauman, Harvatine and Lock50). The challenging question is now to identify whether CLA are produced in the upper part of the gastrointestinal tract and absorbed by the classical route of intestinal fat absorption or if CLA are only produced by the dense gut microbiota situated in the caecum and absorbed by an unidentified mechanism of absorption.
In view of the metabolic pathways known in ruminants(Reference Jenkins, Wallace and Moate7–Reference Chilliard, Glasser and Ferlay9) as well as the data obtained in vitro (Reference Devillard, McIntosh and Duncan16) and in our studies, we propose a mechanism of CLA synthesis in which the gut microbiota and the host are involved in symbiosis (Fig. 6). We know that SCD-1 activity in host tissues can influence the CLA content in these tissues. To identify the relative contribution of gut microbiota metabolism as compared with the host metabolism involved in the CLA content changes, we measured SCD-1 expression and estimated its activity in host tissue. SCD-1 mRNA expression was decreased by the HF diet in the liver and the colon tissue in both experiments.
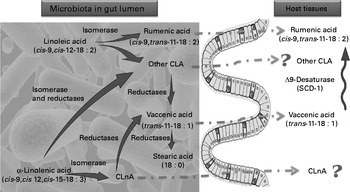
Fig. 6 Proposed mechanism of conjugated linoleic acid (CLA) and conjugated linolenic acid (CLnA) synthesis in mice. Cultivated gut bacteria are able to metabolise α-linolenic acid (cis-9, cis-12, cis-15-18 : 3) into CLnA and linoleic acid (cis-9, cis-12-18 : 2) into CLA through bacterial isomerase activities. Some CLA and CLnA are metabolised into vaccenic acid (trans-11-18 : 1) by one or several bacterial reductases. Metabolic pathways of α-linolenic acid and linoleic acid go further to a SFA (stearic acid; 18 : 0). In our experiments we have shown that rumenic acid (cis-9, trans-11-18 : 2 CLA) and vaccenic acid (trans-11-18 : 1) produced endogenously by the gut microbiota can accumulate in host tissues. However, the absorption and transport mechanisms of these lipophilic bacterial metabolites from the intestinal lumen to the host tissues are completely unknown. In host tissues, vaccenic acid (trans-11-18 : 1) can be desaturated by the Δ-9 desaturase (stearoyl-CoA desaturase-1; SCD-1) into rumenic acid (cis-9, trans-11-18 : 2 CLA). ![]() , Bacterial activity;
, Bacterial activity; ![]() , host activity;
, host activity; ![]() , unknown pathway.
, unknown pathway.
A way commonly used in the literature to estimate the SCD-1 activity is to calculate the ‘desaturation ratio’, which means the ratio between MUFA (myristoleic acid, palmitoleic acid, oleic acid) produced by the SCD-1 and corresponding SFA substrates (myristic acid, palmitic acid and stearic acid, respectively)(Reference Lee, Pariza and Ntambi51, Reference Attie, Krauss and Gray-Keller52). In both experiments, HF diet feeding decreased the cis-9-14 : 1/14 : 0 and cis-9-16 : 1/16 : 0 ratios in the liver and in the caecal tissue but had no effect on cis-9-18 : 1/18 : 0 in these tissues. Prebiotic supplementations had no additional effect compared with the effects of the HF diet. In general, HF diet feeding decreased SCD-1 mRNA expression and activity in the liver and in the caecal tissue without major effect of the prebiotic supplementation. Thus, the higher rumenic acid (cis-9, trans-11-18 : 2 CLA) content in the caecal tissue results from the modulation of the bacterial metabolism of LA rather than changes in host desaturase (SCD-1) expression and/or activity. Although there is strong evidence for an effect of the gut microbiota on the tissue levels of rumenic acid (cis-9, trans-11-18 : 2 CLA), a contribution of the endogenous host desaturase (SCD-1) activity cannot be ruled out. In ruminants, the majority of rumenic acid (cis-9, trans-11-18 : 2 CLA) found in tissues results from the desaturation of a bacterial metabolite, vaccenic acid (trans-11-18 : 1), by SCD-1 in ruminant tissues(Reference Griinari, Corl and Lacy12). We may propose that the increase of rumenic acid (cis-9, trans-11-18 : 2 CLA) observed in caecal tissue is the result of the desaturation by host SCD-1 enzyme of the high amount of vaccenic acid (trans-11-18 : 1) produced by the gut microbiota.
It has already been reported that administration of commensal gut bacteria leads to changes in fatty acid profile in different host tissues (for example, adipose tissue, liver and brain)(Reference Wall, Ross and Shanahan53, Reference Wall, Marques and O'Sullivan54). Wall et al. reported that supplementation with a CLA-producing bacteria (Bifidobacterium breve)(Reference Coakley, Ross and Nordgren10, Reference Devillard, McIntosh and Duncan16) and LA (18 : 2n-6) not only increased rumenic acid (cis-9, trans-11-18 : 2 CLA) content in murine tissues but also changed the n-3 PUFA profile(Reference Wall, Ross and Shanahan23). They observed an increase in both EPA (20 : 5n-3) and DHA (22 : 6n-3) contents in the large intestine and adipose tissue(Reference Wall, Ross and Shanahan23). In our studies, we observed that HF diet feeding decreased EPA (20 : 5n-3) content in the liver and caecal tissues and Ax supplementation further decreased EPA (20 : 5n-3) content in the liver. It is interesting to note that, even if α-LnA (18 : 3n-3) content was increased after Ax supplementation, EPA (20 : 5n-3) content did not increase after Ax supplementation although α-LnA (18 : 3n-3) is the precursor of very-long-chain n-3 PUFA. This observation is in favour of the requisitioning of the enzymes required for the synthesis of very-long-chain n-3 PUFA in another pathway such as the production of conjugated very-long-chain n-6 PUFA from CLA. Indeed, the production of conjugated very-long-chain n-6 PUFA from CLA(Reference Banni, Petroni and Blasevich55) has been described, and those metabolites could lead to interesting biological properties(Reference Banni, Petroni and Blasevich55). In addition, it has also been shown that the activity of the enzymes implicated in very-long-chain PUFA synthesis (desaturase and elongase) is regulated by the nutritional status and by the composition of the dietary fat(Reference Cho, Nakamura and Clarke56–Reference Nakamura and Nara58). Deficiency in essential fatty acids increases enzyme activity whereas consumption of essential fatty acids decreases enzyme activity. Therefore, the increase in α-LnA observed after Ax supplementation could decrease the activity of the enzymes implicated in the long-chain PUFA synthesis and contribute to the decrease in EPA content.
The analytical method used to analyse the fatty acid profile in tissue allowed us to quantify only rumenic acid (cis-9, trans-11-18 : 2 CLA). This is the major CLA isomer produced by Bifidobacterium spp.(Reference Gorissen, Raes and Weckx44, Reference Ogawa, Kishino and Ando59); however, CLA are a large group of isomers and quantification of other isomers would be interesting since the literature indicates that the physiological effects of CLA are isomer specific(Reference Churruca, Fernandez-Quintela and Portillo2, Reference Taylor and Zahradka4, Reference Bauman, Baumgard and Corl8, Reference Roche, Noone and Sewter60, Reference Brown, Boysen and Jensen61). Finally, some bacteria isolated from the mammalian gut are also able to produce conjugated LnA in vitro (Reference Gorissen, Raes and Weckx44, Reference Park, Cho and Song47) and some biological effects are now attributed to this other group of conjugated fatty acids(Reference Coakley, Banni and Johnson45, Reference Hennessy, Ross and Devery46, Reference Kohno, Suzuki and Yasui62, Reference Yuan, Sun and Sinclair63). So, an analysis of conjugated LnA and even a global analysis of conjugated PUFA in host tissues would be an interesting perspective of our studies.
In conclusion, we showed for the first time that the gut microbiota of mice is able to produce CLA without any supplementation. We showed that HF diet feeding increased CLA content in host tissues by increasing substrate availability for the gut microbiota. Prebiotic supplementations further increased CLA content in the caecal tissue, by further increasing substrate availability and modulating the gut microbiota composition. Just as some papers have proposed that CLA production is a characteristic of probiotic bacteria(Reference O'Shea, Cotter and Stanton49, Reference Ross, Mills and Hill64), we propose that CLA production is a characteristic to take into account in the metabolic effects of non-digestible carbohydrates with prebiotic properties.
Supplementary material
To view supplementary material for this article, please visit http://dx.doi.org/10.1017/S0007114513000123
Acknowledgements
Financial support has been provided by grants from the Walloon Region (General Directory of Agriculture, convention D31–1107) and Fonds de la Recherche Scientifique (FRS-FNRS; no. 1·5·095·09F). P. D. C. is Research Associate from the FRS-FNRS, Belgium. F. M. and L. D. V. benefit from financial support by the Research Foundation – Flanders (Fonds Wetenschappelijk Onderzoeck (FWO) – Vlanderen) and the Research Council of the Vrije Universiteit Brussel. F. M. is the recipient of a PhD fellowship of the Research Foundation – Flanders (FWO – Vlanderen). S. P. and T. V. D. W. are postdoctoral researchers from the Research Foundation – Flanders (FWO – Vlanderen). C. D. benefits from a Danone Institute grant. The funders had no role in study design, data collection and analysis, decision to publish, or preparation of the manuscript.
The authors thank Christine Turu and Eric Mignolet for their excellent technical assistance in the fatty acid profile analysis; and Barbara Pachikian, Laure Bindels, Amandine Everard, Lucie Geurts and Bouazza Es Saadi for helpful discussion and technical support.
C. D. performed data collection and analysis, interpreted the data and wrote the manuscript. A. N. M. designed the experiments, performed data collection and analysis, and interpreted the data. E. D. W. designed the experiments, and performed data collection and analysis. F. C. D. B. performed data collection. S. P. and T. V. D. W. performed and interpreted gut microbiota analysis. F. M. and L. D. V. participated to the gut microbiota analysis. P. D. C. performed the tissue sampling at the end of the experiment. N. M. D. planned and reviewed all experiments and manuscript preparation. A. M. N., P. D. C., N. M. D. and Y. L. provided intellectual input on the paper and reviewed the paper.
The authors declare no conflicts of interests.


