

During human fetal development, the immune system is adapted to the intra-uterine environment( Reference Szekeres-bartho 1 ). The transition from a practically sterile environment in the uterus to the outside world is particularly critical because the neonate is suddenly newly exposed to a large number of micro-organisms and food antigens. Therefore, the development of the human immune system undergoes the most radical and rapid changes. However, during the first months of life, this system is still immature and, in consequence, there are high morbidity and mortality rates owing to infectious diseases( Reference Palmeira and Carneiro-Sampaio 2 ).
In the human and rat newborn, the immature immune system has significant quantitative and qualitative deficiencies, especially concerning acquired immunity. The underdeveloped acquired immunity is reflected by the existence of low-Ig levels, and the small number of naive T lymphocytes and antigen-presenting cells in the newborn of both species( Reference Schelonka and Infante 3 , Reference Pérez-Cano, Franch and Castellote 4 ). For this reason the survival of the human and rat neonate relies on the innate immune system( Reference Levy 5 , Reference Wynn, Scumpia and Winfield 6 ). However, this still has some deficiencies, such as low phagocytic activity, defects in neutrophil and monocyte numbers and function, reduced cytokine secretion and lower natural killer (NK) cytotoxic capacity compared with those present in adults( Reference Basha, Surendran and Pichichero 7 ). On the other hand, physical barriers, such as the intestinal wall, are crucial for the human and rat neonate to avoid infections and control exposure to oral antigens, which in turn is a challenge for the development and maturation of the gut-associated lymphoid tissue (GALT)( Reference Pérez-Cano, Franch and Castellote 4 , Reference Chin, Hill and Aurora 8 ). GALT, formed by the inductive sites (Peyer’s patches, isolated lymph nodes and mesenteric lymph nodes (MLN)) and the effector sites (intraepithelial and lamina propia lymphocytes), is not mature at birth in both species and develops in the postnatal period( Reference Pérez-Cano, Castellote and Marín-Gallén 9 – Reference Cornes 11 ).
In humans, to compensate the immunological immaturity in intra-uterine and early life, the mother provides important factors for protecting the newborn – first, transferring antibodies through the placenta and, later, through the breast milk( Reference Hanson, Korotkova and Lundin 12 ). Human milk contains a wide variety of bioactive factors and hormones( Reference Lönnerdal 13 ) including adipokines, such as leptin and adiponectin. The concentrations of these adipokines in breast milk change throughout the lactation( Reference Ozarda, Gunes and Tuncer 14 , Reference Newburg, Woo and Morrow 15 ). Leptin and adiponectin are involved in the control of endocrine and metabolic systems and they seem to play a role in the regulation of the immune system, in both the innate and adaptive immune responses( Reference Blüher and Mantzoros 16 , Reference Batra, Okur and Glauben 17 ). In particular, leptin has been described as a pro-inflammatory cytokine that stimulates proliferation and NK cell and T-lymphocyte responses, and the switch to a pro-inflammatory Th1 immunity, thus promoting the secretion of cytokines such as interferon (IFN)-γ, TNF-α, IL-6 and IL-1( Reference Batra, Okur and Glauben 17 ). However, the anti- or pro-inflammatory properties of adiponectin are still a matter of discussion( Reference Luo and Liu 18 ). It has been described that adiponectin has an anti-inflammatory function because of its capacity to suppress the synthesis of TNF-α and IFN-γ and to induce the production of several anti-inflammatory cytokines( Reference Wolf, Wolf and Rumpold 19 ). In contrast, other studies show an inflammatory response under certain circumstances, by activating NK cells and inducing inflammatory cytokines such as IL-1 and IL-6( Reference Tsatsanis, Zacharioudaki and Androulidaki 20 , Reference Park, McMullen and Huang 21 ).
To date, there are few data available about the dietary effects of leptin and adiponectin on the GALT, and none about the effect of either adipokines in this compartment in early life, when the development of the immune system is taking place. We hypothesised that these breast milk adipokines, with immunomodulatory actions described in adults, may also play a role in the neonatal immune system, and in particular in the maturation of the GALT. Therefore, the aim of the present study was to evaluate the impact of leptin or adiponectin supplementation on some aspects of the intestinal immune system development in neonatal rats. Specifically, we focused on the MLN lymphocytes, both in terms of their composition and functionality. Thus, immune responses of pups fed leptin or adiponectin at the middle and at the end of the suckling period were established.
Methods
Animals
In total, sixteen pregnant Wistar rats (G15) were obtained from Janvier Labs (Le Genest Saint Isle, France) and individually housed in cages under controlled conditions of temperature and humidity in a 12-h light–12 h dark cycle in the Faculty of Pharmacy and Food Science animal’s facilities. Rats were fed commercial diet corresponding to the American Institute of Nutrition 93M formulation and water ad libitum.
The studies were performed in accordance with the criteria outlined by the Guide for the Care and Use of Laboratory Animals. Experimental procedures were reviewed and approved by the Ethical Committee for Animal Experimentation of the University of Barcelona (CEEA/UB ref. 220/15).
Experimental design and dietary supplementation
Pregnant rats were allowed to deliver naturally. The day after birth was registered as day 1 of life. Litters were unified to nine pups per lactating dam, with free access to the nipples and rat diet. Handling was performed in the same time range to avoid the influence of biological rhythms.
According to the oral supplementation given, suckling rats were distributed into four groups (n 36/group): reference, leptin, adiponectin and whey protein concentrate (WPC). Each group was composed of four litters of nine pups each. The leptin group was administered with 0·7 μg/kg per d of leptin (i.e. 17·6, 26·6 and 43·8 ng/rat at days 10, 14 and 21, respectively) (PeproTech®) in water, based on a reported study( Reference Picó, Oliver and Sánchez 22 ). Owing to the lack of similar studies, the adiponectin dose was calculated taking into account the concentration ratio of adiponectin v. leptin in human milk, which was about fifty times higher( Reference Weyermann, Brenner and Rothenbacher 23 , Reference Martin, Woo and Geraghty 24 ). Therefore, the adiponectin group was supplemented with a solution of 35 μg/kg per d of adiponectin (PeproTech®) in water (i.e. 0·8, 1·2 and 2·1 μg/rat at days 10, 14 and 21, respectively). In parallel, another group of animals was administered with a bovine WPC, containing high concentration of bioactive factors. This WPC was similar to that used in previous studies and it did show immunomodulatory effects on neonatal rats( Reference Pérez-Cano, Marín-Gallén and Castell 25 , Reference Pérez-Cano, Marín-Gallén and Castell 26 ). Thus, this intervention was used as a possible positive control of modulation by breast milk bioactive factors. Animals from the WPC group were supplemented with Lacprodan® MFGM-10 (Arla Foods Ingredients Group) in a previously described physiological dose for suckling rats receiving infant formula( Reference Pérez-Cano, Marín-Gallén and Castell 26 ) (0·3 g/kg per d) (i.e. 6·9, 10·8 and 17·9 mg/rat at days 10, 14 and 21, respectively). The reference group was administered with the same volume of vehicle (water) as the supplemented groups (10 ml/kg per d). To allow gastric emptying, litters were separated from their dam half an hour before oral supplementation. Meanwhile, animals were weighed. Pups received the supplements daily by oral gavage throughout the suckling period (from day 1 to day 21) using low-capacity syringes (Hamilton Bonaduz) adapted to oral 25- or 23-gauge gavage tubes (ASICO), as previously described( Reference Pérez-Cano, Marín-Gallén and Castell 25 ).
Body weight was recorded throughout the study, and on the last day body length (nose-anus) was measured. The body weight gain percentage at a specific day was calculated by subtracting the weight at the beginning of the study (day 1) from the weight at the subsequent days, divided by starting weight and multiplied by 100. These measures enabled the determination of the BMI, calculated as body weight/length2 (g/cm2), and the Lee index, calculated as
 $$\root {^{3} } \of {{\rm weight}}/{\rm length} \left( {\root 3 \of {{\rm g}}/{\rm cm}} } \right)$$
.
$$\root {^{3} } \of {{\rm weight}}/{\rm length} \left( {\root 3 \of {{\rm g}}/{\rm cm}} } \right)$$
.
Sample collection and processing
At days 10, 14 and 21, animals were intramuscularly anaesthetised with ketamine (90 mg/kg) (Merial Laboratories S.A.) and xylazine (10 mg/kg) (Bayer A.G.), exsanguinated and MLN and small intestine (SI) were collected. The duodenum was removed and the distal one-third portion of the remaining intestine was used to obtain the gut wash. For this, it was opened lengthwise, cut into 5-mm pieces, weighed and incubated with 2 ml of PBS (pH 7·2; 154 mm sodium chloride (NaCl), 3·99 mm sodium dihydrogen phosphate monohydrate (NaH2PO4.H2O) and 16 mm disodium hydrogen phosphate dehydrate (Na2HPO4.2H2O)) for 15 min in a shaker (55 shakings/min) at 37°C. After centrifugation (535 g , 5 min, 4°C), supernatants were stored at −20°C until Ig quantification.
Immunoglobulin quantification
At the end of the suckling period, intestinal IgA and IgM concentrations were quantified in gut wash using a rat IgA or IgM ELISA quantification set (Bethyl Laboratories), as performed in previous studies( Reference Camps-Bossacoma, Pérez-Cano and Franch 27 ). Data are expressed as μg of IgA or IgM per gram of intestinal tissue used for the gut wash.
Lymphocyte isolation from mesenteric lymph nodes
MLN cell suspensions were obtained by passing the tissue through a sterile 40-µm mesh cell strainer (Thermo Fisher Scientific). The cell suspension was centrifuged (538 g , 10 min, 4°C) and resuspended in Roswell Park Memorial Institute (RPMI) 1640 medium (Sigma-Aldrich) enriched with 10 % fetal bovine serum (FBS; Sigma-Aldrich), 100 IU/ml streptomycin–penicillin (Sigma-Aldrich), 2 mm l-glutamine (Sigma-Aldrich) and 0·05 mm 2-β-mercaptoethanol (Merck Millipore). Cell counting and viability were assessed by CountessTM Automated Cell Counter (InvitrogenTM, Thermo Fisher Scientific). Lymphocytes were immediately used to analyse their phenotype and their ability to proliferate and secrete cytokines after mitogen stimulation.
Lymphocyte immunofluorescence staining and flow cytometry analysis
Lymphocytes (2–5×10⁵) from MLN were stained with anti-rat monoclonal antibodies (mAb) conjugated to fluorescein isothiocyanate (FITC), phycoerythrin (PE), peridinin-chlorophyll-a protein (PercP), allophycocyanin (APC) or APC-cyanine (Cy)7, as in previous studies( Reference Rigo-Adrover, Franch and Castell 28 ). In this case, the mAb used were anti-CD4, anti-CD8α, anti-CD8β, anti-TCRαβ, anti-TCRγδ, anti-NKR-P1A, anti-CD25, anti-CD45RA (BD Biosciences), anti-CD62L and anti-CD103 (Biolegend), anti-TLR-4 (Novus Biologicals) and anti-Foxp3 (eBioscience). The cells were incubated with a mixture of optimal concentrations of mAb in PBS containing 2 % FBS and 0·1 % sodium azide (Merck Millipore), for 20 min at 4°C in darkness. A negative control staining using an isotype-matched mAb was included in each cell sample. For intracellular staining, cells previously labelled with anti-CD4-PE and anti-CD25-FITC mAb were treated with Foxp3 fixation/permeabilisation kit (eBioscience). Then, intracellular staining with anti-Foxp3-APC mAb was carried out under the same conditions as extracellular staining. All stained cells were fixed with 0·5 % p-formaldehyde and stored at 4°C in darkness until analysis by flow cytometry. Analyses were performed using a GalliosTM flow cytometer (Beckman Coulter Inc.) in the Scientific and Technological Centres of the University of Barcelona (CCiT-UB). All samples were assessed by FlowJo, version 10 software (TreeStar, Inc.). Results are expressed as percentages of positive cells in the lymphocyte population selected according to their forward-scatter characteristics and side-scatter characteristics or in a particular selected population.
Lymphocyte proliferative response
T-lymphocyte activation was carried out in ninety-six-well plates (TPP) previously coated with anti-CD3/anti-CD28 mAb (10 and 20 µg/ml, respectively; BD Biosciences). MLN lymphocytes (105/200 µl) from 14-d-old and 21-d-old animals were incubated in quadruplicate with or without stimulus for 48 h. The proliferation was quantified by means of the BrdU Cell Proliferation Assay Kit (Merck Millipore) according to the manufacturer’s instructions. This assay is based on the measurement of 5-bromo-2′-deoxyuridine (BrdU) incorporated into proliferating cells during DNA synthesis. After stopping the enzymatic reaction, the absorbance (Ab) was measured at 450 nm on a microplate photometer (Labsystems Multiskan MS).
The proliferation rate is expressed, as follows, considering the reference group:
Proliferation rate = (A/B), where
 $$ A\,{\equals}\, [(Ab_{\rm stimulated\ cells} – Ab_{\rm non{\hbox -}stimulated\ cells}) / Ab_{\rm non{\hbox -}stimulated\ cells}]_{\rm supplemented\ group} $$
 $$ B\,{\equals}\, [(Ab_{\rm stimulated\ cells} – Ab_{\rm non{\hbox -}stimulated\ cells}) / Ab_{\rm non{\hbox -}stimulated\ cells}]_{\rm reference\ group} $$
Quantification of cytokine production from mesenteric lymph node lymphocytes
Supernatants collected after the stimulation process described above were used to quantify cytokine production. Concentrations of IL-1α, IL-2, IL-4, IL-5, IL-10, IL-12p70, IL-13, IL-17A, IFN-γ and TNF-α were quantified using ProcartaPlex® Multiplex Immunoassay (eBioscience). In brief, specific magnetic capture beads coded with distinct colours were bound to the analyte of interest. Then it was possible to reveal the specific concentration through different detection antibodies conjugated to PE by the Luminex MAGPIX analyser (Luminex®) at the CCiT-UB.
The lower limits of detection were as follows: 13 pg/ml for IL-1α; 2·10 pg/ml for IL-2; 0·85 pg/ml for IL-4; 1·65 pg/ml for IL-5; 14 pg/ml for IL-10; 4·93 pg/ml for IL-12p70; 3·17 pg/ml for IL-13; 2·61 pg/ml for IL-17A; 4·35 pg/ml for IFN-γ; and 3·08 pg/ml for TNF-α.
Statistical analysis
Analysis of the data was carried out by the software package IBM Statistical Package for the Social Sciences (SPSS, version 22.0). To assess the homogeneity of variance and the distribution of the results, Levene’s and Shapiro–Wilk tests were performed, respectively. Repeated-measures ANOVA using the Bonferroni correction was used to determine the time-related differences in the body weight in each supplementation. For other variables, when there was a normal distribution and equality of variance, conventional one-way ANOVA test followed by the post hoc Bonferroni was performed. The non-parametric Kruskal–Wallis test followed by the post hoc Mann–Whitney U test were used in order to assess significance. Significant differences were established at P<0·05.
Results
Growth and morphometry
Rats’ body weight gain, calculated by monitoring from the day after birth and throughout the suckling period, showed no differences among groups (online Supplementary Fig. S1). Morphometric variables such as BMI and Lee index were also evaluated during suckling (Table 1). The age-increasing BMI pattern was not modified by any of the supplementations. However, while the Lee index was not affected by the diets in any of the groups at 10 and 14 d, a decrease was seen at day 21 (P<0·01) in all groups (Table 1).
Table 1 BMI, Lee index, relative small-intestinal (SI) weight and relative SI length in the four groups over the study (days 10, 14 and 21)Footnote || (Mean values with their standard errors; n 7–15)
WPC, whey protein concentrate.
Statistical differences: * P<0·05 v. reference group; † P<0·05 v. same group at day 10; ‡ P<0·05 v. same group at day 14; § P<0·05 v. leptin group (ANOVA).
|| The BMI was calculated as body weight/length2 (g/cm2) and the Lee index was calculated as
 $$\root {^{3} } \of {{\rm weight}}\,/\,{\rm length}{\times}1000} \ \left( {\root 3 \of {{\rm g}}\,/\,{\rm cm}} } \right)$$
. Relative SI weight and relative SI length were calculated as weight/length of the intestine divided by the body weight×100.
$$\root {^{3} } \of {{\rm weight}}\,/\,{\rm length}{\times}1000} \ \left( {\root 3 \of {{\rm g}}\,/\,{\rm cm}} } \right)$$
. Relative SI weight and relative SI length were calculated as weight/length of the intestine divided by the body weight×100.
Although relative weight of the SI, expressed as percentage with respect body weight, increased mainly in the last week of the suckling period (Table 1), the relative length decreased all along this period. Moreover, leptin displayed an intestinal growth-enhancing effect at day 21 (P<0·05 v. reference group).
Intestinal secretory IgA and IgM concentration
Intestinal secretory IgA and IgM production was established on day 21 (Fig. 1). In the reference group, secretory IgA concentration was five times higher than that of IgM (Fig. 1). Leptin dietary supplementation significantly lowered the secretory IgA content in the intestinal compartment (P<0·01 v. reference group) (Fig. 1). With regard to IgM, none of the three experimental supplementations modified the levels of this Ig (Fig. 1).
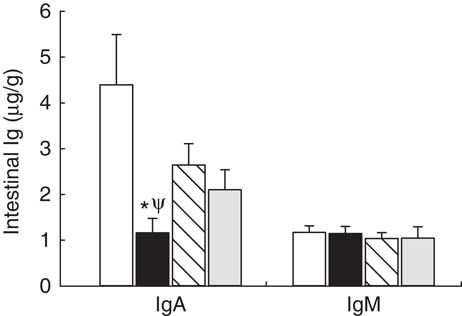
Fig. 1 Supplementation effect on secretory IgA and IgM content in the intestinal compartment (gut wash) at the end of the suckling period (day 21) from the four groups: reference (![]() ), leptin (
), leptin (![]() ), adiponectin (
), adiponectin (![]() ) and whey protein concentrate (
) and whey protein concentrate (![]() ). Values are means (n 9–12 pups per group analysed in duplicate), with their standard errors represented by vertical bars. Statistical differences: * P<0·05 v. reference group; Ψ P<0·05 v. adiponectin group (Mann–Whitney U test).
). Values are means (n 9–12 pups per group analysed in duplicate), with their standard errors represented by vertical bars. Statistical differences: * P<0·05 v. reference group; Ψ P<0·05 v. adiponectin group (Mann–Whitney U test).
Lymphocyte composition of mesenteric lymph nodes
A mean count of 2·0×106 (sem 2·0×105) and 1·3×107 (sem 7·6×105) of MLN cells was established during (day 14) and at the end (day 21) of the suckling period, respectively, from all groups, without differences among them. Their main lymphocyte subset proportions are shown in Table 2. Leptin and WPC supplementations significantly increased the T-cell proportion compared with the reference group at day 14 (P<0·01 and P<0·05, respectively). These increases were due to a higher proportion of TCRαβ + cells (P<0·01 and P<0·05, respectively), and in particular to an increase in the TCRαβ + CD8+ cell population (P<0·05) (Table 2).
Table 2 Main lymphocyte subsets in mesenteric lymph nodes in the four groups during (day 14) and at the end (day 21) of the suckling period (Mean values with their standard errors; n 8-14 pups per group analysed in uniplicate)
WPC, whey protein concentrate.
Statistical differences: * P<0·05 v. reference group; ‡ P<0·05 v. same group at day 14 (ANOVA).
Although no significant effects were observed in TCRγδ+ cell proportions as a result of adipokine supplementation, an age-increasing proportion was found in the reference group that was particularly due to the increase in the TCRγδ+ CD8+ cell proportion (P<0·01). This was not the case for the rest of the groups in which the values observed at day 14 were already as high as those found on day 21 (Table 2). With regard to NK subset, a relative age-associated decrease was detected between 14- and 21-d-old rats owing to a normal immune development in all groups. This decrease is also found in the proportion of NK CD8+ cells in MLN from leptin animals between day 14 and day 21, but not in the others. NK cell percentages at day 14 or at day 21 were not influenced by dietary supplementation. On the other hand, the leptin group showed a decrease from day 14 to day 21 in NKT cell proportion in parallel to a decrease in NKT cells expressing CD8 co-receptor (Table 2).
In reference animals, the whole proportion of CD8+ cells in MLN increased from day 14 to day 21 of age (P<0·05) (Fig. 2(a)). In contrast, both adipokines induced a higher proportion of CD8+ cells on day 14 (P<0·05 v. reference), and on that day they were able to promote the achievement of a percentage of CD8+ cells that was typical from day 21 (Fig. 2(a)). When looking at both forms of CD8 co-receptor (CD8αα and CD8αβ), a decrease in the CD8αα +:CD8αβ + ratio in the reference and leptin groups was observed in comparison with their respective group at day 14 (P<0·01) (Fig. 2(b)).
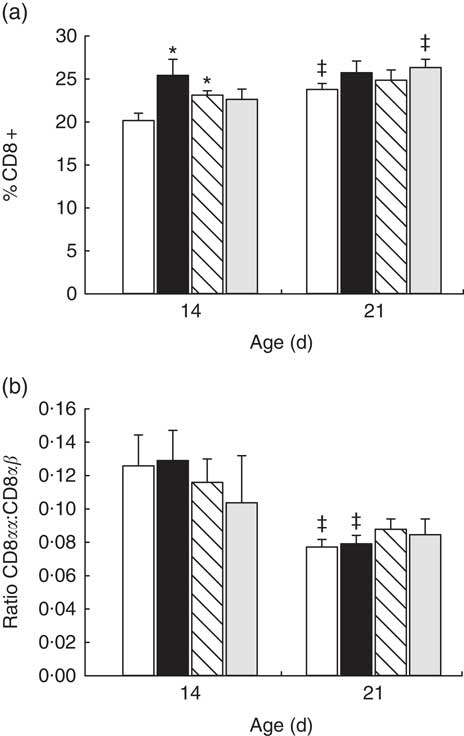
Fig. 2 Percentage of CD8+ cell subset (a) and CD8αα:CD8αβ ratio (b) in mesenteric lymph node lymphocytes during (day 14) and at the end (day 21) of the suckling period from the four groups: reference (![]() ), leptin (
), leptin (![]() ), adiponectin (
), adiponectin (![]() ) and whey protein concentrate (
) and whey protein concentrate (![]() ). Values are means (n 9–12 pups per group analysed in uniplicate) with their standard errors represented by vertical bars. Statistical differences: * P<0·05 v. reference group; ‡ P<0·05 v. same group at day 14 (ANOVA).
). Values are means (n 9–12 pups per group analysed in uniplicate) with their standard errors represented by vertical bars. Statistical differences: * P<0·05 v. reference group; ‡ P<0·05 v. same group at day 14 (ANOVA).
The three dietary interventions did not modify the proportion of the other main subpopulations in the MLN compartment, such as Th, Treg, B and CD8+ CD4+ cells, either at day 14 or day 21 of life (Table 2). The activation marker CD25 was also studied in the main subsets, and in all cases its percentage was about 4 %, without differences among groups or ages studied.
For the study of the intestinal homing, the expression of adhesion molecules CD62L selectin and αE integrin (CD103) was quantified. CD62L selectin was highly expressed in MLN cells at day 21, whereas αE integrin was poorly expressed (online Supplementary Fig. S2). No significant differences were detected in the CD62L/αE integrin expression pattern owing to the supplements in any studied group within each studied day (online Supplementary Fig. S2). However, αE− CD62L+ cell percentages at day 21 from the reference, leptin and WPC groups (61·5 (sem 1·7); 60·9 (sem 1·6); 58·9 (sem 1·3), respectively) were higher than their respective value at day 14 (52·9 (sem 1·7); 54·5 (sem 2·6); 50·9 (sem 1·2), respectively) (P<0·05). In contrast, the adiponectin group showed no differences at days 14 and 21.
In addition, the expression of CD62L selectin/αE integrin molecules on T and B cells was also studied (online Supplementary Table S1). No significant differences were detected between groups in Th (CD4+ CD8−), Tc (CD8+ CD4−), DP (CD4+ CD8+) and B (CD45RA+) lymphocytes on the same day of analysis, with the exception of the changes found in the CD4+ CD8+ subset at day 21, where leptin and WPC supplementation decreased the αE+ CD62L+ percentage (P<0·05 v. reference). Moreover, some statistical differences between day 14 and day 21 were found in Th and B subsets within their respective group. In this regard, the low αE− CD62L+ cell percentage in the adiponectin group found on day 21 (online Supplementary Fig. S2) could be explained by the relative increase in the percentage of CD4+ αE+ CD62L− and CD4+ αE+ CD62L+ (online Supplementary Table S1). Reference, adiponectin and WPC groups, but not the leptin group, showed some age-developmental CD62L/αE integrin changes in the B-cell subset. In Tc cells no differences were found owing to age or supplementations (online Supplementary Table S1).
Mesenteric lymph node lymphocyte proliferation
To determine the functional capacity of MLN lymphocytes, we studied their lymphoproliferative response on days 14 and 21. At day 14, proliferative capacity was not modified by any supplementation (Fig. 3). At the end of the suckling period, adiponectin and WPC supplementation showed higher lymphoproliferative capacity than the reference group (P<0·05), whereas it was not modified by the leptin supplementation (Fig. 3).
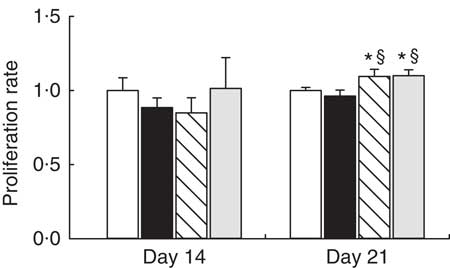
Fig. 3 Supplementation effect on proliferation rate at day 14 and at day 21 in mitogen-stimulated mesenteric lymph nodes (MLN) lymphocytes from the four groups: reference (![]() ), leptin (
), leptin (![]() ), adiponectin (
), adiponectin (![]() ) and whey protein concentrate group (
) and whey protein concentrate group (![]() ). Values are means (n 3–9 pups per group analysed in quadruplicate), with their standard errors represented by vertical bars. Statistical differences: * P<0·05 v. reference group; § P<0·05 v. leptin group (Mann–Whitney U test).
). Values are means (n 3–9 pups per group analysed in quadruplicate), with their standard errors represented by vertical bars. Statistical differences: * P<0·05 v. reference group; § P<0·05 v. leptin group (Mann–Whitney U test).
Cytokine production by mesenteric lymph node lymphocytes
The cytokine pattern secreted by MLN cells differed between cells obtained at days 14 and 21 of age (Table 3). Cell culture supernatant from the reference group on day 21 showed lower IL-1α, IL-10, IL-13 and higher TNF-α concentrations than those quantified on day 14, whereas IL-10/TNF-α was particularly low on day 21 owing to the decrease in IL-10.
Table 3 Cytokine production from mesenteric lymph node lymphocytes in the four groups over the study (days 14 and 21) (Mean values with their standard errors; n 3–12 pups per group analysed in duplicate)
WPC, whey protein concentrate group.
Statistical differences: * P<0·05 v. reference group; ‡ P<0·05 v. same group at day 14; § P<0·05 v. leptin group (ANOVA).
All three supplementations showed the same profile as that observed in the reference group for IL-1, IL-10 and IL-10/TNF-α. Leptin and adiponectin supplementations were able to lower the levels of IL-13 from day 21 to those observed at day 14. Moreover, apart from the reference group, only adiponectin was able to lower TNF-α to the values present at day 14. In addition, IL-4 and IL-5 concentrations at day 21 were lower than those at day 14 in the leptin and adiponectin groups, an effect not observed in the reference group.
At day 14, the leptin supplementation group showed higher IL-4 and IL-5 release, being both Th2-related cytokines, than the reference group (P<0·05) (Table 3). In contrast, lymphocytes from the adiponectin group produced significantly higher levels of IL-5, IL-13 and TNF-α at day 14 than the reference group at the same day (P<0·01) (Table 3).
At day 21, the leptin and adiponectin groups showed a notable decrease in IL-2 secretion in comparison with the reference group (P<0·01). The IL-12p70 secretion was also diminished by the three supplementations (P<0·05 in leptin group and P<0·01 in adiponectin and WPC v. reference group) (Table 3). In addition, IL-13 concentration from animals supplemented with adiponectin was lower than that produced by the reference group (P<0·01).
Overall, the Th1:Th2 cytokine (INF-γ:IL-4) ratio was not influenced by age in the reference, adiponectin or WPC groups, and an increase in that ratio at day 21 can only be observed in the leptin group when comparing day 14 and day 21 (P<0·05) (Table 3).
Discussion
The neonatal benefits of the presence of leptin and adiponectin in breast milk are many; leptin has an important role in regulation of appetite, growth and weight, and adiponectin was also associated inversely with obesity( Reference Newburg, Woo and Morrow 15 , Reference Çatlı, Dündar and Dündar 29 ). Moreover, both adipokines were described to have immunomodulatory actions( Reference Luo and Liu 18 , Reference Naylor and Petri 30 , Reference Carbone, La Rocca and Matarese 31 ). However, at present, there are no studies on the influence of leptin and adiponectin on the immune system in early life, particularly on the immature GALT.
The results of this study show that the adipokine supplementation did not modify the body weight gain pattern, the BMI or the Lee index, suggesting that the administration of leptin and adiponectin did not modify the body mass of the animals. These results are in accordance with other studies performed with rats that were orally administered with leptin during the suckling period( Reference Picó, Oliver and Sánchez 22 , Reference Sánchez, Oliver and Miralles 32 ), and also in old male mice receiving subcutaneous doses of leptin( Reference Uner and Sulu 33 ). Taking into account the role of leptin in satiety and suppression of appetite described in adults( Reference Ahima, Prabakaran and Mantzoros 34 , Reference Friedman and Halaas 35 ), a weight loss would have been expected. However, studies in rats and mice suggest that leptin may have a different role in neonates because the exogenous administration of leptin to newborn rats modifies the expression of neuropeptides, known to affect appetite in adults, without altering appetite in neonatal rats( Reference Proulx, Richard and Walker 36 ). Furthermore, weight loss has been described as a potent inducer of adiponectin synthesis( Reference Bruun, Lihn and Verdich 37 ); however, there is almost no information regarding whether adiponectin affects, directly or indirectly, body weight in adults, and none at all regarding neonatal life.
When the adipokines are administered, they travel through the gastrointestinal system and pass through the epithelial barrier into the blood( Reference Çatlı, Dündar and Dündar 29 ). A limitation of this study is that the bioavailability of leptin and adiponectin has not been measured in the suckling rats along the intervention. In addition, although recent studies show that different multimers of adiponectin can have different biological actions( Reference Meilian and Feng 38 , Reference Wang and Scherer 39 ), we supplemented the rats with the monomeric form, whereas the most abundant in human milk is the high-molecular-weight multimeric form( Reference Newburg, Woo and Morrow 15 , Reference Savino, Lupica and Benetti 40 ).
However, as they reach the intestine, there must be a direct interaction between these compounds and the intestinal epithelial cells, as well as with the immune cells scattered throughout the intestine (effector sites) or grouped in aggregates (induction sites) of the GALT. For this reason, we considered that it would be interesting to determine the effect of adipokines on morphometric changes of the SI. Supplementation with leptin, but not with adiponectin, for the 3 weeks of suckling was able to increase the relative SI weight, therefore suggesting a certain local trophic effect of leptin on the intestine. However, when we considered the intestinal production of secretory IgA and IgM at the end of the suckling period, the levels were very low, far away from those described in 6-week-old Wistar rats( Reference Massot-Cladera, Franch and Pérez-Cano 41 ), and in agreement with studies showing the immaturity of B cells in the neonate( Reference Martin, Nauta and Ben Amor 42 ). The supplementation with leptin, but not adiponectin, caused a reduction in the secretion of intestinal IgA without affecting IgM levels. These antibodies are produced by plasma cells stimulated under Th2 conditions( Reference Adkins 43 ). Some studies suggest the ability of leptin to stimulate Th1 responses and inhibit those of Th2( Reference Naylor and Petri 30 , Reference Procaccini, De Rosa and Galgani 44 ). Thus, the reduction of intestinal secretory IgA associated with leptin supplementation could be attributed to this inhibitory effect. This effect was not observed in the case of adiponectin.
During suckling, rats undergo phenotypical changes in intestinal lymphoid tissues that are a reflection of the maturation of the immune system in this period( Reference Pérez-Cano, Franch and Castellote 4 ). Therefore, the study of MLN lymphocyte composition and functionality in neonates is a useful strategy for assessing the modulatory ability of leptin and adiponectin on the immune system. In this study, none of the adipokines affected B, NK or NKT populations in MLN lymphocytes. However, leptin significantly increased the proportion of TCRαβ + CD8+ lymphocytes in a similar way to the WPC, suggesting an early maturation of this subset. The increase in the TCRαβ + CD8+ cell proportion caused an increase in the overall T-cell percentage. These results are in concordance with a study carried out by Oral et al.( Reference Oral, Javor and Ding 45 ) in human patients, in which an increase in the percentage of blood T-cells and CD8+ subsets after leptin intake was found, without changing NK cell percentage. Moreover, another study in mice splenocytes and thymocytes also described an increase in CD8+ population after leptin administration( Reference Howard, Lord and Matarese 46 ). This increase in T lymphocytes induced by leptin could be explained by its suggested anti-apoptotic effect( Reference Fernández-Riejos, Najib and Santos-Alvarez 47 ). Leptin promotes T-cell survival by modulating the expression of anti-apoptotic proteins such as Bcl-xL in stress-induced apoptosis( Reference Fujita, Murakami and Ogawa 48 ). The reason why this mechanism could be particularly affecting just the CD8+ subsets is yet to be established. On the other hand, little is known about the effect of adiponectin on lymphocyte subpopulations. We found here that adiponectin supplementation was also able to increase CD8+ cell percentage in MLN. This immune-development-promoting effect found here is not in line with the negative regulation effect shown by Wilk et al.( Reference Wilk, Scheibenbogen and Bauer 49 ). In particular, they investigated the in vitro and in vivo effects of adiponectin in antigen-specific T-cell responses and evidenced an increase in CD137+ CD8+ and CD137+ CD4+ proportions in adiponectin knockout mice. CD137 is a co-stimulatory molecule expressed by activated T cells that enhances T-cell proliferation, IL-2 secretion, survival and cytolytic activity( Reference Camps-Bossacoma, Abril-Gil and Saldaña-Ruiz 50 ).
The proportion of cells bearing the adhesion molecules αE integrin and CD62L selectin related to the intestinal homing of lymphocytes has been also analysed. The surface αE integrin was practically non-existent in MLN lymphocytes, and the relative numbers of CD62L+ cells were high and age-related, being higher at the end of lactation. The presence of these molecules, involved in lymphocyte rolling and recruitment to peripheral lymphoid tissues, in early-life rat MLN is similar to that in previous studies( Reference Rigo-Adrover, Franch and Castell 28 ) and also in older animals( Reference Abella, Scotece and Conde 51 ). The supplementation with either adipokine did not exert profound changes in the expression of these homing molecules with the exception of a decrease in the αE+ CD62L+ CD4+ CD8+ percentage in animals supplemented with leptin, the significance of which remains to be explored.
Regarding the MLN cell functionality, although not in this particular tissue, there are previous studies attributing to leptin the capacity to induce lymphoproliferation in vitro and in vivo ( Reference Batra, Okur and Glauben 17 , Reference Abella, Scotece and Conde 51 – Reference FitzGerald, Mandir and Goodlad 55 ). In contrast, with respect to the reference group, we found no differences in lymphocytes from animals given leptin. Those animals supplemented with adiponectin had a higher proliferation rate than the reference group and similar values to those animals supplemented with WPC. Thus, it seems that adiponectin is able to accelerate the acquisition of this immune cell capacity in neonatal life. Conversely, Wilk et al.( Reference Wilk, Scheibenbogen and Bauer 49 ) studied the effect of adiponectin on proliferation and apoptosis of antigen-specific T cells in vitro and showed an apoptosis-promoting effect on CD137+ subsets, which was not observed in CD137− subsets.
The release of cytokines after in vitro stimulation of lymphocytes from leptin- or adiponectin-supplemented animals was also studied. Reported studies with leptin show its ability to stimulate the production of Th1-related cytokines such as IL-1, IL-6, IL-12 and TNF( Reference Naylor and Petri 30 ). Nevertheless, we found an increase in IL-4 and IL-5, Th2-type cytokines, at day 14 and a decrease of IL-2 and IL-12p70 levels at day 21 owing to leptin supplementation. These results agree with an in vitro study showing that low concentrations of leptin increase IL-4 production( Reference Fraser, Thoen and Reseland 56 ). Overall, focusing on the Th1:Th2 cytokine ratio (calculated as IFN-γ:IL-4 ratio), leptin increased the age-related ratio (day 21 v. day 14), thus reinforcing its suggested Th1-promoting and Th2-inhibiting role. In addition, adiponectin increased the release of IL-5, IL-13 and TNF-α at day 14 and decreased the secretion of IL-2, IL-12p70 and IL-13 at day 21. In consequence, it seems that adiponectin does not have a clear Th1/Th2-promoting effect. However, it has been described that adiponectin reduced the expression of the TNF-α in arterial and adipose tissues( Reference Okamoto, Kihara and Ouchi 57 , Reference Maeda, Shimomura and Kishida 58 ). Furthermore, in human monocyte-derived macrophages, adiponectin inhibits the expression of IL-6 and TNF-α but increases the levels of IL-10( Reference Kumada, Kihara and Ouchi 59 ). Overall, further studies should be carried out to fully elucidate the contribution of these adipokines to the cytokine secretion in this period of life.
In summary, the results obtained here suggest that dietary supplementation with leptin and adiponectin during the suckling period is able to promote the maturation of the intestinal immune system. A daily supplementation with leptin induces a rise in the intestinal weight and in the proportion of T cells in MLN, suggesting an intestinal trophic and immunomodulatory effect. Moreover, adiponectin is also able to increase the CD8+ percentage and to promote a proliferative response in MLN cells. Both leptin and adiponectin modulate the production of Th1 and Th2 cytokines. This demonstrates the capacity of these adipokines to promote the development and maturation of cells involved in adaptive immune response, which is clearly immature at this stage of life.
Acknowledgements
The authors thank Maria Guijarro and Lidia Marín-Morote for their help with the laboratory work. The authors also thank Dr J Comas and his laboratory technicians from the Scientific and Technological Centres of the University of Barcelona (CCiT-UB) for their expert assistance in the cytometry service.
This work was supported by a grant from the Spanish Ministry of Economy, Industry and Competitiveness (AGL2013-48459-P). B.G.-P. holds a fellowship from the Spanish Ministry of Economy, Industry and Competitiveness (BES-2014-068134).
The authors’ contributions are as follows: A.F., M.C., F.J.P.-C. and M.J.R.-L. conceived and designed the research; all authors carried out the experiments, the data analysis and were involved in the interpretation of the data; B.G.-P. and F.J.P.-C. contributed to the initial draft of the manuscript; all authors were involved in the critical revision of the manuscript; A.F. and F.J.P.-C. have primary responsibility for the final content. All authors have read and approved the final version of the manuscript for publication.
The authors declare that there are no conflicts of interest.
Supplementary material
For supplementary material/s referred to in this article, please visit https://doi.org/10.1017/S0007114517003786


