


High-yielding dairy cows experience severe metabolic stress during the transition period from late pregnancy to early lactation( Reference Grummer 1 ). This period is characterised by a reduction in feed intake and a marked increase in nutrient demands to sustain milk synthesis and meet energy requirements, thereby making cows more susceptible to negative energy balance (NEB). As a result, the dairy cow adjusts its metabolism by making extensive use of body fat reserves, resulting in elevated levels of NEFA in blood( Reference Grummer 2 ). Excessive concentrations of NEFA cannot be fully oxidised by the liver, thus leading to an accumulation of TAG( Reference Emery, Liesman and Herdt 3 ). Constraints imposed by NEB contribute to the high incidence of metabolism-related diseases such as ketosis and fatty liver( Reference Mulligan and Doherty 4 ). Moreover, the early lactation period is also linked with immunosuppressive( Reference Mallard, Dekkers and Ireland 5 ), inflammatory( Reference Trevisi, Amadori and Cogrossi 6 ) and acute oxidative stress conditions( Reference Aitken, Karcher and Rezamand 7 ), which are often associated with infectious diseases( Reference Mulligan and Doherty 4 ). To prevent excessive energy mobilisation by early-lactating cows, the use of supplemental fats and oils has become a common practice. However, the effects of fat supplementation on hepatic lipid metabolism, oxidative stress conditions and inflammatory responses are not fully understood, and different outcomes may be observed according to the type of fat provided. Among lipid sources, n-3 and n-6 PUFA demonstrate properties that may help in reducing the incidence of NEB and associated metabolic and infectious diseases. For example, multiparous cows supplemented with whole flaxseed (rich in n-3 fatty acids (FA)) during the transition period have lower plasma NEFA, improved energy balance and lower levels of liver TAG and lipids when compared with cows supplemented with a source of saturated lipids( Reference Petit, Palin and Doepel 8 ). Moreover, extruded flaxseed enhanced the energy balance of transition dairy cows( Reference Zachut, Arieli and Lehrer 9 ). Although beneficial effects have been attributed to PUFA supplementation, diets rich in PUFA may also stimulate the production of reactive O2 species (ROS) by the mitochondria, which may increase intracellular oxidative stress( Reference Schönfeld and Wojtczak 10 ). Indeed, oxidative stress was increased in ruminants supplemented with non-protected PUFA, as shown by increased plasma lipid peroxidation in steers and dairy cows( Reference Gobert, Martin and Ferlay 11 , Reference Scislowski, Bauchart and Gruffat 12 ). Moreover, the consumption of a diet rich in n-3 PUFA may also increase lipid peroxidation and oxidative stress in tissues such as the liver( Reference Hussein, Grosovski and Lasri 13 ). To limit oxidative damage, the inclusion of natural antioxidants in the cow’s diet appears to be an interesting avenue to fully exploit the health benefits of n-3 PUFA. Indeed, natural plant extracts rich in polyphenols combined with vitamin E have been shown to reduce plasma lipid peroxidation in lactating dairy cows supplemented with C18 : 3n-3 FA( Reference Gobert, Martin and Ferlay 11 ).
Apart from its high α-linolenic acid (ALA) content (about 55 % of total FA), flaxseed is also the richest source of plant lignans, which are natural antioxidants concentrated in the outer fibre-containing layers of the seed( Reference Touré and Xueming 14 ). Flaxseed is rich in secoisolariciresinol diglycoside, a plant lignan that is mainly converted into the mammalian lignan enterolactone (ENL), a polyphenol metabolite, by the rumen microbiota( Reference Gagnon, Côrtes and da Silva 15 ). In dairy cows, flax hulls increase superoxide dismutase (SOD) activity and SOD1 mRNA abundance in mammary tissue, whereas flax meal increases the relative mRNA abundance of the nuclear factor (erythroid-derived 2)-like 2 (NFE2L2) gene( Reference Côrtes, Palin and Gagnon 16 , Reference Schogor, Palin and dos Santos 17 ). These results suggest that plant lignans from flax meal or flax hulls may contribute to improve the oxidative status as SOD and NFE2L2 are key players in cellular defense against oxidative stress( Reference Trachootham, Lu and Ogasawara 18 ). Moreover, we have recently demonstrated that flax hulls affect the expression of lipogenic genes in the mammary tissue of Holstein cows( Reference Palin, Côrtes and Benchaar 19 ), suggesting that lipogenic gene expression could be modulated by ENL. Modulation of lipogenic gene mRNA abundance was also observed in the livers of rats supplemented with polyphenol-rich compounds such as sesame lignans( Reference Ide, Lim and Odbayar 20 ) and green and black tea( Reference Chen, Bezzina and Hinch 21 ). However, such studies have never been undertaken in the cow’s liver.
On the basis of the above mentioned studies, we hypothesised that antioxidants naturally present in flaxseed protect against hepatic oxidative stress and inflammation induced by high PUFA (linoleic acid (LA) and ALA) concentrations. We further hypothesised that ALA (n-3) and LA (n-6) PUFA and/or ENL modulate the mRNA abundance of genes involved in lipogenic metabolism, oxidative stress response and inflammatory processes in the hepatic tissue of dairy cows. Using an in vitro precision-cut liver slices (PCLS) tissue culture model( Reference de Graaf, Olinga and de Jager 22 ), our objectives were to determine the effects of various LA (n-6):ALA (n-3) ratios (linoleic acid:α-linolenic acid ratio of 4 (FA4), 15 (FA15) and 25 (FA25)) with or without ENL on (1) the mRNA abundance of genes known to have key roles in hepatic lipid metabolism, oxidative stress response and inflammatory processes, (2) oxidative damage to lipids and proteins and (3) SOD activity in liver tissue of early-lactating dairy cows.
Methods
Animals and liver tissue collection
A total of thirteen multiparous high-yielding Holstein cows were used in this study. Cows were selected on the basis of their parity number (between 2 and 4), milk yield (>8500 kg/year) and absence of previously recorded health problems (e.g. mastitis, ketosis). They averaged 711 (sem 57) kg in body weight and 7 d in milk production when liver biopsies were undertaken. Cows were cared for according to a recommended code of practice( 23 ) and all experimental procedures were approved by the institutional animal care committee of the Sherbrooke Research and Development Centre.
On day 7 postpartum, one liver biopsy (approximately 450 mg) was taken from each cow. Biopsies were performed by an experienced veterinarian 6 h after the morning milking, in the right liver lobe, using puncture biopsy. An ultrasound scan (GE LOGIQ e BT12 compact ultrasound; scil Vet Novations) of the liver was performed before each biopsy to avoid major blood vessels and abscesses in the biopsy area. The stainless steel biopsy instrument included three main parts: a trocar, a cannula and a 30 cc syringe used to create a vacuum( Reference de Lima, Martineau and De Marchi 24 ). Sedation of animals was performed by injecting 10 mg/cow of xylazine-HCl (Zoetis) into the coccygeal vein. The surgical preparation, local subcutaneous and intercostal space anaesthesia and the biopsy procedures were performed according to de Lima et al.( Reference de Lima, Martineau and De Marchi 24 ). Biopsy cores of about 450 mg and with a 5 mm diameter were obtained with this technique. The skin incision was closed with a cruciate polydioxanone monofilament synthetic absorbable suture (PDS II 2-0 CP-1; Ethicon) and AluSpray (Neogen Corporation) was applied to the skin. An intramuscular dose (15 cc) of Excenel (Zoetis) was given immediately after the biopsy and once daily for 3 d to prevent infection. Rectal temperature, heart and respiratory rates, and mucous membrane colour were monitored every hour for 6 h after the biopsy.
Preparation of fatty acids and enterolactone for treatments
LA (Cat. no. 90150–100) and ALA (Cat. No. 90210–100) were purchased from Cayman Chemical. To increase FA solubility in the culture medium and facilitate cellular uptake, ALA and LA were individually complexed with FA-free bovine serum albumin (BSA) suitable for cell culture (Sigma-Aldrich). For conjugation, ALA or LA (10 mm) was added to FA-free BSA in William’s E Medium (WME) GlutaMAX, supplemented with 1×antibiotic antimycotic solution (Sigma-Aldrich), to obtain a 3:1 ratio of FA:BSA; this solution was then incubated at 37°C for 30 min on a stirring plate (95 % O2/5 % CO2) in a humidified incubator. The solution was freshly prepared and diluted in WME to required concentrations (Table 1) before being added to tissue cultures. ENL was purchased from Sigma-Aldrich and two stock solutions of 1 mm and 10 mm were prepared using pure ethanol purged with N. These solutions were kept at 4°C in darkness under an N atmosphere.
Table 1 Description of the experimental treatments used in bovine precision-cut liver slices tissue cultures
LA, linoleic acid (n-6); ALA, α-linolenic acid (n-3); ENL, enterolactone; CTR, control without FA and without ENL; FA, fatty acid; FA4, LA:ALA ratio of 4; FA15, LA:ALA ratio of 15; FA25, LA:ALA ratio of 25; E1, ENL 1 µm; E10, ENL 10 µm; E1FA4, ENL 1 µm+FA4; E10FA4, ENL 10 µm+FA4.
* The FA ratios represent the n-6:n-3 ratio (LA:ALA).
Preparation of precision-cut liver slices
Liver biopsies were kept on ice in a Petri dish, immediately transported to the laboratory and transferred into fresh ice-cold Krebs–Henseleit Buffer (KHB) modified (Sigma-Aldrich) at pH 7·4. KHB was supplemented to reach a final concentration of 5·5 mm CaCl2, 25 mm d-glucose, 25 mm NaHCO3 and 9 mm HEPES. The tissues were gently manipulated using a spatula to avoid damaging cells. Liver slices of 300 µm thickness and 4–5 mg wet weight were prepared from the cylindrical core biopsies using a Leica VT1000 S vibrating blade microtome (Leica Biosystems) filled with ice-cold KHB. Liver slices did not exceed 300 µm thickness so as to avoid tissue necrosis. The biopsy core was embedded in a 3 % low-gelling-temperature agarose type VII-A (Sigma-Aldrich) to get uniform liver slices and facilitate slicing. The agarose solution was pre-warmed in a 60°C water bath and then transferred to a 37°C bath for at least 15 min before proceeding with embedding( Reference de Graaf, Olinga and de Jager 22 ). The core biopsy was pierced with a needle at one end, soaked in the agarose solution and then allowed to solidify on ice for 10 min. Agarose-embedded biopsy cores were fixed on the microtome platform using cyanoacrylate glue for mounting specimens onto specimen discs (Leica Biosystems). Fresh and oxygenated KHB was then poured into the microtome cutting bath just before proceeding with slicing, ensuring that the whole biopsy core was completely submerged. Liver slices were collected immediately and transferred to a Petri dish containing fresh ice-cold KHB.
Incubation of liver slices
Bovine liver slices were incubated under sterile conditions in six-well plates containing 3·2 ml of WME/well. A maximum of three slices per well was used as the culture medium volume:the tissue surface ratio is of great importance for sufficient supply of nutrients and optimal exchange of O2 and CO2. To restore the ATP production and get rid of dead cells due to the slicing procedure, liver slices were first preincubated on a stirring plate (200 rpm) for 30 min at 37°C in a humidified incubator (95 % O2/5 % CO2). Liver tissue slices were then transferred to fresh WME and used for different assays using the same incubation conditions.
Integrity and viability assays
The cellular integrity of liver slices was assessed using the lactate dehydrogenase (LDH; EC 1.1.1.27) cell leakage method. LDH is a soluble cytosolic oxidoreductase enzyme that catalyses the interconversion of pyruvate and lactate. This enzyme is released in the culture medium upon cell death due to loss of plasma membrane integrity. Thus, LDH activity in the culture medium reflects the number of dead cells. In the current study, LDH activity was determined spectrophotometrically at 450 nm using a LDH activity assay kit (Sigma-Aldrich) following instructions provided by the manufacturer for ninety-six-well flat-bottom plates.
The LDH activity assay was first used to determine the optimal liver tissue incubation time over a 72-h period. At each time-point, 100 µl of cell culture medium from each well was collected and snap-frozen in liquid N2 (measure of extracellular LDH). The liver slices (one per well) and remaining medium were then collected and snap-frozen together in liquid N2 (measure of total LDH). To measure total LDH activity in liver tissue, the slices were sonicated directly in the culture medium with two pulses of 30 s (50 W) using a Q125 sonicator (Qsonica Sonicators). The LDH activity assay was also used to determine the cytotoxic effects of ALA (0, 100, 150, 300, 500 µm) and LA (0, 100, 150, 300, 500 µm) on bovine liver slices and to determine the optimal total FA concentration to be used in tissue culture. Each experiment was performed three–six times with one slice per well. Final results are presented as the percentage of cell death according to the following equation:
 $$\,\%\,\,{\rm Cell}\,{\rm death}\,{\equals}\,\left( {{\rm extracellular}\,{\rm LDH}\,/\,{\rm total}\,{\rm LDH}} \right){\times}{\rm 1}00.$$
Liver slice viability was also assessed immediately after the preparation of liver slices (0 h) and after 2, 4, 6, 8, 10, 12 and 24 h of incubation by measuring the ATP content, which reflects the cell ability as an energy source. After incubation, slices were transferred to 1 ml of the sonication solution (70 % ethanol and 2 mm EDTA), snap-frozen in liquid N2 and stored at –80°C. After thawing, slices were sonicated with a 30 s pulse set at 40 % amplitude using a Q125 sonicator and then centrifuged at 16 000 g for 2 min. To lower the ethanol concentration, the supernatant was diluted ten times with a buffer made of 0·1 m TRIS-HCl and 2 mm EDTA. The ATP content was measured using a CLSII ATP bioluminescence assay kit from Roche Diagnostics. The protein content of liver slices was determined using a bicinchoninic acid (BCA) assay kit from Sigma-Aldrich. ATP determination was performed in triplicate (three wells with one slice/well) and ATP content was expressed as pmol of ATP/µg of protein.
Cellular uptake of fatty acids
The LA and ALA concentrations in bovine liver slices were determined at the Université du Québec à Chicoutimi by Dr Milla Rautio using an Agilent 7890A GC-MS detection (Agilent Technologies). Incubations were performed using one slice per well and included a negative control (control without FA and without ENL) and two different treatments with either 300 µm LA or 300 µm ALA. Bovine liver slices were incubated under sterile conditions in six-well plates containing 3·2 ml WME/well on a stirring plate (200 rpm) for 10 h at 37°C in a humidified incubator (95 % O2/5 % CO2). Tissue samples were freeze-dried before complete FA extraction, methylation and quantification. The Sigma-Aldrich mix 37 FAME, the bacterial FA (BAME) and nonadecanoid acid (C19 : 0) were used as internal standards. Analysis was performed using the Agilent ChemStation software (Agilent Technologies) for peak identification and quantification, incorporating linear detection and quantification limit thresholds. Results are expressed as µg of FA/mg of dry tissue weight.
Bovine liver slice treatments
Bovine liver slices (three slices/well) were incubated in six-well plates containing 3·2 ml of WME per well. Plates were placed on a stirring plate (200 rpm) in a humidified incubator (95 % O2/5 % CO2) for a 30 min preincubation period at 37°C. The culture medium was then replaced with fresh WME (3·2 ml/well) supplemented with appropriate treatments (Table 1). Liver slices were incubated for 10 h under the same incubation conditions. On the basis of LDH and ATP viability assays (above), a 10 h incubation period was chosen to assess the FA and ENL treatment effects. At the end of the incubation period, liver slices were transferred to 1·5 ml Eppendorf tubes, snap-frozen in liquid N2 and kept at –80°C. Treatments were chosen according to previously reported physiological serum concentrations for dairy cows fed with a 10 % flaxseed supplementation (FA4), a Megalac®/normal control (FA15) or a 10 % sunflower seed supplementation that is rich in LA (FA25)( Reference Petit, Germiquet and Lebel 25 , Reference Lessard, Gagnon and Petit 26 ). Three different concentrations of ENL were also tested (0 µm ENL, 1 µm ENL (E1) or 10 µm ENL (E10)) either alone or in combination with FA (FA4). The E1 concentration was chosen as it corresponds to the physiological serum concentrations found in dairy cows fed with a supplement of flax hulls and oil( Reference Gagnon, Côrtes and da Silva 15 ). Treatments combining the effects of ENL and FA4 were included in order to mimic an in vivo situation of cows fed with 10 % flaxseed supplements( Reference Petit, Germiquet and Lebel 25 , Reference Lessard, Gagnon and Petit 26 ) and to detect potential synergetic effects.
RT-quantitativePCR analyses of selected genes
Total RNA was extracted from liver slices (five cows) using the NucleoSpin RNA/Protein kit (Macherey-Nagel) according to the manufacturer’s instructions. The RNA was then purified using RNA Clean & Concentrator-5 columns and the manufacturer’s >17-nucleotide-long protocol (Zymo Research). Afterwards, RNA was suspended in 15 μl of nuclease-free water. Total RNA integrity was then estimated using an Agilent 2100 Bioanalyser and the RNA 6000 Nano Kit (Agilent Technologies). Samples with RNA integrity numbers >5·5 were used for RT-quantitativePCR (qPCR) analyses. First strand complementary DNA (cDNA) was synthesised from 1·0 μg of RNA using the SuperScript II RT and oligo(dT)(12–18) as primers (Invitrogen Life Technologies) in a 20 μl reaction volume. Upon completion of cDNA synthesis, 10 μl of reaction volume was diluted (15×) using sterile water. This dilution was later used for RT-qPCR analyses. A 5× dilution was also prepared for standard curves required for RT-qPCR analyses. Amplification of selected genes and four reference genes (RG) was performed using bovine-specific primer sequences (Table 2) designed with the Primer Express software 3.0 (PE Applied Biosystems). Selected genes included markers of inflammation and oxidative stress and genes involved in FA metabolism. They also included genes known or suspected to be modulated in the livers of high-yielding Holstein cows during the transition period( Reference McCarthy, Waters and Kenny 27 ). Some of these genes have also been shown to be modulated by diets rich in n-3 FA and flax lignans (source of antioxidants)( Reference Palin, Côrtes and Benchaar 19 , Reference de Lima, Palin and Santos 28 ). Among these genes, major transcription factors such as MLX interacting protein like (MLXIPL), PPARA and sterol regulatory element-binding transcription factor 1 (SREBF1) and some of their target genes were prioritised. qPCR amplifications were carried out in a 10 μl reaction volume containing primers (final concentrations ranging from 150 to 900 nm, Table 2), 5 μl of 2× Power SYBR® Green Master Mix (PE Applied Biosystems), 3 μl of 15× diluted cDNA and 0·05 μl of AmpErase Uracil N-Glycosylase (PE Applied Biosystems). Cycling conditions were 2 min at 50°C followed by 10 min at 95°C and forty cycles of 10 s at 95°C and 45 s at 60°C. qPCR amplifications were performed in triplicate and standard curves were established in duplicate for each gene. Standard curves were composed of serial dilutions of cDNA pools as previously described( Reference Labrecque, Beaudry and Mayhue 29 ) and were used to obtain the relative mRNA abundance of selected genes using the standard curve method as described by Applied Biosystems( 30 ). Selection of the best stably expressed RG for normalisation of gene expression data was performed with the NormFinder software (http://moma.dk/normfinder-software)( Reference Andersen, Jensen and Ørntoft 31 ). For each experimental sample, the mRNA abundance of selected genes relative to that of RG was determined from corresponding standard curves. Mean values were calculated from triplicate amplifications and relative quantity ratios were then obtained by dividing the relative quantity unit of selected genes by those of RG. The ubiquitously expressed prefoldin like chaperone gene was identified as the best RG for normalisation of data sets in the present study. These values were then used for statistical analyses.
Table 2 Primer sequences used for quantitative real-time PCR analyses

GAPDH, glyceraldehyde 3-phosphate dehydrogenase; F, forward; R, reverse; PPIA, peptidylprolyl isomerase A; RSP9, ribosomal protein S9; UXT, ubiquitously expressed prefoldin like chaperone; ACACA, acetyl-CoA carboxylase α; CD36, cluster of differentiation 36; FASN, fatty acid synthase; GPX4, glutathione peroxidase 4; HP, haptoglobin; MGST3, microsomal glutathione S-transferase 3; MLXIPL, MLX interacting protein like; NFE2L2, nuclear factor (erythroid-derived 2)-like 2; NQO1, NAD(P)H dehydrogenase quinone 1; PON1, paraoxonase 1; PRDX3, peroxiredoxin 3; PRDX4, peroxiredoxin 4; PTGS2, PG-endoperoxide synthase 2; SAA3, serum amyloid A3; SCD, stearoyl-CoA desaturase; SOD1, superoxide dismutase 1; SOD2, superoxide dismutase 2; SREBF1, sterol regulatory element-binding transcription factor 1.
Superoxide dismutase activity
Liver biopsies of five cows were used to measure the activity of SOD (EC 1.15.1.1). For each treatment (Table 1), one liver slice was homogenised using a Polytron homogenizer (POLYTRON® PT 10-35 GT; Kinematica) at 18 000 rpm for 10 s in 350 µl of cold 20 mm HEPES buffer (pH 7·2) containing 1 mm EGTA, 210 mm mannitol and 70 mm sucrose. Samples were then centrifuged at 1500 g for 5 min (4°C). Supernatant was collected and diluted 40-fold with 50 mm TRIS-HCl (pH 8·0). Total SOD activity (SOD Assay kit 706002; Cayman Chemical) in liver slices was determined enzymatically by measuring the production of superoxide radicals generated by xanthine oxidase and hypoxanthine at 450 nm. For this assay, one unit of SOD activity is defined as the amount of enzyme required to get 50 % dismutation of the superoxide radical. The background absorbance was subtracted and the average absorbance of each standard and sample was used for activity calculations. Total protein concentration in the tissue was determined with the BCA protein assay (Sigma-Aldrich). Analyses were performed in duplicate and results expressed as SOD activity (units) per mg of protein.
Oxidative stress damage measurements
Liver tissue slices from five cows (same cows as for SOD analysis) were used for thiobarbituric acid (TBA) reactive substances (TBARS) and protein carbonyl analyses. Two liver slices per treatment (Table 1) were sonicated in 350 µl of 1×PBS (pH 7·4) containing a 1× protease inhibitor cocktail (Sigma-Aldrich). Sonication was performed with six 10 s pulses set at 25 % amplitude, using a Q125 sonicator. Liver tissue homogenates were then centrifuged at 5000 g for 5 min at 4°C and the supernatant was used for TBARS and protein carbonyl analyses. Total protein concentration was determined as described above.
Thiobarbituric acid reactive substances assay
The OXItek TBARS assay kit (ZeptoMetrix Corporation) was used to assess lipid peroxidation in liver slices. A standard curve was prepared by diluting the malondialdehyde (MDA) standard 1:10 in MDA diluent and a series of eight standards was prepared (10, 5, 4, 3, 2, 1, 0·5, 0 nmol MDA/ml). Thereafter, 40 µl of an SDS solution were added to 40 µl of standard or supernatant from liver homogenates (see above). A volume of 1 ml of TBA/buffer reagent was added to each tube and briefly vortexed. Samples were incubated for 60 min in a water bath set at 95°C to allow colour development and further cooled on ice for 10 min. For the standard curve, 200 µl of the reaction mixture was immediately transferred to ninety-six-well black microplates and fluorescence was monitored with excitation set at 530 nm and emission at 550 nm. For higher sensitivity, the reaction product (for samples) was extracted with an equivalent volume of 1-butanol (Sigma-Aldrich) and vigorously vortex shaken. The MDA–TBA containing supernatant was then transferred to a 12×75 mm glass tube and completely evaporated overnight using a vacuum concentrator (Labconco). The MDA–TBA reaction product was resuspended in 250 µl of ddH2O, and 200 µl of this solution was transferred to ninety-six-well black microplates to measure MDA equivalents on the basis of fluorescence as described above. Results (duplicates) were multiplied by the concentration factor and expressed as nmol of MDA/mg of protein.
Protein carbonyl assay
Protein carbonyls were analysed spectrophotometrically using the OxiSelectTM Protein Carbonyl ELISA kit (Cell Biolabs, Inc.) following the manufacturer’s instructions. Duplicate samples of protein (10 μg/ml) and reduced/oxidised BSA standards were allowed to adsorb overnight at 4°C to ninety-six-well protein binding plates and to react with dinitrophenylhydrazine. The protein carbonyls present in samples or standards were derivatised to dinitrophenylhydrazone (DNP) and probed with an anti-DNP antibody (1:1000), followed by an incubation with HRP-conjugated secondary antibodies (1:1000). Absorbance was read at 450 nm and the protein carbonyl content was determined by comparing absorbance with the protein carbonyl BSA standard curve. Results were expressed as nmol of protein carbonyl/mg of protein.
Statistical analyses
The MIXED procedure of SAS (2002; SAS Institute, Inc.) was used for statistical analyses. A one-way ANOVA was first carried out for the FA toxicity assay and comparisons of FA treatments with the control (no FA) were performed using a Dunnett adjustment. A one-way ANOVA was also used to analyse data related to cellular uptake of FA and all-pairwise multiple comparisons were applied using a Tukey correction. Liver slices were exposed to eight different treatments that were repeated twice for each cow (four to five cows in total). Relative mRNA abundance for the different FA ratios (FA4, FA15 and FA25), SOD, TBARS and protein carbonyls data were analysed globally for all treatments using a one-way ANOVA and comparisons with the control treatment were performed using a Dunnett adjustment. These data were also analysed separately according to a 2×3 factorial arrangement with ENL (0 µm, E1 or E10) and FA (no added FA or 20 µm-FA4) concentrations as the main effects. When a FA×ENL interaction was detected, a separate analysis was applied to determine the effect of FA for each level of ENL (SLICE option of the LSMEANS statement). Statistical significance was set at P≤0·05 and tendencies at 0·05<P≤0·10.
Results
Integrity and viability assays
To determine the optimal incubation time for bovine liver tissue cultures, an LDH assay was performed (results not shown). LDH activity in the culture medium remained quite low after 2, 4, 6 and 8 h of incubation, with estimated cell death percentages ranging from 7·4 to 7·7 %. After 10 and 12 h of incubation, a slight increase in cell death percentage was observed (12·9 and 13·5 %, respectively). After 24, 48 and 72 h of incubation, there was a significant loss of bovine liver tissue integrity as demonstrated by cell death percentages of 61·3, 67·9 and 84·1 %, respectively. These results indicate that cellular integrity is maintained for 12 h when liver slices are incubated in six-well plates under the conditions of the present experiment.
The optimal incubation time was also determined by measuring the ATP content in liver tissue (results not shown). Bovine liver slices remained viable up to 10 h with ATP content values ranging from 9·90 (sem 1·23) to 12·58 (sem 0·04) pmol/µg protein. Incubation periods of 12 and 24 h resulted in ATP content values of 5·11 (sem 0·45) and 3·77 (sem 0·45) pmol/µg protein, respectively. These values were similar to those observed in negative controls. On the basis of the LDH and ATP assays, it was decided to use a 10 h incubation period for all experiments presented in this study.
Cytotoxicity assay
The LDH activity assay was also used to determine whether exposure to different FA concentrations could have cytotoxic effects on bovine liver slices after a 10 h incubation period (results not shown). Cummings et al.( Reference Cummings, Wills and Schnellmann 32 ) previously recommended that control values for percent LDH release should be <10 %, which is the case in the current study with cell death percentages of 6·1 and 5·6 % for the 0 µm LA and 0 µm ALA treatments, respectively. Statistical analyses showed that the addition of 500 µm of LA and 500 µm of ALA increased cell death percentage (P<0·01; 13·1 and 14·1 %, respectively) when compared with the control. The addition of 300 µm ALA in the culture media also increased the cell death percentage (P<0·01; 12·1 %) when compared with the control treatment. Cell death percentages for the other LA (100, 150 and 300 µm) and ALA (100 and 150 µm) concentrations were not different from control values (P>0·05). Even though a significant difference was observed between 0 and 300 µm of ALA, cell death percentage was only 6·6 % after subtracting the 0 µm control value. Therefore, the 300 µm FA concentration was selected for both LA and ALA to ensure that enough FA was delivered to liver slices while maintaining low cell death percentages.
Cellular uptake of fatty acids
To ensure that culture conditions enable FA present in the medium to penetrate liver cells, a GC-MS analysis was performed. Liver tissue slices were incubated for 10 h under the same conditions mentioned above and with 300 µm total FA (LA or ALA). When 300 µm of LA was added to the culture medium (Fig. 1(a)), the LA concentration in liver tissue increased from 2·61 (sem 0·31) µg/mg of tissue for the control with no added FA to 5·11 (sem 0·15) µg/mg of tissue for the one exposed to LA (P<0·01), and ALA concentration was similar for both treatments. Incubation of liver slices with 300 µm of ALA (Fig. 1(b)) increased ALA concentration from 0·29 (sem 0·07) µg/mg for the control with no added FA to 3·16 (sem 0·16) µg/mg of tissue (P<0·01), and there was no difference in LA concentration. These results showed that a 10 h incubation period was sufficient to allow penetration of FA (300 µm LA or ALA) in liver tissue. The FA analysis of liver tissue slices treated with ALA also revealed a significant increase in EPA (C20 : 5n-3) when compared with the control treatment (P<0·01; with 0·182 and 0·129 (sem 0·009) µg/mg tissue, respectively). Arachidonic acid (C20 : 4n-6) did not differ between LA and control treatments (P>0·05; 0·978 and 0·884 (sem 0·058) µg/mg tissue, respectively). There was no difference between treatments for the other analysed FA.

Fig. 1 Linoleic acid (LA) and α-linolenic acid (ALA) concentrations in bovine liver slices exposed to 300 µm of LA (a) and 300 µm of ALA (b). Bovine liver slices were collected after 10 h of incubation and fatty acids (FA) quantified by GC-MS. ![]() , Negative controls incubated without additional FA;
, Negative controls incubated without additional FA; ![]() , liver slices exposed to LA or ALA. Values are least-square means of triplicates (one slice per well), with standard errors represented by vertical bars (µg of FA/mg of dry tissue weight). *** P<0·01, compared with the control.
, liver slices exposed to LA or ALA. Values are least-square means of triplicates (one slice per well), with standard errors represented by vertical bars (µg of FA/mg of dry tissue weight). *** P<0·01, compared with the control.
Effects of different fatty acid ratios and enterolactone on the relative mRNA abundance of selected genes in bovine liver slices
To determine which flaxseed component (flax oil (n-3), lignans (ENL) or both) affect the liver mRNA abundance of studied genes, different n-6 (LA):n-3 (ALA) FA ratios and ENL concentrations were assayed in our PCLS tissue culture model. The global analysis of the relative mRNA abundance data of all treatments revealed an overall treatment effect (P<0·05) for the cluster of differentiation 36 (CD36), fatty acid synthase (FASN), MLXIPL, PG-endoperoxide synthase 2 (PTGS2) and stearoyl-CoA desaturase (SCD) genes, and a trend (P<0·10) for acetyl-CoA carboxylase α (ACACA) and SOD2 genes (results not shown). There was no overall treatment effect for the other tested genes. Each FA ratio (FA4, FA15 and FA25) treatment was then compared with the control (data not shown). The FA4 and FA15 treatments tended (P=0·066 and 0·053, respectively) to increase SOD1 mRNA abundance when compared with the control. There was no FA effect for the other studied genes when compared with the control.
Table 3 presents the significant results on the effect of ENL, alone or in combination with FA4, for the selected genes. The addition of ENL to the culture media decreased mRNA expression of the CD36 (P<0·01) gene, whereas it increased the transcript abundance of FASN (tendency, P=0·064) and SCD (P<0·05). There was an FA effect on the expression of several studied genes. Indeed, the presence of FA (FA4) in culture media decreased the mRNA abundance of ACACA (P<0·05), FASN (P<0·01), glutathione peroxidase (GPX)4 (GPX4) (P=0·05), SCD (tendency, P=0·099) and SREBF1 (tendency, P=0·073) genes in liver tissue. On the other hand, the addition of FA (FA4) increased the mRNA abundance of NAD(P)H dehydrogenase quinone 1 (NQO1) (tendency, P=0·081), peroxiredoxin 3 (PRDX3) (P<0·05), PTGS2 (P<0·05) and SOD1 (tendency, P=0·070) genes. There was an FA by ENL interaction for MLXIPL (P=0·01) and SOD2 (P<0·05) genes. When FA was omitted, the addition of 1 µm or 10 µm of ENL increased the MLXIPL mRNA abundance (P=0·060 for 1 µm; P<0·01 for 10 µm), whereas this effect disappeared when FA (FA4) was added with ENL. A similar result was observed for the SOD2 gene, with higher mRNA abundance values observed when E10 (but not E1) was added alone to culture media (P<0·05) and this effect was lost with the addition of FA.
Table 3 Effects of enterolactone (ENL) with or without fatty acids (FA) (linoleic acid (LA):α-linolenic acid (ALA) ratio 4:1) on the mRNA abundance of studied genes in bovine precision-cut liver slicesFootnote * (Least-square means with their maximum standard errors)

FA4, 240 µm LA+60 µm ALA; E0, ENL 0 µm; E1, ENL 1 µm; E10, ENL 10 µm; ACACA, acetyl-CoA carboxylase α; CD36, cluster of differentiation 36; FASN, fatty acid synthase; GPX4, glutathione peroxidase 4; MLXIPL, MLX interacting protein like; NQO1, NAD(P)H dehydrogenase quinone 1; PRDX3, peroxiredoxin 3; PTGS2, PG-endoperoxide synthase 2; SCD, stearoyl-CoA desaturase; SOD1, superoxide dismutase 1; SOD2, superoxide dismutase 2; SREBF1, sterol regulatory element-binding transcription factor 1.
* Relative mRNA abundance in precision-cut liver slices culture performed in duplicate and from five cows. Results were compared with a 3×2 factorial arrangement.
Superoxide dismutase activity
There was a global treatment effect on SOD activity (P<0·01; results not shown). When treatments were compared with the control, a significant increase in SOD activity was observed for the FA4 treatment (P<0·05), whereas the FA15 treatment tended to increase (P=0·099) SOD activity (Fig. 2(a)). SOD activity did not differ when other treatments were compared with the control. When data were analysed according to a 2×3 factorial arrangement, an FA by ENL interaction (P=0·001) was observed for SOD activity (Fig. 3(a)); the addition of FA (FA4) to culture media increased SOD activity (P<0·05) in the absence of ENL, whereas the addition of E1 to FA (FA4) resulted in SOD activities similar to control values. The addition of E10 to FA (FA4) decreased the SOD activity, when compared with the E10FA0 treatment.
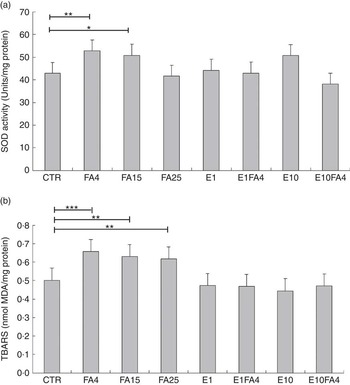
Fig. 2 (a) Superoxide dismutase (SOD) activity and (b) thiobarbituric reactive substances concentrations (TBARS) in bovine liver slices after 10 h of exposure to eight different treatments. CTR, control without fatty acids (FA) and without enterolactone (ENL); FA4, 240 µm linoleic acid (LA)+60 µm α-linolenic acid (ALA); FA15, 281·25 µm LA+18·75 µm ALA; FA25, 288·45 µm LA+11·55 µm ALA; E1, 1 µm ENL; E1FA4, 1 µm ENL+FA4; E10, 10 µm ENL; E10FA4, 10 µm ENL+FA4. a: values are least-square means (n 5 cows) of SOD activity (in duplicate), with maximum standard errors represented by vertical bars (units/mg of protein); b: values are least-square means (n 5 cows) of TBARS (in duplicate), with maximum standard errors represented by vertical bars (nmol malondialdehyde (MDA)/mg of protein). * P<0·1, ** P<0·05, *** P<0·01, compared with the control.

Fig. 3 Interactions between fatty acids (linoleic acid (LA):α-linolenic acid (ALA) ratio of 4 (FA4)) and enterolactone (ENL) treatments for (a) superoxide dismutase (SOD) activity and (b) thiobarbituric reactive substances concentrations (TBARS). Treatments: E0, 0 µm ENL; E1, 1 µm ENL; E10, 10 µm ENL. a: values are least-square means (n 5 cows) of SOD activity (in duplicate), with maximum standard errors represented by vertical bars (units/mg of protein); b: values are least-square means (n 5 cows) of TBARS (in duplicate) with their maximum standard errors represented by vertical bars (nmol malondialdehyde (MDA)/mg of protein). ![]() , Fatty acids (FA) omitted;
, Fatty acids (FA) omitted; ![]() , addition of FA (FA4). ** P<0·05, *** P<0·01.
, addition of FA (FA4). ** P<0·05, *** P<0·01.
Thiobarbituric acid reactive substances and protein carbonyl assays
There was a global treatment effect (P<0·001) on TBARS concentrations (results not shown). When values were compared with the control, a significant increase in TBARS concentrations was found for FA4 (P<0·01), FA15 (P<0·05) and FA25 (P<0·05) treatments (Fig. 2(b)). The TBARS concentrations observed for the E1, E1F4, E10 and E10FA4 treatments were similar to those found in the control (Fig. 2(b)). There was an FA by ENL interaction (P<0·05) for TBARS values (Fig. 3(b)) when analysing data according to a 2×3 factorial arrangement. When ENL was omitted from the culture medium (E0), the addition of FA (FA4) significantly increased (P<0·01) the concentration of TBARS in liver tissue compared with the control treatment with no ENL and no FA, and this difference disappeared when 1 µm or 10 µm of ENL was added to FA (FA4). There was no treatment effect for protein carbonyl concentrations in bovine liver slices (results not shown).
Discussion
In dairy cows, important metabolic changes occur during the transition period, more particularly during early lactation when animals experience NEB( Reference Drackley 33 ). This NEB alters many biochemical pathways in the liver( Reference Loor, Everts and Bionaz 34 ) and is associated with an increased risk for developing systemic inflammation, metabolic stress and immune dysfunction in high-producing dairy cows( Reference Trevisi, Amadori and Cogrossi 6 , Reference Gessner, Schlegel and Keller 35 ). Supplementing multiparous Holstein cows with 10 % whole flaxseed (rich in n-3 FA) reduces NEB in early lactation when compared with cows receiving Energy Booster® (rich in SFA)( Reference Petit, Palin and Doepel 8 ), and this was associated with reduced plasma NEFA, decreased concentrations of TAG and total lipids in the liver and a lower incidence of hepatic steatosis( Reference Petit, Palin and Doepel 8 ). Previous studies have also reported that flaxseed components (e.g. n-3 FA, lignans or both) can modulate the expression of lipogenic( Reference Palin, Côrtes and Benchaar 19 ) and antioxidant( Reference Côrtes, Palin and Gagnon 16 ) genes in the mammary tissue of dairy cows; however, this has never been investigated in hepatic tissue. The current study was undertaken to better characterise the effects of flaxseed components on markers of oxidative stress, inflammation and lipid metabolism in the liver tissue of high-producing dairy cows. An in vitro PCLS model was chosen for this study as all hepatic cell types are represented and cell–cell and cell–matrix interactions are maintained. Our results clearly showed that a 10 h incubation period is sufficient to allow LA and ALA absorption in liver tissue slices and that the addition of 300 µm of LA or ALA to the culture media resulted in low cytoxicity. As observed in the current study, loss of cell integrity has been previously reported for incubation periods exceeding 10 h for bovine and deer PCLS cultures( Reference Sivapathasundaram, Howells and Sauer 36 ). In accordance with our results, Kaur et al.( Reference Kaur, Sinclair and Cameron-Smith 37 ) previously demonstrated that a short-term incubation period (8 h) of FAO hepatoma cells was sufficient to incorporate 50 µm of EPA, DHA and DPA into phospholipids and to down-regulate SREBF1, FASN and ACACA transcript abundance( Reference Kaur, Sinclair and Cameron-Smith 37 ).
When analysing gene expression data according to a 2×3 factorial arrangement, results indicated that the addition of LA and ALA (FA4) to the culture media reduced the mRNA abundance of the lipogenic transcription factor SREBF1 and its downstream target genes ACACA, FASN and SCD, suggesting lower lipogenic activity. SREBF1, also known as SREBP-1c, is a transcription factor that regulates the expression of genes involved in FA and cholesterol metabolism( Reference Eberlé, Hegarty and Bossard 38 ). This transcription factor is activated by insulin in rat hepatocytes and its overexpression causes fat accumulation in mouse livers( Reference Bécard, Hainault and Azzout-Marniche 39 ). In accordance with our results, it has been shown that the expression of SREBF1 transcript is reduced in the liver of mice fed high concentrations of PUFA( Reference Nakatani, Kim and Kaburagi 40 ). Moreover, an in vitro study demonstrated that SREBF1 gene silencing decreases lipid synthesis and TAG content in bovine hepatocytes( Reference Deng, Li and Fu 41 ). Our results suggest that supplementing cows with LA and ALA PUFA during the transition period may result in decreased hepatic SREBF1 gene expression along with its downstream lipogenic genes.
The MLXIPL transcription factor is activated by glucose and highly expressed in insulin-sensitive tissues such as the liver, adipose tissue and muscle( Reference Filhoulaud, Guilmeau and Dentin 42 ). In the liver, it is estimated that MLXIPL contributes to about half of the de novo lipogenesis( Reference Iizuka 43 ). MLXIPL deficiency decreases lipogenesis in the mouse liver and reduces liver TAG concentration and the occurrence of fatty liver syndrome( Reference Dentin, Benhamed and Hainault 44 ). Using a mouse primary hepatocyte cell culture model, Dentin et al. ( Reference Dentin, Girard and Postic 45 ) clearly demonstrated that the addition of LA, EPA and DHA decreases the expression of MLXIPL, SREBF1 and FAS genes in cells exposed to high concentrations of glucose and insulin. In our study, MLXIPL gene expression increased with the addition of ENL in culture media, but this effect was suppressed when FA (FA4) was combined with ENL. An increase in the mRNA abundance of MLXIPL downstream lipogenic genes, FASN and SCD, was also observed with the addition of ENL. This agrees with the increase in FASN and SCD transcript abundance that has been previously observed in the mammary tissue of dairy cows supplemented with flax hulls, a rich source of plant lignans( Reference Palin, Côrtes and Benchaar 19 ). Our results suggest that supplementing early-lactating cows with ENL or with diets rich in flax lignans may exacerbate the risk for developing fatty liver although the addition of LA and ALA may alleviate this risk.
The membrane-bound CD36 protein is involved in the translocation of long-chain FA in the liver( Reference Canbay, Bechmann and Gerken 46 ) and its gene expression is positively related to fatty liver development in cows( Reference Bradford, Mamedova and Minton 47 , Reference Prodanović, Korićanac and Vujanac 48 ). Lower CD36 transcript levels observed with the addition of ENL agrees with the results of several studies on plants polyphenols. For example, the addition of high concentrations of curcumin to human hepatoma cells HepG2 reduced the mRNA abundance of CD36 ( Reference Peschel, Koerting and Nass 49 ). Using a primary rat enterocyte cell culture model, Qin et al. ( Reference Qin, Dawson and Schoene 50 ) observed a reduction in CD36 mRNA levels when treating cells with cinnamon polyphenols. Altogether, these results suggest that plant polyphenols such as ENL may contribute to reduce gene expression of CD36 in the cow liver, which may decrease hepatic lipid accumulation.
Oxidative damage can be prevented by the host antioxidant defense system, which includes antioxidant enzymes such as SOD and GPX, or by antioxidants provided by the diet. In the current study, the addition of LA and ALA (FA4, FA15 and FA25) to PCLS culture media increased cellular lipid peroxidation, and the addition of ENL was effective in preventing lipid peroxidation promoted by these PUFA. Higher plasma lipid peroxidation has been observed in dairy cows supplemented with extruded linseeds (rich in n-3 PUFA) and plant extracts rich in polyphenols protected them against lipid peroxidation( Reference Gobert, Martin and Ferlay 11 ). Plasma and liver peroxidation were also decreased in dairy cows that were supplemented with polyphenol-rich chestnut tannins( Reference Liu, Zhou and Li 51 ). The observed beneficial effect of ENL on hepatic lipid peroxidation may be related to its hydroxyl and peroxyl radical scavenging activities( Reference Touré and Xueming 14 ). SOD activity results further suggest that a decrease in cellular oxidative stress conditions as a result of ENL supplementation may lower the requirement for endogenous antioxidants. Indeed, higher SOD activity values were obtained with the addition of LA and ALA (FA4 and FA15) to culture media, whereas the addition of ENL to FA (FA4) resulted in SOD activities similar to those observed in the control. A similar effect was found for SOD1 mRNA abundance, with increased gene expression in liver tissue exposed to LA and ALA and expression levels similar to control values when ENL was added with these PUFA (FA4). The reason why this is only observed for SOD1 transcript abundance, and not for SOD2, remains to be determined. However, one might hypothesise that a reduction in cellular hydroxyl and peroxyl radicals induced by ENL would reduce activation of the redox-sensitive transcription factor nuclear factor erythroid 2-related factor 2 (Nrf2), which is encoded by the NFE2L2 gene. Nrf2 is located in the cytoplasm and in conditions of oxidative stress is translocated into the nucleus where it binds to antioxidant response elements (ARE) located in promoter regions of several target genes( Reference Kaspar, Niture and Jaiswal 52 ). The presence of an ARE in the SOD1 promoter but not in SOD2 ( Reference Miao and St Clair 53 ) may explain the different mRNA abundance profiles observed in the current study. Although the NFE2L2 transcript abundance was not affected by treatments in PCLS, this does not rule out the possibility of a treatment effect on Nrf2 translocation in the nucleus. Therefore, additional experiments are needed to determine whether LA and ALA and/or ENL can affect Nrf2 translocation activity in the liver and to further characterise oxidative stress pathways affected by these PUFA. In addition to SOD1, the mRNA abundance of three other Nrf2 target genes (NQO1, PTGS2 and PRDX3)( Reference Chorley, Campbell and Wang 54 , Reference Miyamoto, Izumi and Miyamoto 55 ) was increased with the addition of LA and ALA (FA4) to the culture media. The NQO1 gene encodes for a NAD(P)H-dependent quinone reductase, which catalyses two-electron reduction reactions of several substrates, including the quinones( Reference Ross and Siegel 56 ). Under oxidative stress, the expression of this phase II detoxifying enzyme increases to prevent the formation of free radicals and protect cells against oxidative damage( Reference Ross and Siegel 56 ). The NQO1 mRNA abundance is highly increased in hepatic tissue of dairy cows in early lactation (weeks 1 and 5 postpartum), a period associated with greater oxidative stress( Reference Gessner, Schlegel and Keller 35 ). In accordance with results from the current study, van Beelen et al. ( Reference van Beelen, Aarts and Reus 57 ) observed an increase in NQO1 mRNA abundance when n-3 PUFA (EPA and DHA) were added to a mouse Hepa-1c1c7 hepatocyte cell line. Interestingly, these authors also demonstrated that the oxidation of n-3 PUFA is needed to induce the expression of ARE-regulated genes, a result consistent with our observation of simultaneous increases of oxidative damage to lipids (TBARS) and NQO1 mRNA abundance with the addition of LA and ALA (FA4). Increased TBARS formation and PTGS2 protein abundance were observed in the liver of mice fed a high-fat diet( Reference Kim, Kim and Kim 58 ). Similar effects on TBARS and PTGS2 mRNA abundance were observed when LA and ALA (FA4) were added to PCLS culture media. The induction of PTGS2 transcript abundance by PUFA is not limited to liver tissue as we have previously reported a similar increase in PTGS2 gene expression in bovine endometrial stromal cell cultures( Reference Hallé, Goff and Petit 59 ). Observed effects of LA and ALA on PTGS2 mRNA abundance may also be related to inflammatory processes as the cyclo-oxygenase-2 protein, the product of the PTGS2 gene, is a primary target of nonsteroidal inflammatory drugs and as PTGS2 gene expression is known to be activated by pro-inflammatory cytokines( Reference Ricciotti and FitzGerald 60 ). However, results from this study rather suggest that the addition of LA and ALA to bovine liver tissue slices had limited effect on inflammatory processes as haptoglobin and serum amyloid A3 gene expression, two positive acute phase proteins that are up-regulated with increased inflammation, were not affected by PUFA treatments. PRDX3 is a thioredoxin-dependent peroxidase that is ubiquitously expressed in bovine tissues( Reference Leyens, Donnay and Knoops 61 ) and located in the mitochondria, where up to 90 % of the cellular production of ROS occurs( Reference Murphy 62 ). This peroxidase acts as a key regulator of intracellular H2O2 ( Reference Cox, Peskin and Paton 63 ). The addition of DHA to murine hippocampal HT22 cells increases the levels of lipid peroxides and PRDX3 gene expression by 30 %, whereas ARA has no effect( Reference Casañas-Sánchez, Pérez and Fabelo 64 ). In agreement with these results, the addition of LA and ALA (FA4) to bovine liver tissue slices increased damages to lipids and PRDX3 transcript levels. The reasons why peroxiredoxin 4, a known Nrf2 target gene, was not affected by these PUFA are unclear.
GPX4 is unique among members of the GPX family as it can directly reduce hydroperoxides in complex lipids such as phospholipids and cholesterol( Reference Imai and Nakagawa 65 ). Transgenic mice overexpressing GPX4 present reduced liver damages and lipid peroxidation after exposure to pro-oxidants( Reference Ran, Liang and Gu 66 ). Higher lipid peroxidation with the addition of LA and ALA (FA4) to PCLS was expected to increase GPX4 mRNA abundance; however, lower abundance was observed. Lower GPX1 and GPX3 mRNA abundance was also observed in the mammary gland of dairy cows supplemented with flax oil, but there was no effect on GPX activity( Reference Côrtes, Palin and Gagnon 16 ). Using a human umbilical vein endothelial cell model, Sneddon et al. ( Reference Sneddon, Wu and Farquharson 67 ) previously demonstrated that DHA (n-3) increases GPX4 mRNA abundance, whereas ARA (n-6) has no effect. In the same study, GPX4 activity decreased with the addition of DHA, thus suggesting a potential posttranslational regulation induced by n-3 FA. A decrease in GPX activity and an increase in lipid peroxidation were also observed in the liver of rats supplemented with flax oil or fish oil( Reference Ramaprasad, Baskaran and Krishnakantha 68 ).
In the present study, oxidative damages to proteins were also investigated by measuring protein carbonyl levels. Protein carbonyl compounds can be formed through different mechanisms such as lipid-derived ROS( Reference Estevez 69 ). As the addition of LA and ALA PUFA (FA4, FA15 and FA25) to PCLS culture media increased lipid peroxidation, an increase in protein carbonyls was expected. However, our results showed that protein carbonyls were not affected by the addition of LA and ALA (FA4, FA15 and FA25). One possible reason for the lack of effect is that the 10 h incubation period used in this study may be enough to detect damages to lipids but not to proteins as accumulating lines of evidence suggest that lipid oxidation progresses faster than protein oxidation( Reference Estevez 69 , Reference Lund, Hviid and Skibsted 70 ). Further work is needed to confirm whether longer incubation periods with LA and ALA would result in increased protein carbonyl content.
In conclusion, results from this study suggest that the addition of ALA (n-3) and LA (n-6) PUFA to bovine liver slice cultures increases oxidative damage to lipids and that this effect can be alleviated with the addition of the mammalian lignan ENL. Simultaneous increases in lipid peroxidation and transcript abundance of Nrf2 target genes SOD1, NQO1, PTGS2 and PRDX3 with the addition of LA and ALA further suggest an increase in oxidative stress promoted by these PUFA. Our results also suggest that the addition of LA and ALA to PCLS decreases liver lipogenic activity as demonstrated by lower expression levels of the transcription factor SREBF1 and its lipogenic target genes ACACA, FASN and SCD. Conversely, ENL increased the expression of lipogenic genes MLXIPL, FASN and SCD, thus suggesting that supplementing flax lignans alone to early-lactating cows could exacerbate TAG accumulation in the liver.
Acknowledgements
The authors express their gratitude to the staff of the Sherbrooke Research and Development Centre for their contribution to the present study. Special thanks to Danielle Beaudry for technical assistance and Steve Méthot for his help with statistical analyses. The authors thank Dr Éric Martineau for performing liver biopsies and all employees of the dairy product centre for taking care of the cows during the project.
The present study was funded by Agriculture and Agri-Food Canada (grant no. J-000078).
E. F. conducted laboratory analyses and wrote the manuscript. R. B., J. L., H. V. P. and M.-F. P. participated in the interpretation of data and in manuscript revision. J. L., H. V. P. and M.-F. P. participated in study design. M.-F. P. supervised the project and assisted in the writing of the manuscript. All authors were involved in the writing and revision of this paper and approved the final version of the manuscript.
The authors declare that there are no conflicts of interest.


