


The ability to accurately assess diet is of paramount importance in establishing nutrition-related disease risks and evaluating the effectiveness of public health interventions. Established methods of dietary assessment such as weighed food diaries, 24 h recalls and FFQ present a challenge to researchers due to their inherent limitations(Reference Buzzard and Willett1–Reference Barrett-Connor4). Retrospective methods suffer from reliance on respondent memory(Reference MacIntyre, Gibney, Vorster and Kok3), potential recall bias(Reference Buzzard and Willett1) and misreporting(Reference Black, Prentice and Goldberg5), and prospective methods can place a high burden on the respondent and risk an alteration of habitual intake(Reference Rebro, Patterson and Kristal6). Nutritional coding of the data collected by these traditional methods requires a trained individual and can be extremely time consuming(Reference Buzzard and Willett1).
There is a growing interest in the use of information communication technology to assist dietary assessment. Automated systems have the potential to improve the accuracy of data collected, reduce costs, provide immediate feedback and reduce respondent and researcher burden by automating the nutritional coding process(Reference Ngo, Engelen and Molag7). Studies investigating innovative technologies for dietary assessment have included computerised methods such as automated self-administered 24 h recalls(Reference Touvier, Kesse-Guyot and Mejean8–Reference Zoellner, Anderson and Gould10) and FFQ(Reference Slattery, Murtaugh and Schumacher11), personal digital assistants (PDA)(Reference Beasley, Riley and Jeanmary12–Reference Boushey, Kerr and Wright16), camera-enabled cellphones(Reference Martin, Han and Coulon17) and smartcards(Reference Lambert, Plumb and Looise18). A review of information communication technology methods for dietary assessment concluded that these methods have potential to accurately measure dietary intakes; however, further work is necessary for improving and evaluating established and new tools(Reference Ngo, Engelen and Molag7).
Handheld technology such as PDA and mobile phones offers the particular advantage of portability, allowing the user to conveniently record diet data in real time. ‘DietMatePro’, a PDA food diary program, was found to correlate well with a 24 h recall (r 0·71, P< 0·005) in a small sample but correlated less well in a larger sample of 174 overweight adults (r 0·54, P< 0·05). Another assessment tool ‘Wellnavi’ is a handheld PDA device with a mobile sim card and camera, which allows participants to photograph their food and send to a dietitian for analysis(Reference Wang, Kogashiwa and Kira15). In a comparison study of the Wellnavi method with a weighed food diary in seventy-five adults, statistically significant correlations between macronutrients and some micronutrients have been reported (e.g. r 0·62 for energy (kJ and kcal), P< 0·001). However, some micronutrients were underestimated by the PDA when compared with the reference measure.
As technology evolves, there is potential to develop increasingly sophisticated assessment tools and PDA devices have been improved upon by smartphones. Along with basic telephony functions, smartphones have enhanced computational abilities enabling them to connect to the Internet and run a complete operating system. A smartphone application, which permits self-monitoring of food and drink intake, offers promise as a convenient and cost-effective dietary assessment tool. My Meal Mate (MMM) is a smartphone application that has been designed to facilitate weight loss and is currently being piloted in a sample of overweight adults. This validation study aims to evaluate whether MMM also has potential as a dietary assessment tool by validating it against a reference method.
Experimental methods
MMM features an electronic food diary in which users select and log foods from a 40 000-item commercial food database that includes generic and branded items(19). MMM has usability features to enhance this process such as the ability to store favourite meal combinations, take photographs of foods to act as a memory prompt and store recently used items. MMM provides instant feedback on self-reported energy intake and estimated expenditure. Food items recorded on the application are uploaded to a secure administrator website for further analysis of macronutrient intake. The application runs on an Android operating system. Participants were provided with a HTC Desire smartphone (with the MMM application pre-downloaded) for use during the validation study (see Figs 1 and 2 for sample screen shots from the application). The phone had a pre-paid data tariff in order to upload the data collected to the back-end website.
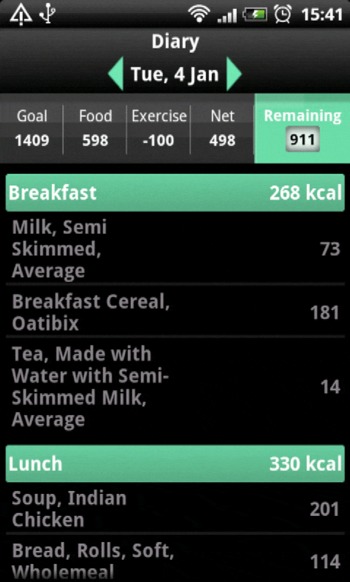
Fig. 1 Screen capture of the food diary entry page of My Meal Mate. (A colour version of this figure can be found online at www.journals.cambridge.org/bjn)

Fig. 2 Screen capture of the search page for finding a food to add to the diary. (A colour version of this figure can be found online at www.journals.cambridge.org/bjn)
Subjects and recruitment
A total of fifty volunteers were recruited from staff and students at the University of Leeds by email advertisements and posters displayed around the campus. Upon expression of interest, participants were emailed a study information sheet to read before confirming involvement. They were not blinded to study design so as to enhance adherence given the time commitment involved. Participants were excluded if they were pregnant, lactating or unable to read and write in English (for the purposes of using the application).
Procedure
Volunteers were enrolled in small groups of no more than five people and each 90 min study enrolment session followed a standard format. Training in the use of the smartphone and recording intake on MMM was delivered by a dietitian. The training sessions assumed no prior knowledge of smartphone use and the group had the opportunity to practise entering a day's intake on MMM with the support of two researchers. Participants were also provided with a study manual explaining the basic functioning of the smartphone and a step-by-step guide to using MMM. Although MMM is designed as a weight-loss tool, the participants were asked not to change their normal diet and were advised that it was not necessary to restrict their food intake. Energy intake goals were therefore set for monitoring towards ‘weight maintenance’ at current weight rather than weight loss. Participants were weighed in light clothing and without shoes on Tanita solar powered scales (model HS-301, maximum capacity 150 kg and measuring in 200 g increments; Tanita Corporation). A portable stadiometer was used to measure height (without shoes) to the nearest 0·1 cm. Participants were instructed to record their food and drink intake on MMM for seven consecutive days. They were advised that they might find this process easier by recording throughout the day, at the time of consumption. It was acknowledged, however, that some people might wish to record their intake at the end of the day, in which case they were asked to take photos of the food to act as memory prompts. With regard to entering portion size information, although the MMM database contains default portion sizes for each item, participants were encouraged to consider when entering items whether the default portion size was appropriate. Participants were strongly encouraged to weigh foods if they had any uncertainty about their estimation and to manually enter the correct portion size. Although encouraged, weighing of every item was not a mandatory part of the procedure in order to minimise participant burden. When entering recipes, participants were instructed to break the recipe down into its constituents and enter as single items. This was the method also used during the recalls. In exceptional cases where the participant did not know the recipe constituents, they had the option of entering the nearest alternative generic recipe from the database. All of the data recorded on the phone in the 7 d period were uploaded to the secure website linked to the application. During the 7 d recording period, participants were contacted twice at random to conduct 24 h telephone recalls. Participants were explicitly advised at enrolment and at the beginning of each telephone recall not to use data recorded on MMM to assist them during the recall. Written consent to take part was collected from all those involved and no incentives were offered other than use of the smartphone for 7 d.
Reference measure: 24 h recalls
Each 24 h recall lasted approximately 15–20 min and followed a validated script procedure based on the United States Department of Agriculture's multiple-pass telephone recall method(20) to ensure consistency. The method aims to cue accurate recall by probing for food intake data in a series of ‘passes’. In the first pass, the participant is asked to give a ‘quick list’ of foods eaten, the second pass prompts to elicit further details on cooking methods, portion sizes and commonly forgotten foods and the third pass is a review of the information. Participants were provided with a written portion size guide to aid accurate identification of food portions and were asked to have this to hand for the telephone recalls. The portion size guide was developed using a photographic atlas of portion sizes originally published by the Ministry of Agriculture Fisheries and Food(Reference Nelson and Meyer21). The booklet contained twenty-one sets of photographs of six different portion sizes. The recalls were conducted by three interviewers including a dietitian and trained nutrition students. Recalls were conducted at random on both weekend and week days.
Coding of nutritional data from the recalls
The telephone 24 h dietary recalls were coded using a Microsoft Access-based food diary analysis program custom made for the project. The Weight Loss Resources database(19) was incorporated into the Microsoft Access-based food diary analysis program, allowing the 24 h recalls to be coded using the same database as MMM. Data collected on MMM were downloaded from the online SQL database linked to the phone into the MMM food diary analysis database. Before coding began, a meeting was held to discuss and agree coding assumptions in order to increase consistency in coding decision making. Both coders were trained nutrition postgraduates with prior experience of food diary data entry. Coders held regular meetings to raise queries and resolve issues. After the recalls were coded, a random sample of entries was examined to cross check for consistency.
Data cleaning
The raw data exported from MMM and the coded recalls were manually checked for implausible outliers ( < 2092 kJ ( < 500 kcal) and >20 920 kJ (>5000 kcal)) and any outlying observations checked with the original records. Any errors that a participant may have made in their MMM entry were left unaltered. Individual differences between the telephone recall and MMM entries were calculated and differences above 1674 kJ (400 kcal) checked with the original records to check for errors in data entry. No outliers were removed; only obvious errors in data entry for the recalls were corrected.
Ethical approval
The present study was conducted according to the guidelines laid down in the Declaration of Helsinki and all procedures involving human subjects/patients were approved by the University of Leeds, Faculty of Medicine and Health Research Ethics Committee (ethics reference no.: HSLT/09/027). Written informed consent was obtained from all subjects.
Statistical analysis
Analyses were performed using STATA statistical software release 11 (Stata Corporation)(22). Descriptive statistics were used to assess baseline characteristics of participants. Paired t tests were used to compare group means of energy (kJ and kcal) and macronutrient intake as measured by the 24 h recall and its equivalent day of subject entries on MMM. This was done separately for day 1 and day 2 of recalls.
Correlation was assessed between the two methods for each individual day collected, the average of the 2 d and the average of the 2 d when compared with the average of the 7 d on MMM. This was determined by Pearson's product–moment correlation. A Bland–Altman plot(Reference Bland and Atlman23) was used to analyse the limits of agreement between the two methods by calculating the standard deviation of the difference between the two. Bland–Altman is the appropriate test to use in addition to correlation, as a good correlation between methods does not necessarily imply a good agreement(Reference Lambert, Plumb and Looise18). The differences between the methods were also checked for normality of distribution.
Results
Characteristics of the study participants
The characteristics of the study population are displayed in Table 1.
Table 1 Characteristics of the study participants (n 50) (Number of participants and percentages)
Only one participant did not record any data for the 7 d period and so was excluded from the analysis. For the 24 h telephone recalls conducted on day 2, three participants were excluded from the analysis as the interviewer recalled the directly preceding 24 h period rather than 06.00 to 06.00 hours. Furthermore, one day 2 recall was missing as the person was not available to complete one with several attempts at contact. Of a possible 350 d of entry (fifty people multiplied by 7 d recording), 320 entries of plausible intake were downloaded from the website, meaning an overall completion of 94 % of possible days' entries.
Accuracy of My Meal Mate compared with 24 h recalls
Table 2 shows the daily intake of energy (kJ and kcal), protein (g), fat (g) and carbohydrate (g) as recorded by MMM and the 24 h recall for the equivalent day. This is shown for day 1 and day 2 separately, the means of the two MMM days and two recall days combined and also the 7 d mean recorded by MMM compared with the mean of recall 1 and recall 2. As the outcome data were found to be normally distributed, paired t tests were conducted, which showed no statistically significant differences between the mean daily energy and macronutrients recorded between the methods on day 1. For day 1 of recording, there was a non-significant difference in mean daily energy intake between the two methods of 68 kJ (16 kcal) (95 % CI − 553, 418 kJ, 95 % CI − 127, 100 kcal, P= 0·78). On day 2, there was a statistically significant difference of 441 kJ (105 kcal) (95 % CI − 854, − 29 kJ, 95 % CI − 204, − 7 kcal) between the mean daily energy recorded (P= 0·04) and a statistically significant difference reported for the mean daily fat intake of 7 g (95 % CI − 13, − 1) g but no statistically significant differences for protein and carbohydrate. The recalls recorded higher energy and macronutrient values than MMM. There were no statistically significant differences between means when the mean of the recalls on day 1 and day 2 was compared with the mean of the recalls on day 1 and day 2 on MMM and when 7 d of MMM was compared with 2 d of recalls and 2 d of MMM. Energy (kJ) recorded on MMM correlated well with the recalls (day 1: r 0·77, 95 % CI 0·62, 0·86, P< 0·001; day 2: r 0·85, 95 % CI 0·75, 0·91, P <0·001). For the mean of MMM day 1 and MMM day 2 compared with the mean of recall day 1 and recall day 2, correlations for daily energy and macronutrients were high and statistically significant ranging from r 0·69 to 0·86 (P< 0·001).
Table 2 My Meal Mate (MMM) v. 24 h recall† (Mean values and standard deviations with their 95 % confidence intervals)
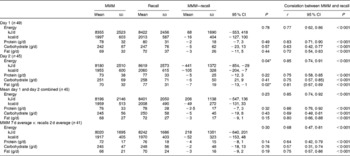
* Values were significantly different (P< 0·05).
† Daily intake of energy (kJ and kcal) and macronutrients; protein, carbohydrate and fat (g) as recorded by MMM and the 24 h recall for the equivalent day. Day 1 and day 2 are shown separately, the averages of the 2 d combined by each method and also the 7 d mean recorded by MMM compared with 2 d of recalls. Correlation between MMM and 24 h recall assessed with Pearson's correlation (r).
Agreement between the two methods
Fig. 3 shows the Bland–Altman plot for the agreement between MMM and the 24 h recalls for day 1 and Fig. 4 shows the agreement between the methods for day 2. For day 1, the mean difference is small but the 95 % limits of agreement are fairly wide ( − 3378 to 3243 kJ ( − 807 to 775 kcal)). For day 2, the mean difference is larger ( − 441 kJ (105 kcal)) with limits of agreement of − 3133 to 2251 kJ ( − 749 to 538 kcal).

Fig. 3 Bland–Altman plot for day 1 (My Meal Mate (MMM) − recall). (A colour version of this figure can be found online at www.journals.cambridge.org/bjn)

Fig. 4 Bland–Altman plot for day 2 (My Meal Mate (MMM) − recall). (A colour version of this figure can be found online at www.journals.cambridge.org/bjn)
Fig. 5 shows the agreement for the mean of both days of recalls and the corresponding mean of 2 d of MMM. The mean difference is 206 kJ (49 kcal) and the limits of agreement are − 2434 to 2022 kJ ( − 582 to 483 kcal). The within-method variation (between repeated day standard deviation of the difference) was 1791 kJ (428 kcal) for MMM, which was lower than the 2392 kJ (567 kcal) for the recalls.

Fig. 5 Bland–Altman plot for the mean of 2 d of My Meal Mate (MMM) and the mean of 2 d of recalls. (A colour version of this figure can be found online at www.journals.cambridge.org/bjn)
Discussion
This is, to our knowledge, the first study to assess the validity of nutrient intake data collected on a smartphone application when compared with a reference measure. The correlations between MMM and the 24 h recalls for energy and macronutrients were moderate to high (r 0·63–0·83) and were found to be statistically significant. Bland–Altman plots showed fairly wide limits of agreement on an individual level (day 1: − 3378 to 3243 kJ ( − 807 to 775 kcal); day 2: − 3133 to 2251 kJ ( − 749 to 538 kcal)). At the group level, the group mean totals for energy and macronutrients were not found to be statistically significantly different on day 1 but the daily energy and fat intakes were found to have a statistically significant difference on day 2. Bland–Altman plots showed that the bias between the methods appeared consistent over different levels of energy intake.
Although there are no studies comparing the food diary from a smartphone application with a reference measure, the correlation coefficients compare favourably to studies validating PDA food diaries against 24 h recalls. Fukuo et al. (Reference Fukuo, Yoshiuchi and Ohashi24) compared a PDA food diary program with a 24 h recall and found Pearson's correlations of r 0·72–0·85 for energy and macronutrients. However, the agreement between the methods was not reported in that study. Beasley et al. (Reference Beasley, Riley and Jeanmary12) found Pearson's correlations of r 0·71 for energy comparing the PDA program DietMatePro with a 24 h recall in a sample of thirty-nine but found a lower correlation coefficient of r 0·54 in a further study with a larger sample of seventy-one(Reference Beasley, Riley, Davis and Singh25).
Most previous studies comparing electronic devices with a reference measure have reported group means and rarely reported agreement as analysed by Bland–Altman analysis. An exception is the aforementioned validation of DietMatePro(Reference Beasley, Riley and Jeanmary12) where the researchers carried out a Bland–Altman plot of the agreement between DietMatePro and a 24 h recall in a sample of twenty-eight adults and the limits of agreement were − 6694 to 6694 kJ ( − 1600 to 1600 kcal) which is fairly wide. The limits of agreement in the present study of MMM, although wide, are narrower than those seen for DietMatePro. The limits of agreement for DietMatePro when compared with a weighed food diary also appear to be fairly wide and look to be approximately − 1674 to 2092 kJ ( − 400 to 500 kcal). The wide limits of agreement seen in the present study are consistent with the validation of DietMatePro and given the number of potential sources of error in the reference measure, it does seem prudent to expect wide agreement when comparing a new method with a reference measure which is not in itself a true reflection of absolute intakes.
A disadvantage of 24 h recalls as a reference measure is the reliance on participant memory and potential for recall bias. Recalls were chosen as a reference measure in the present study, as they were a sufficiently different method to a food diary in an attempt to minimise correlated errors. In general, previous studies that have compared energy intake reported by food diaries and 24 h dietary recalls have found lower intakes for the recalls ranging from 0 to 16 %(Reference Buzzard and Willett1). In this case, the mean energy intakes were slightly higher in the recalls than MMM. It could be argued that using MMM might have actually improved participant performance in the recall, as prospectively recording intake potentially raised awareness of consumption and increased the likelihood that respondents would weigh portions and increase the accuracy of portion estimation in the recalls. However, the recalls were unannounced during the 7 d recording period, so participants were not aware of the days they would be required to provide a recall in advance.
The ability to access information about the nutritional content of food consumed in advance of the recall may have also increased nutrition knowledge and inadvertently enhanced any potential social desirability bias. It is also worth considering that the energy goal display on the MMM food diary page (as can be seen in Fig. 1) may have encouraged restrained eating. In an effort to avoid this, participants were encouraged to set their energy display to weight maintenance rather than weight loss. However, recording foods with a goal of not exceeding the energy display may be another explanation for the lower energy reported on MMM when compared with the recall. It is not known to what extent this may have affected reporting but further investigations with MMM as a dietary assessment tool would possibly benefit from removing the energy target display from the food diary page.
The differing results for the group means between day 1 and day 2 could be due to a number of factors. Day 2 had a smaller sample size due to exclusions of several of the recalls and there were some significant outliers where the differences in energy measured were as much as 4184 kJ (1000 kcal) between the methods. One of these instances appeared to be where a participant had misinterpreted one of the portion size pictures used to aid the 24 h recalls and another where a person appeared to have relied on the standard portion sizes in the MMM database rather than manually selecting the appropriate portion size. Despite guidance, both methods put the estimation of portion sizes into the hand of the respondent.
There may also be an effect of time spent using MMM. By the second recall, the participants may have experienced a ‘training effect’ on MMM and be more able to find foods readily and record with greater precision. On the other hand, ‘respondent fatigue’ has been associated with recording periods of greater than four consecutive days(Reference Gersovitz, Madden and Smiciklas-Wright26), so it may be as the week progressed participant recording on MMM became less accurate. This might be another possible explanation for the difference in the result seen on day 2.
The sample in the present study was mostly female and white and nearly a third of participants were educated in nutrition or food science, limiting generalisability to other populations. The volunteers were self-selecting, so likely to be a motivated sample. It also seems reasonable to assume that this approach needs a degree of technological literacy to be able to use the smartphone, although it is worth noting that the study had a good adherence rate with 92 % of entries submitted despite only half of the participants reporting to have ever used a smartphone before. Another limitation with the study was the lack of micronutrient intake assessment, as the database was limited to macronutrient data only.
Using a smartphone application for dietary assessment does have a number of strengths, not least the speed of data entry. Respondents reported taking an average 7 min to enter a meal, which compares favourably with the 8·5 min reported by respondents in the study of DietMatePro and the 5 min reported in the validation of the Wellnavi PDA device. Participants reported an average of 22 min spent each day using the application and although this is about the same length of time spent conducting a 24 h recall, the amount of time spent manually coding the recall for analysis is considerably longer than this. Obviously, no additional coding time is required for the MMM application. The direct transfer of food and drink data collected on MMM to nutrient output for analysis is a substantial benefit of this approach to dietary assessment.
Using a smartphone application for dietary assessment is a unique and innovative approach with the advantage that as a prospective method, it does not rely on memory and can collect data in real time. Smartphones are popular items which people carry around so can be conveniently used throughout the day. Mobile phones are a particularly widely accepted technology platform with 89 % of the UK population claiming to use or have used a mobile phone(27). Mobile phone technology has evolved rapidly and there has been a surge in ‘smartphone’ ownership. Over a quarter of the UK population (26·5 %) report owning a smartphone, which is more than double the number 2 years previously(27). A strength of MMM, in particular, is the extensive database with generic and branded food items for people to choose from. Early focus group work informed the decision to use a branded food database to reflect the consensus that people wanted to select the exact food that they had eaten. As consumption of processed food increases, branded foods become more important and can give a greater degree of accuracy as the nutrient composition of a branded item can vary considerably within the same product category(Reference Buzzard and Willett1).
Although the validation study has shown variation in results at the individual level, it does show the potential of a smartphone application as a dietary assessment tool. Automating the process of dietary assessment could save time and money while giving the flexibility of a prospective method in terms of open-ended reporting of foods and flexible analysis at the level of nutrient or individual food. An automated dietary assessment method can standardise the data collection process and eliminate the manual coding necessary for analysis. Researchers are currently investigating computer-based repeat 24 h recalls for epidemiological studies(Reference Touvier, Kesse-Guyot and Mejean8, Reference Arab, Wesseling-Perry and Jardack9). A handheld, portable device has the advantage of convenience for reporting and portability and prospective reporting, as it is less reliant on memory. The present study has only looked at the accuracy of two particular days, so measures on repeat days would need to be investigated in order to measure habitual diet. Further research into MMM is needed with an extended database to include micronutrients and in a wider range of population groups. Future work will seek to examine the sources of variation between reports on MMM and the recalls.
Conclusion
MMM has been developed as a tool to support weight loss; however, this validation study shows the potential for MMM as a dietary assessment tool, as it correlates favourably with 24 h recalls for estimating group means. However, the agreement on daily energy totals between the methods at the individual level is wide. The largest outlying differences between individuals appeared to be mistakes in estimating portion sizes on both methods. Training on estimating portion sizes and features to help with this might be useful additions in a future programme. Future work will continue to investigate the sources of variation between MMM and the recalls. Further research is warranted in establishing the accuracy of MMM in other population groups and with a wider range of nutrients.
Acknowledgements
The study is funded by a National Prevention Research Initiative grant (grant no. G0802108). The authors declare that there is no conflict of interests. In terms of individual contributions, M. C. C. was involved with the design and running of the study, data collection, analysis and the interpretation of the data and wrote the initial draft of the manuscript. J. E. C. and V. J. B. assisted in designing the study, the interpretation of the data, the supervision of the project and the preparation of the manuscript. C. N. helped with data collection, formatting of the tables and preparation of the manuscript.


