Anaemia continues to be a major public health problem in developing countries including India with high prevalence observed in national surveys, especially in women and children(Reference Kalaivani and Ramachandran1,2) . Precise and accurate estimation of Hb in population surveys is important for valid estimates of the burden of the problem, assessment of time trends and guiding intervention policies.
Currently, venous blood samples analysed by an automated analyser, or by the direct cyanmethemoglobin method of Hb estimation, are considered the reference or gold standard method(Reference Neufeld, Larson and Kurpad3). However, this requires collection of venous blood, transportation of blood sample to the laboratory and analysis by trained laboratory personnel using reference methods, all of which are technically demanding and impractical for field conditions. Point-of-care (POC) diagnostic tests using capillary blood samples are therefore commonly used in population surveys. However, multiple studies have demonstrated that commonly used POC haemoglobinometers (Hemocue) are error prone in conditions of high temperature, humidity, and improper storage of cuvettes(Reference Nguyen4). Both under- and overestimation of Hb by hemoglobinometer, compared with the reference method, have been reported(Reference Neufeld, Larson and Kurpad3,Reference Abraham, Agrawal and Johnston5–Reference Rappaport, Karakochuk and Hess7) . Available non-invasive methods are reported to have higher errors compared with the invasive methods(Reference Neogi, Negandhi and Kar8).
The errors in POC measurement of Hb impact anaemia prevalence estimates in population studies. Relatively small differences in Hb values, particularly when the mean population Hb is close to the diagnostic cut-off for anaemia, result in large differences in anaemia prevalence(Reference Neufeld, Larson and Kurpad3). Population surveys conducted close in time to each other can thus show wide variations in the anaemia prevalence, if different methods of Hb estimation are used. For example, anaemia prevalence in under five children in the state of Gujarat, reported by two surveys conducted close to each other, varied by almost twofold (38·5 % as per the Comprehensive National Nutrition Survey (2016–2018) v. 79·7 % as per the fifth round of National Family Health Survey (NFHS) (2019–2020) despite both the surveys using a state representative sample(2,9) . Similarly, the anaemia prevalence in under five children from Maharashtra state based on surveys conducted within a span of eight years showed wide variation: 73·7 % as per the District Level Health Survey 4 (2012–2013), 53·8 % as per the NFHS-4 (2015–2016), 41·6 % as per the Comprehensive National Nutrition Survey (2016–2018) and 68·9 % as per the NFHS-5 (2019–2020)(2,9–11) . At least a part of these variations is likely to be contributed by different methods of Hb estimation used in different surveys (capillary blood by Hemocue in NFHS surveys, venous blood by autoanalyser in Comprehensive National Nutrition Survey and capillary blood by indirect cyanmethemoglobin method in DLHS 4 survey). However, the time trends in anaemia prevalence are often considered as indicators of the impact of public welfare programs and stimulate the recalibration of interventions. Methodological discrepancies in Hb estimates thus have important policy implications.
Although venous blood Hb measured by autoanalyser or direct cyanmethemoglobin method is known to be accurate, use of capillary blood sample is desirable in population-based studies to enhance participant safety and acceptance, as finger pricks are less invasive than venepuncture. Studies have shown that pooling multiple drops of capillary blood sample offers greater precision than a single drop(Reference Conway, Hinchliffe and Earland12).We recently showed that the method of capillary blood collection and dimension of the lancet affect the Hb values(Reference Augustine, Dasi and Palika13) and demonstrated the feasibility of collecting 150–250 µl of capillary blood in a microtainer tube that can be directly fed to the portable autoanalyser for Hb measurement. The validity of this method in the field is not known.
The present cross-sectional study aimed to examine the validity of the pooled capillary blood sample Hb measurement with POC autoanalyser (Hb-C-AA) by comparing it with venous blood Hb measured by either autoanalyser (Hb-V-AA) or direct cyanmethemoglobin (Hb-V-CM). Additional objectives were: first, to estimate blood sample related and analytical method related differences in Hb and second, to compare the sensitivity and specificity of the Hb-C-AA in diagnosing different grades of anaemia against reference methods. Finally, the magnitude of bias in Hb measurements by different methods is known to vary at different Hb concentrations; so the interventions that change the Hb concentration can thus have differential bias at baseline and at the end of the intervention. The estimates of Hb increments measured by different methods may therefore vary, even though the same measurement technique is used throughout. We also conducted a longitudinal study to compare the increment in Hb and change in anaemia prevalence in response to iron folate (IFA) supplementation using the above three methods.
Methods
Cross-sectional study
This study was conducted according to the guidelines laid down in the Declaration of Helsinki and all procedures involving human subjects were approved by the institutional ethics committee of Indian Council of Medical Research – National Institute of Nutrition, Hyderabad, India (IRBNo 06/II/2018). The study was conducted during the preparatory phase of a cluster randomized controlled trial to evaluate the impact of ‘screen and treat’ approach for anaemia reduction. Informed written consent was obtained prior to the enrolment and sample collection. The intervention trial was registered at Clinical Trials Registry of India (CTRI no 2019/02/017806, http://ctri.nic.in/).
Sample size estimation
We aimed to cover a wide range of Hb values by including participants with mild, moderate and severe grades of anaemia as well as those without anaemia. Assuming 70 % prevalence of anaemia, to assess the accuracy of Hb-C-AA for classifying individuals as anaemic or non-anemic as compared with the reference methods (Hb-V-AA and Hb-V-CM), with sensitivity and specificity both 80 %, with 5 % precision and 95 % confidence interval, the required sample size was estimated to be 351. With a design effect of 2 and with 5 % attrition, a final sample size of 738 was considered adequate for the study.
In order to include a sample covering a wide range of Hb values with different grades of anaemia, participants were enrolled from different sites in Hyderabad, including an urban slum (n 105), two government hospitals (for potential participants with moderate and severe anaemia, n 176), volunteers from Indian Council of Medical Research – National Institute of Nutrition (n 20) and from two government social welfare hostels for college girls (n 461). A total of 762 participants (42 men and 720 women) aged ≥ 17 years were thus enrolled in the study. Participants with history of bleeding or clotting disorders, severely ill patients, those on drugs (anticoagulants, anti-platelet medications) or patients with history of blood transfusion in the previous year were excluded from the study. After exclusion of samples without valid results of all three Hb values, the final sample size available for Hb comparisons by different methods was 748 (40 men and 708 women, Fig. 1).
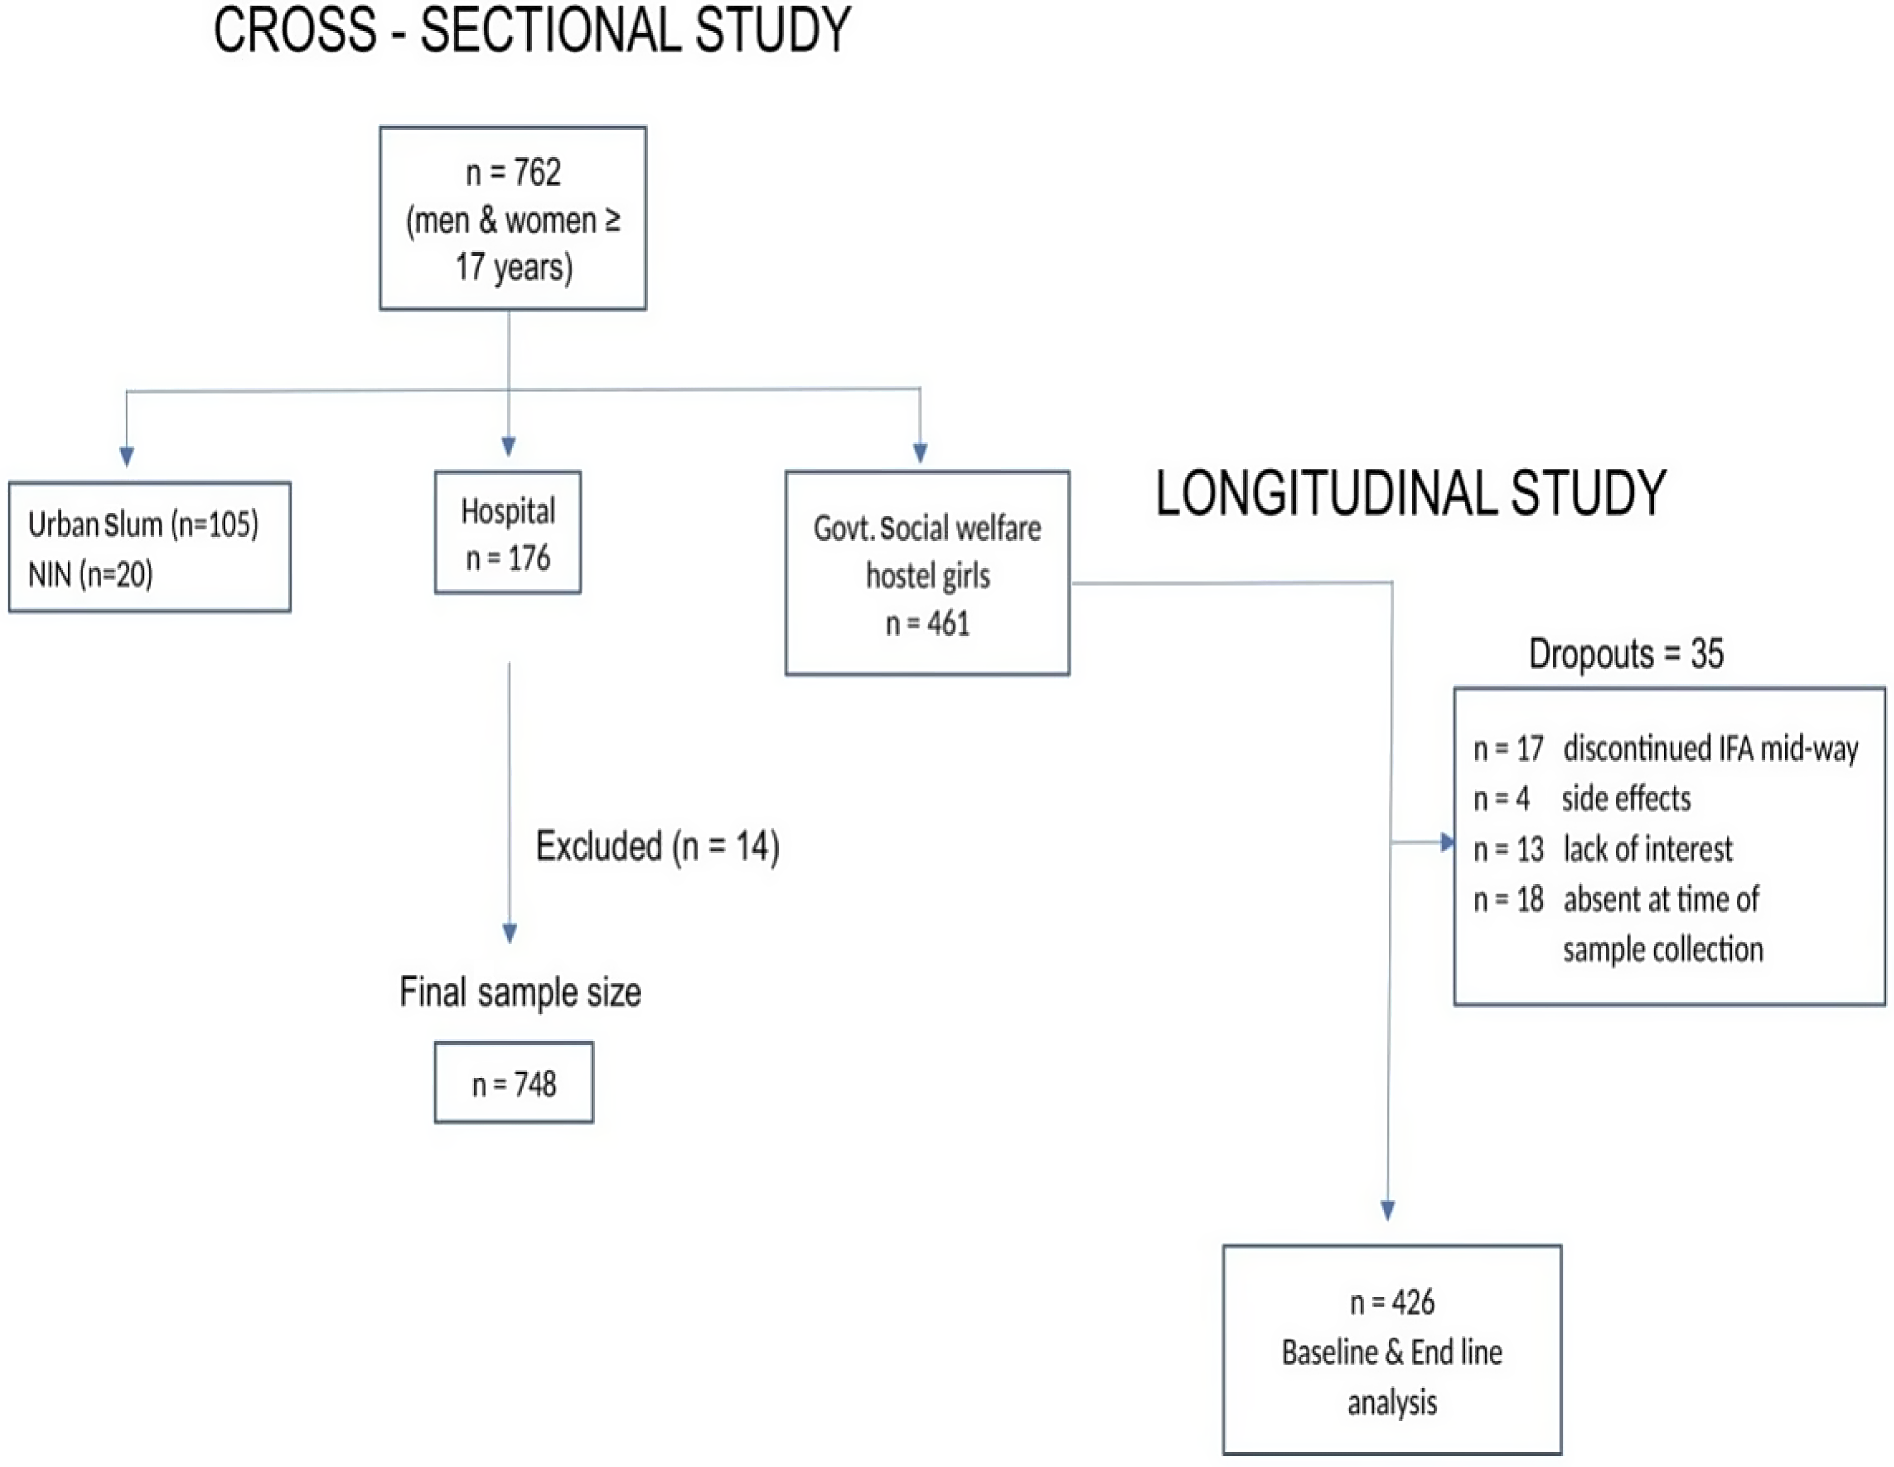
Fig. 1. Flow chart of participant recruitment.
Capillary and venous blood sample collection and analyses by point-of-care autoanalyser (Hb-C-AA and Hb-V-AA)
About 2 ml of venous blood (from the median cubital vein of the right hand) was collected in the non-fasting state by trained phlebotomists in an EDTA vacutainer tube (BD#367 841, Becton Dickinson). This was immediately followed by capillary blood collection from the left hand finger (around 150–200 µl or around 5–7 drops), under aseptic precautions. Capillary blood was collected from the tip of a finger (any of the three middle fingers) which was cleaned with an alcohol swab and left to dry naturally. An incision was then made with a disposable contact activated lancet (BD 366 594, 1·5 mm (w) × 2·0 mm (d), BectonDickinson, New Jersey, USA). The first drop of blood was discarded and remaining 4–6 consecutive drops (total ∼150–250 μl, each drop ∼30–40 μl)(Reference Jarus-Dziedzic, Zurawska and Banys14) were collected in an EDTA-microtainer tube (BD#365 974, BectonDickinson). Precaution was taken to collect only free-flowing capillary blood while avoiding squeezing (or milking) of the finger. Hb was measured in both capillary and venous samples as described later.
The Hb analyses by autoanalyser were conducted at the site of participant recruitment (POC), where only minimum facilities like a bench top for placing the instrument and electricity connection were available. In a few instances when electrical connection was unavailable, the autoanalyser was connected to a UPS (uninterrupted battery power source) in the study van. The autoanalyser was carried from NIN to the study sites on a daily basis. For calibration, three-level quality control standards (high, normal and low: ABX Minotrol16 MX420L:5·9 ± 0·4 g/dl; MX420N:13·6 ± 0·5 g/dl; MX420H:18·4 ± 0·6 g/dl, respectively) were carried in insulated chiller ice boxes and these were analysed every day prior to the Hb analyses. It was ensured that these measurements were always within the quality control range. The intra and interassay CV were 1·02 % and 1·17 %, respectively. For quality control, a standard reference blood sample (Horiba, ABX Minotrol 16) was used as a reference standard for Hb and erythrocyte indices. Immediately after collection, venous and capillary blood samples were gently mixed (end to end) and directly fed to the autoanalyser (Horiba ABX Micros 60OT) through a sample injector port/capillary needle.
Venous blood Hb estimation by direct cyanmethamoglobin method
An aliquot of 20 μl of venous blood was pipetted into a 15 ml plastic tube with a calibrated electronic pipette (Sartorius). Immediately, 5 ml of Drabkin’s solution (Hemocore-D kit, Coral Life Sciences) was added and vortexed. The tubes were placed at room temperature in tube racks and brought to the laboratory within 6 h. Their Hb content was measured by spectrophotometry (Dynamica, Halo-SB-10) at 540 nm, against a reference standard (60 mg/dl) supplied along with the Hemocore-D kit. The intra and interassay CV of this method was 2·7 and 4·6 %, respectively.
Longitudinal study
This study was conducted in a subset of participants from the cross-sectional study and included college girls residing in social welfare hostels (aged 17–21 years; n 461). Prior informed consent from the participants and hostel authorities was taken for the study participation. This longitudinal study was nested within an ongoing trial to evaluate the effect of IFA supplementation on gut modulation and Hb improvement. All the participants recruited for the trial were included in the present study, and no separate sample size estimation was done. Based on their Hb-V-AA values at baseline, the participants were divided into different grades of anaemia (or no anaemia) and provided prophylactic or therapeutic IFA as per the I-NIPI(15)programme guidelines, for 3 months. Sugar-coated IFA tablets (containing 60 mg Fe and 500 µg folic acid, Cyano Pharma Private Limited) were given as a prophylactic dose of one tablet once a week to non-anaemic participants (Hb ≥ 12 g/dl), while those with mild and moderate anaemia (Hb 8–11·9 g/dl) received a therapeutic dose of two tablets, i.e. total 120 mg Fe and 1 mg folic acid per day for 3 months. Severely anaemic participants (Hb < 8 g/dl) were advised to avail facility-based treatment as per the programme guidelines. However, because they were unwilling to do so, they were treated by a study clinician with a higher dose: two tablets per day with one tablet containing 60 mg Fe and 500 µg folic acid and the other containing 100 mg Fe and 500 µg folic acid (total 160 mg elemental iron and 1 mg folic acid per day) for 3 months. Venous and capillary blood samples were collected at baseline and at the end of this intervention. The intake of tablets was supervised by the hostel wardens, and the overall compliance with the supplement was very good (75·4 %).
Venous and capillary blood samples collected at baseline and at the end of the intervention were analysed for Hb as described earlier, and the change in Hb-C-AA was compared with changes in Hb-V-AA and Hb-V-CM. Data on Hb values from all the three methods at baseline and at the end of 3 months of intervention were available in 426 girls; 35 participants were excluded from analyses: 17 had discontinued IFA supplements mid-way (4 due to reported side effects such as vomiting, headache, rashes and 13 due to lack of interest in the study), while 18 participants were absent at the time of blood sample collection at the end of the intervention.
Statistical analysis
All analyses were carried out using Stata I/C version 14.2. A descriptive analysis was performed for the key variables; continuous variables are presented as mean with 95 % CI and categorical variables as proportions.
For the cross-sectional comparisons between Hb-C-AA and Hb-V-AA and between Hb-C-AA and Hb-V-CM, we used the paired t test and calculated concordance correlation coefficients. The bias and limits of agreement between different methods were estimated using Bland–Altman analysis(Reference Bland and Altman16).The bias estimates in men and women were not significantly different; therefore, the analyses were conducted on the overall sample without stratification by sex. We also assessed the correlation between the difference between two methods and the average measurement. Additionally, we used linear regression to calculate the bias at different Hb concentrations. For estimation of sample-related variation, we calculated mean bias with 95 % CI between Hb-C-AA v. Hb-V-AA; for estimation of analytical method-related variation, we calculated the mean bias with 95 % CI between Hb-V-AA v. Hb-V-CM. We also compared prevalence estimates of the grades of anaemia using Hb-C-AA values with those obtained using Hb-V-AA and Hb-V-CM by evaluating the overlap between CI. Further, we estimated the sensitivity and specificity of Hb-C-AA in classifying individuals in different grades of anaemia compared with the reference methods of Hb-V-AA and Hb-V-CM using confusion matrix statistic in R software (Version R.4.0.3)(Reference Fawcett17).
In the longitudinal study, differences between the mean values of Hb-C-AA and Hb-V-AA or Hb-V-CM, at baseline and at the end of the intervention, were evaluated by the overlap of the 95 % CI of each measurement. Similarly, the change in Hb or in the prevalence of anaemia between the two time points, using Hb-C-AA, was compared with the change estimated using Hb-V-AA and Hb-V-CM.
Results
Cross-sectional study
Hb estimates by all three methods were available for 748 participants. The sample-related (capillary v. venous) difference in the mean Hb values was small with Hb-C-AA and Hb-V-AA values (mean ± sd) of 11·0 ± 2·1 g/dl and 10·9 ± 2·0 g/dl. This difference, although statistically significant (mean ± sd: −0·1 ± 0·5 g/dl, P < 0·001), was smaller than the analytical CV of the methods. The analytical variation in the mean Hb values (autoanalyser v. cyanmethemoglobin) with no significant difference between Hb-V-AA and Hb-V-CM is presented in Table 1. The concordance correlations between Hb values measured by the different methods were high (r > 0·9), with particularly higher correlations between Hb-C-AA and Hb-V-AA(r = 0·97). Scatterplots comparing different methods are presented in Fig. 2(a)–(c).
Table 1. Comparison of Hb-C-AA with two reference methods: Hb-V-AA and Hb-V-CM
(Mean values and 95 % confidence intervals, n 748)

* The values are truncated at one decimal place, so the value of −0·007 g/dl is represented as < –0.1 g/dl.
Hb-C-AA, Capillary blood haemoglobin measured by autoanalyser.
Hb-V-AA, venous blood haemoglobin measured by autoanalyser.
Hb-V-CM, venous blood haemoglobin measured by cyanmethemoglobin method.
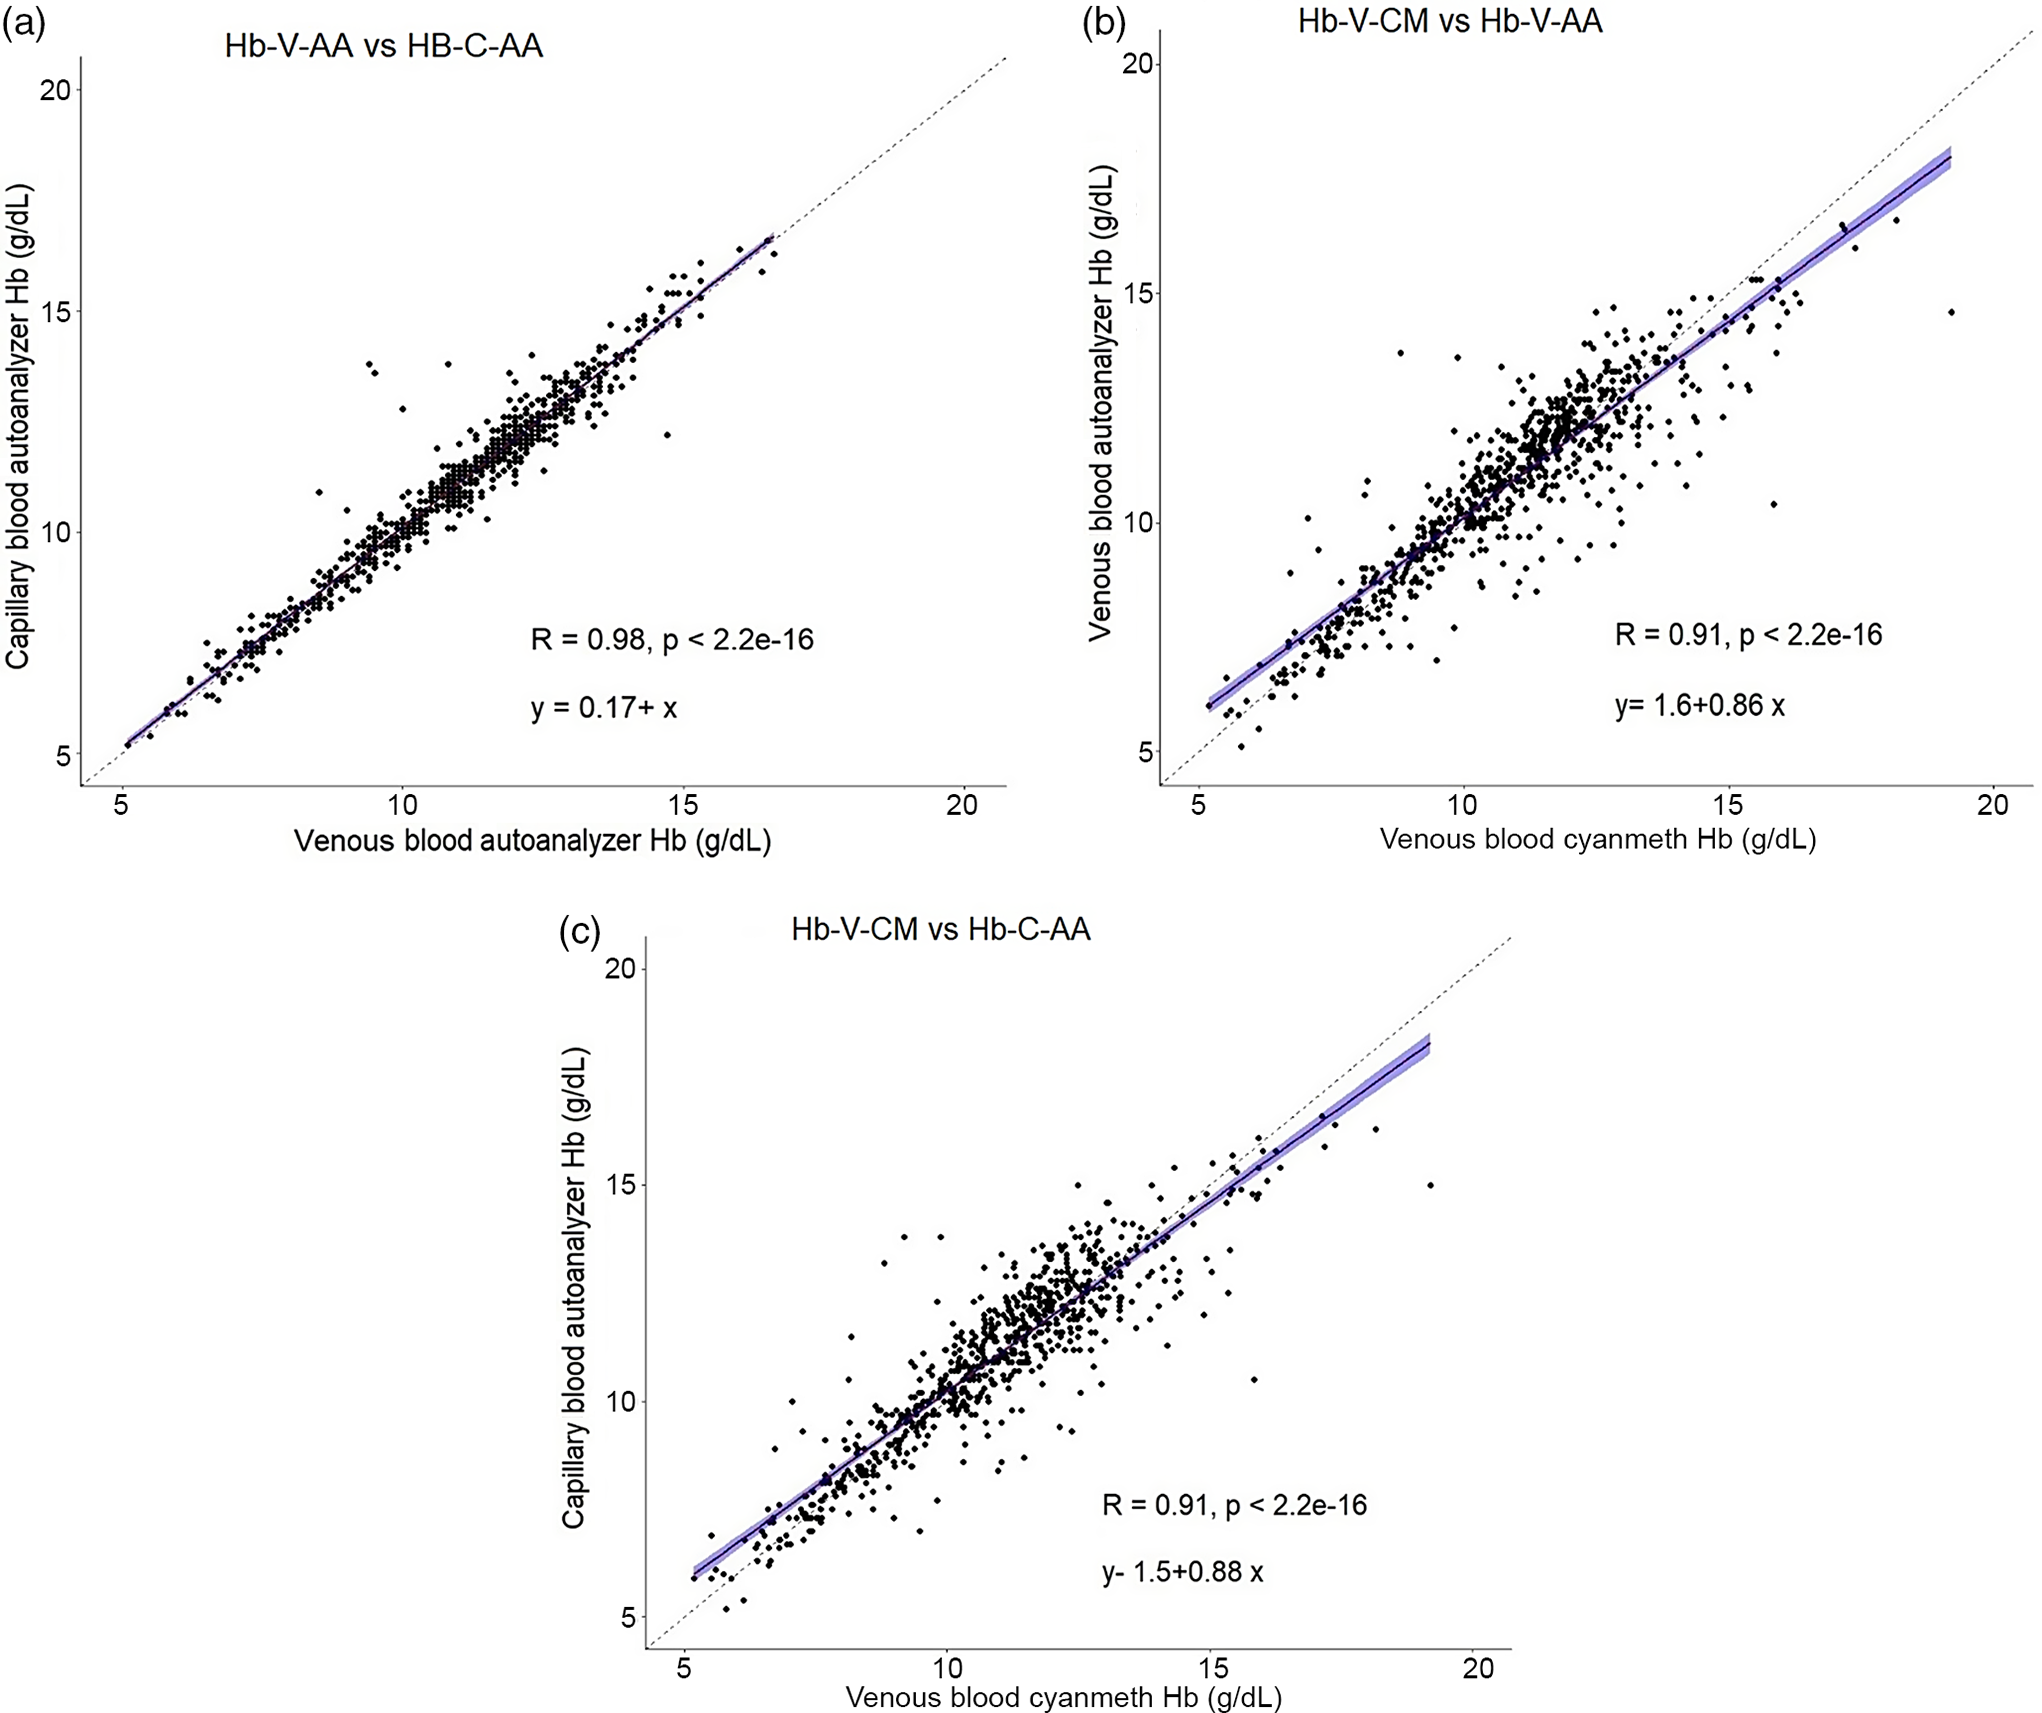
Fig. 2. Scatter plot of haemoglobin (Hb) concentrations measured by different methods. (a) Venous blood autoanalyser v. capillary blood autoanalyser (Hb-V-AA v. Hb-C-AA); (b)Venous blood cyanmethemoglobin v. capillary blood autoanalyser (Hb-V-CM v. Hb-C-AA); (c) Venous blood cyanmethemoglobin v. venous blood autoanalyser (Hb-V-CM v. Hb-V-AA). Dashed line represents simple least squares regression line, solid line represents line of equity.
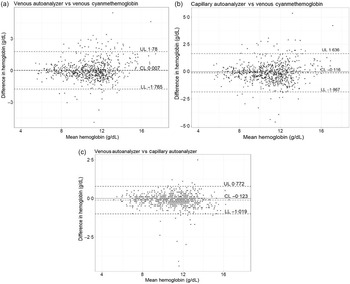
The Bland–Altman plots for comparison between Hb-C-AA v. Hb-V-AA, Hb-C-AA v. Hb-V-CM and Hb-V-CM v. Hb-V-AA are presented in Fig. 3(a)–(c). The mean difference and limits of agreement between Hb-V-AA and Hb-V-CM was < 0·1 g/dl (–1·76–1·78); between Hb-C-AA and Hb-V-AA: –0·1 g/dl (–1·0–0·8) and between Hb-C-AA and Hb-V-CM: –0·1 g/dl (–1·8–1·6). Expressed as a percentage, the mean difference and limits of agreement between Hb-V-AA and Hb-V-CM were 0·1 % (–15·7–15·9 %); between Hb-C-AA and Hb-V-AA was 1·1 % (–6·9–9·1 %) and between Hb-C-AA and Hb-V-CM was 1·2 % (–14·5–16·9 %) (online Supplementary Fig. 1). The mean differences were less than the analytical CV of the measurements, although the limits of agreement were beyond the analytical CV. The differences between methods were correlated with the magnitude of the average measurement yielding correlation coefficients (r) of 0·09 between Hb-V-AA and Hb-C-AA; and 0·13 between Hb-V-CM and Hb-V-AA; all P < 0·05. Linear regression provided different bias (difference between Hb-V-AA and Hb-C-AA) estimates of 0·01, –0·10, –0·15 and –0·21 g/dl at Hb concentrations of 5, 10, 12 and 15 g/dl, respectively.

Fig. 3. Bland–Altman plots for comparison of haemoglobin (Hb) concentrations (g/dl): (a) venous blood Hb by cyanmethemoglobin v. venous blood Hb by autoanalyser (Hb-V-CM v. Hb-V-AA), (b) venous blood Hb by cyanmethemoglobin method v. capillary blood Hb by autoanalyser (Hb-V-CM v. Hb-C-AA), (c) venous blood Hb by autoanalyser v. capillary blood Hb by autoanalyser(Hb-V-AA v. Hb-C-AA). The middle line represents mean difference, and two dashed lines represent lower and upper limits of agreement.
The prevalence estimate of overall anaemia (Hb < 12 g/dl for women and < 13 g/dl for men) using Hb-C-AA (65·1 %) did not differ significantly from either Hb-V-AA (67·8 %) or Hb-V-CM (72·1 %, Table 2).The prevalence estimates of mild, moderate and severe anaemia by Hb-C-AA were also not different from estimates when Hb was measured using Hb-V-AA or Hb-V-CM.
Table 2. Distribution of grades of anaemia with different methods
(% with 95 % CI) (n 748)
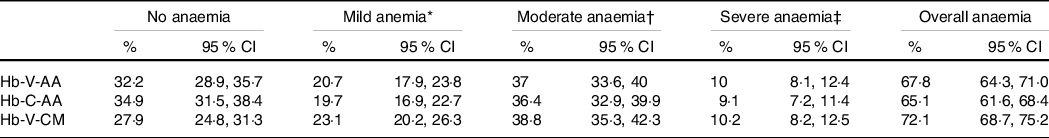
Hb-V-AA, venous blood haemoglobin measured by autoanalyser; Hb-C-AA, capillary blood haemoglobin measured by autoanalyser; Hb-V-CM, venous blood haemoglobin measured by cyanmethemoglobin method.
* Mild anaemia: Hb: 11 to 11·9 g/dl and in women and Hb: 11 to 12·9 g/dl in men.
† Moderate anaemia: Hb: 8 to 10·9 g/dl.
‡ Severe anaemia: Hb: < 8 g/dl.
While comparing the sensitivity and specificity of different methods for classifying individuals in grades of anaemia, we analysed the mild and moderate category of anaemia as a single group because the programmatic treatment guideline is similar for both the categories(15). Compared with Hb-V-AA, the sensitivity and specificity of Hb-C-AA to classify participants into the categories of ‘no anaemia’, ‘mild + moderate anaemia’ and ‘severe anaemia’ were excellent (above 90 %, except a slightly lower sensitivity of 88 % to identify severe anaemia) (Table 3).When comparing Hb-C-AA with Hb-V-CM, the above indicators of the diagnostic accuracy of test were relatively lower with particularly low sensitivity to classify participants into the categories of ‘mild + moderate anaemia’ and ‘severe anaemia’ (both 79 %, Table 3).
Table 3. Sensitivity, specificity, positive predictive value and negative predictive value of Hb-C-AA in diagnosing grade of anaemia compared with the reference method of Hb estimation (Hb-V-CM and Hb-V-AA); n 748

Hb-C-AA, capillary blood haemoglobin estimated by autoanalyser; Hb-V-AA, venous blood haemoglobin estimated by autoanalyser; Hb-V-CM, venous blood haemoglobin estimated by direct cyanmethemoglobin method.
* Mild anaemia: Hb: 11 to 11·9 g/dl in women and 11 to 12·9 g/dl in men.
† Moderate anaemia: Hb: 8 to 10·9 g/dl.
‡ Severe anaemia: Hb: < 8 g/dl.
Longitudinal study
In the longitudinal intervention study among college girls, Hb was measured by the three methods at baseline as well as at the end of the intervention, allowing for a comparison of treatment-related Hb changes by each method. At baseline as well as at the end of intervention, Hb-C-AA did not differ significantly from Hb-V-AA. Similarly, no significant differences were observed between Hb-C-AA and Hb-V-CM at the two time points. The mean increment in Hb-C-AA (1·6 g/dl) was also not significantly different from the increment in Hb-V-AA or Hb-V-CM (both 1·7 g/dl, Table 4).
Table 4. Mean, sd and (95 % CI) Hb (g/dl) at baseline, end line and increment in Hb with different methods
(Mean values and standard deviations; 95 % confidence intervals, n 426)
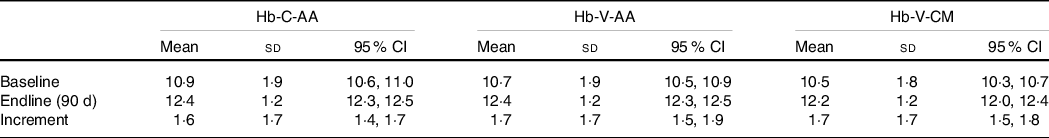
Hb-C-AA, capillary blood haemoglobin estimated by autoanalyser, Hb-V-AA, venous blood haemoglobin estimated by autoanalyser, Hb-V-CM, venous blood haemoglobin estimated by direct cyanmethemoglobin method.
The proportion of girls classified into different grades of anaemia at the two time points did not differ significantly when using Hb-C-AA as compared with using Hb-V-AA (Table 5). The extent of treatment-related decrease in anaemia prevalence measured by Hb-C-AA (35 %) was lower by about 4–5 % than when using Hb-V-AA (40 %) although this difference was not statistically significant. As the anaemia prevalence estimated using Hb-V-CM was higher than that using Hb-V-AA at both time points, the estimated reduction in anaemia prevalence by these two methods was similar.
Table 5. Prevalence of anaemia at different time points with different methods* (n 426)
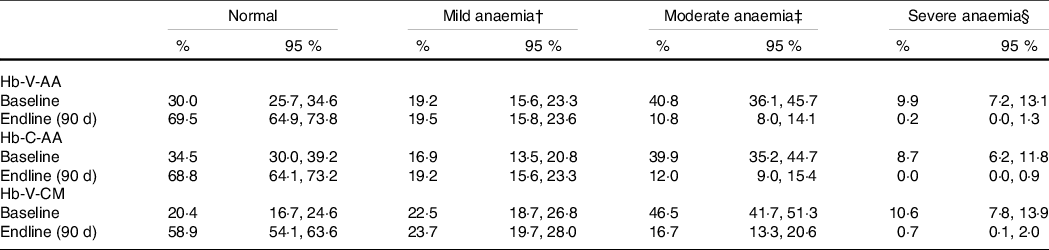
Hb-C-AA, capillary blood haemoglobin estimated by autoanalyser, Hb-V-AA, venous blood haemoglobin estimated by autoanalyser, Hb-V-CM, venous blood haemoglobin estimated by direct cyanmethemoglobin method.
* Values are prevalence % (95 % CI).
† Mild anaemia: Hb: 11 to 11·9 g/dl and in women and Hb 11 to 12·9 g/dl in men.
‡ Moderate anaemia: Hb: 8 to 10·9 g/dl.
§ Severe anaemia: Hb: < 8 g/dl.
Discussion
We developed a novel POC technique for Hb estimation using a pooled capillary blood sample coupled with a portable autoanalyser and validated it for the first time, by comparing with Hb measurements in a venous blood sample by two reference methods: the same autoanalyser or the direct cyanmethemoglobin method. In a cross-sectional study that included participants with a wide range of Hb values, we demonstrated that the Hb measurements by our POC method are in close agreement with venous blood Hb estimated by the reference methods. The blood sample-related bias measured by comparing Hb-C-AA with Hb-V-AA was trivial (mean difference 0·1 g/dl) with < 3 percentage point difference in estimated anaemia prevalence by the two methods. The analytical method-related bias (Hb-V-AA v. Hb-V-CM) was also negligible. Another novel aspect of the present study is the additional validation of our POC method in a longitudinal study by comparing the treatment related changes in Hb-C-AA with the changes in Hb-V-AA and Hb-V-CM measured at similar time points. The lack of significant difference between the post-treatment Hb increment estimated by the POC method and simultaneously measured Hb increments by the reference methods offers further confirmation of the validity of our POC method.
A large number of studies comparing capillary blood Hb measured by POC methods (mainly Hemocue) with venous blood Hb measured by reference methods (mainly autoanalyser) have been reported(Reference Neufeld, Larson and Kurpad3,Reference Abraham, Agrawal and Johnston5,Reference Rappaport, Karakochuk and Hess7,Reference Akhtar, Sherwani and Rahman18–Reference Hinnouho, Barffour and Wessells28) .These have shown both over- and underestimation of Hb by the POC method compared with reference methods, with a wide variation in the magnitude of the bias. Compared with most previous studies, the magnitude of blood sample-related bias in Hb estimation in our study was smaller (0·1 g/dl) and lower than the analytical CV. Moreover, the excellent concordance (> 0·90) between the Hb estimates by our POC method and the reference methods is comparable with that observed in previous studies comparing the venous and capillary blood Hb estimates by an autoanalyser in laboratory settings(Reference Rappaport, Karakochuk and Hess7,Reference Neufeld, García-Guerra and Sánchez-Francia24,Reference Hinnouho, Barffour and Wessells28) . The limits of agreement in the Bland–Altman analyses were, however, beyond the analytical CV suggesting that these methods should not be used interchangeably despite trivial differences in the mean Hb values.
The very low difference in the Hb estimates using the pooled capillary blood as compared with the venous blood in our study can be explained by multiple factors. First, the use of touch activated lancets with standard gauge and prick depth reduced the sampling variability. Second, the capillary and venous blood samples were collected within a few minutes of each other, in the same sitting position, thereby minimising intra-individual or diurnal variation, if any. Third, pooled capillary blood sample with 5–6 drops could have helped reducing the drop-to-drop variability as demonstrated by previous studies(Reference Conway, Hinchliffe and Earland12,Reference Mills and Meadows21,Reference Bond and Richards-Kortum29,Reference Whitehead, Zhang and Sternberg30) . Previous studies that have assessed the drop-to-drop variability in finger prick capillary samples compared with the pooled capillary sample as reference have shown that pooling drops of blood improves the precision of capillary blood Hb measurement when using a digital hemoglobinometer(Reference Conway, Hinchliffe and Earland12,Reference Mills and Meadows21,Reference Bond and Richards-Kortum29,Reference Whitehead, Zhang and Sternberg30) . One clear recommendation has been that the analysis of single drops of blood, even by experienced personnel, tends to give misleading results and should be discontinued(Reference Conway, Hinchliffe and Earland12).
Majority of the previous studies comparing capillary Hb by POC with venous Hb by a reference method in laboratory setting do not provide information on the bias related to the type of blood sample and analytical method. However, a few studies that compared the venous and capillary blood Hb using the same method have shown higher Hb in capillary than venous blood, in both adults and children(Reference Neufeld, García-Guerra and Sánchez-Francia24,Reference Hinnouho, Barffour and Wessells28) . It has been suggested that when a blood sample is collected using an optimal technique, Hb in capillary blood would be higher than that in the venous blood due to its deoxygenated nature(Reference Zavorsky, Cao and Mayo31). In contrast, it has also been suggested that a low capillary blood haematocrit, and therefore low Hb, occurs due to the Fahraeus effect, or plasma skimming due to phase separation of red cells and plasma at capillary bifurcations(Reference Fåhraeus32). Our study supports the former suggestion as we observed marginally higher mean Hb in capillary than in venous sample measured by an autoanalyser. This effect was more marked at higher Hb values, as reported by previous studies(Reference Fåhraeus32).
While using the venous blood sample, the analytical method-related difference in mean Hb (Hb-V-AA v. Hb-V-CM) was not significant. However, the scatterplot of Hb values (Fig. 2(c)) revealed that, compared with Hb-V-CM, Hb-V-AA values were slightly higher at lower Hb concentrations and slightly lower at higher Hb concentrations with an overlap at about 11·5 g/dl. This bidirectional difference between Hb-V-AA and Hb-V-CM could be due to differences in sensitivity of optical devices used for Hb measurement or due to difference in calibration range (three levels of calibration with autoanalyser v. a single-level calibration with direct cyanmethemoglobin).
The sensitivity and specificity of the POC methods used in large-scale surveys influence the estimates of anaemia prevalence and burden across the settings(Reference Neogi, Sharma and Pandey23). Moreover, the diagnostic accuracy of the Hb measurement impacts the correct identification of the individuals who should receive IFA treatment because in resource-poor settings Hb is the only indicator used for decisions on IFA treatment(15,Reference Whitehead, Mei and Mapango33) . It is thus important to use a method with high sensitivity and specificity for Hb estimation. Our POC method showed excellent sensitivity and specificity (both > 90 %) for classifying individuals in different grades of anaemia while using Hb-V-AA as the reference method. Only a few previous studies have provided information on sensitivity and specificity of the POC technique(Reference Akhtar, Sherwani and Rahman18–Reference Neogi, Sharma and Pandey23,Reference Sari, Pee and Martini25,Reference Toppo, Pal and Gour26,Reference Hinnouho, Barffour and Wessells28,Reference Shahshahani, Meraat and Mansouri34) and most of them, except the Van den Broek study(Reference van den Broek, Ntonya and Mhango27), have reported these diagnostic accuracy measures for classifying overall anaemia rather than grades of anaemia. Wide variation is observed in the sensitivity and specificity values, and only a few studies that used venous blood for POC Hb estimation have reported values above 90 %(Reference Boghani, Mei and Perry19,Reference Munoz, Romero and Gomez22) . Studies using capillary blood samples analysed by Hemocue have reported low sensitivity but high specificity(Reference Boghani, Mei and Perry19–Reference Mills and Meadows21,Reference Sari, Pee and Martini25,Reference Shahshahani, Meraat and Mansouri34) .
The bias in Hb estimates by our POC method compared with the reference methods differed at different Hb values similar to a few other studies(Reference Neufeld, Larson and Kurpad3). This variable bias may influence the intervention-related Hb increment as well as the change in anaemia prevalence as small differences in mean Hb values result in relatively larger differences in anaemia prevalence. These are crucial outcomes in many intervention studies and are also evaluated as time trends in successive rounds of large surveys. However, studies comparing Hb increments over time by different methods (but measuring baseline and endline Hb by the same method) have not been reported. Our longitudinal study validating the post-treatment Hb increment estimated by POC method against the reference methods bridges this important knowledge gap. The mean increment measured by Hb-C-AA (1·6 g/dl) was not different from the increment measured by Hb-V-AA and Hb-V-CM (both 1·7 g/dl), but the resultant reduction in anaemia was lower by 5 percentage points than that estimated by Hb-V-AA. Intervention programmes that evaluate the change in anaemia prevalence by capillary blood Hb estimates at multiple time points need to consider the variable bias at different Hb concentrations and its possible influence on estimated anaemia reduction. While it is clear that the single drop POC method is commonly used in evaluation of many interventions, our multi-drop POC method is able to estimate the post-intervention improvement in Hb with minimal bias compared with the reference method and may therefore be suitable for future community-based screening and treatment of anaemia.
Apart from the precise estimation of Hb, the portable POC autoanalyser offers other important advantages such as information on erythrocytes indices that could help identifying the cause of anaemia and information on other blood cells (leucocytes and platelets)(Reference Schalk, Heim and Koenigsmann35). We have also developed customised software for automated data transfer from the autoanalyzer to a computer to avoid data entry errors. The current cost of Hb estimation with these methods (Hb-C-AA:USA$ 1, Hb-V-AA and Hb-V-CM:USA$ 0·6 approximately) is higher compared with a digital hemoglobinometer(USA$ 0·5), but may reduce with economy of scale when used in population-based surveys and in screening programmes for treating anaemia.(Reference Augustine, Dasi and Palika13) Our study has a number of strengths including a large sample size and inclusion of participants with a wide range of Hb values covering different grades of anaemia. We were therefore able to examine differential bias in Hb estimates at different Hb concentrations. Additionally, our study design allowed measurement of blood sample-related and analytical method-related bias. Moreover, our longitudinal study validated the post-treatment Hb increments measured by the POC technique against reference methods, which has not been reported previously. A limitation is the inclusion of only adults; thus, the results may not be generalisable to other age groups.
Valid and robust methods of Hb estimation for population-based studies and large-scale surveys are crucial for guiding anaemia control programmes in developing countries. Our study demonstrates that a pooled capillary blood sample measured by an autoanalyser can estimate Hb values without significant bias as compared with the venous blood measurements by reference methods. The use of portable POC autoanalyser in population-level anaemia screening programmes can also help in more appropriate treatment. The RBC indices available from the autoanalyzer can assist identification of haemolytic or megaloblastic anaemia where IFA supplementation may be contraindicated or of limited value(Reference Buttarello36). As nutrition policies of many countries are closely linked to anaemia prevalence and changes in prevalence over time, the need for a valid, accurate and scalable POC method of Hb estimation cannot be overemphasised.
Acknowledgements
The authors would like to acknowledge the Indian Council of Medical Research for funding the study. The funder had no role in the design, analysis or writing of this article.
T. D. and R. P.: method standardisation, data acquisition and interpretation, T. D.: wrote the first draft, R. P. and B. K.: study design, method standardisation, data analysis and interpretation, reviewing and revising the manuscript; N. K. B.: data analysis and interpretation, D. J. P.: data acquisition, interpretation, A. S. P.: study design and data interpretation, L. F. A.: data acquisition and interpretation, A. V. K. and H. S. S.: guidance on study design, reviewing and revising the manuscript with critical intellectual input. All authors read and approved the final version of the manuscript.
There are no conflicts of interest.
Supplementary material
For supplementary material/s referred to in this article, please visit https://doi.org/10.1017/S0007114521004347