Homocysteine (Hcy) is an amino acid and a metabolic by-product formed by the conversion of methionine to cysteine(Reference Ohishi, Fujita and Suzuki1). The fasting plasma Hcy level in healthy adults is 5–15 μmol/l, and higher than 15 μmol/l is considered to be hyperhomocysteinaemia (HHcy)(Reference Ye, Zhang and Li2, Reference Maron and Loscalzo3). HHcy is significantly correlated with CVD(Reference Liu, Xuekelati and Zhou4, Reference Peng, Man and Xu5). In addition, HHcy is also associated with increased risks of Alzheimer’s disease and fracture(Reference Rochoy, Rivas and Chazard6, Reference van Wijngaarden, Swart and Enneman7). The supplementary of folic acid is the most commonly used method nowadays to reduce the concentration of Hcy(Reference Clarke8–Reference Anderson, Jee and Charleston12).
At home and abroad, the results of the study on supplementation of folic acid to reduce Hcy concentration were inconsistent(Reference Vijayakumar, Kim and Kim13–Reference Mao, Xing and Xu15). A previous study found that more than 40 % patients with HHcy failed to reach the normal level after folic acid supplementation(Reference Tian, Tian and Zhang16). These may be caused by genetics. Some studies have shown that genetic polymorphisms of key enzymes in folic acid/Hcy metabolism not only affect the level of baseline Hcy, but also affect the efficacy of folic acid in reducing Hcy(Reference Du, Tian and Tian17, Reference Qin, Li and Cui18). So far, studies on the efficacy of folic acid therapy have only explored the impacts of single nucleotide polymorphism (SNP), and there is a certain one-sidedness. Individual SNP have small effect on risk and have poor predictive ability(Reference Zupančič, Skok and Repnik19). To combine the relatively small effects of individual SNP and to better capture the complex relationship between genetics and the folic acid efficacy, the use of genetic risk score (GRS) has been proposed. There are two common approaches that can be used to determine the genetic risk based on risk-related SNP: (a) simple count genetic risk score (SC-GRS) and (b) weighted genetic risk score (wGRS)(Reference Talmud, Hingorani and Cooper20–Reference Gui, Wu and Han23).
There is no report on the relationship between GRS and the efficacy of folic acid therapy in patients with HHcy, and there is no research on the construction of a predictive model for the treatment of folic acid. In the present study, we seek to compare the two methods (SC-GRS and wGRS) in their ability to predict the efficacy of folic acid therapy. In addition, we used these methods to construct prediction models for the efficacy of folic acid therapy on HHcy and the best prediction model was screened out. The present study provides a scientific basis for more effective prevention and treatment of HHcy.
Methods
Study participants
The study involved 638 HHcy patients (Hcy ≥ 15 μmol/l). The detailed study design estimation had been described elsewhere(Reference Du, Tian and Tian17). We retrospectively analysed information on age, sex, smoking, alcohol consumption, disease history, biochemical indicators, genetic polymorphisms and so on. As described previously, the therapy was effective if patients’ Hcy levels decreased to 15 μmol/l or less, which put them in the success group. The therapy was unsuccessful if patients’ Hcy levels were greater than or equal to 15 μmol/l, which put them in the failure group(Reference Du, Tian and Tian17). The study was approved by the Ethics Review Committee of the Life Science of Zhengzhou University. All subjects or relatives signed informed consent.
Sample size
According to the relevant references, and with the effects of folic acid supplementation and efficacy-related gene polymorphisms on folic acid efficacy taken into consideration, a non-parametric matching design was adopted. The SNP with the lowest variation rate of genetic loci in the population was selected to estimate the sample size. Minor allele frequency P0 = 13 %, expected risk ratio (RR) = 2·0, α = 0·05 and β = 0·10. The formula is:
 $$n\; = \;2pq{({\rm{Z}}\alpha \; + \;{\rm{Z}}\beta )^2}/{({P_1} - {P_0})^2}$$
 $${P_1} = {P_0}RR/\left[ {1{\rm{ }} + {P_0}\left( {RR-1} \right)} \right]$$
 $$\overline p = 0.5\left( {{P_1} + {P_0}} \right);\overline q = 1 - \overline p$$
The sample size was approximately 300, with 150 in each group.
SNP selection and genotyping
We selected six previously identified SNP affecting the efficacy of folic acid therapy(Reference Du, Tian and Tian17, Reference Qin, Li and Cui18, Reference Liu, Chiang and Chen24–Reference Malinow, Nieto and Kruger27). All these SNP had minor allele frequency > 0·05 in the Chinese population. In addition, all these SNP also did not deviate from Hardy–Weinberg equilibrium. Genomic DNA was extracted using a whole blood genomic DNA extraction kit (Bio Teke®) according to the manufacturer’s protocol. Genotypes and alleles were detected using Sequenom’s MassArray system.
Assessment of genetic risk score
For the construction of GRS, each of the six SNP was initially examined for independent association with the efficacy in logistic regression. A GRS (GRS-6) was constructed based on all SNP. We also constructed another GRS (GRS-3) based on nominal significance and consistent direction of effect. The two most common used methods of genetic risk assessment were used for the evaluation of folic acid efficacy. The calculations of two methods are:
Method 1 (simple count genetic risk score)
The SC-GRS was the simplest methods. This method was easy to understand and the calculation was simple. The calculation did not involve any prior information of SNP effect. That is, SC-GRS was calculated by summing the number of risk alleles (0, 1 or 2) at each polymorphic locus.
Method 2 (weighted genetic risk score)
In this method, the different effects of SNP on efficacy of folic acid treatment for HHcy were considered. The weight (β-coefficient) in this method came from the existing original data, which was used to fit the logistic regression model and the estimated SNP effect in the model was used as the weight. The wGRS was calculated by multiplying the number of risk alleles (0 for homozygous of non-risk alleles, 1 for heterozygous of alleles and 2 for homozygous of the risk alleles) for each individual by each β-coefficient obtained from the logistic regression.
Statistical analysis
The significance of differences between the success group and the failure group was examined with Student’s t test or the χ2 test. The relationship between SNP and the efficacy of folic acid therapy for HHcy were examined using unconditioned logistic regression models with and without adjustment for different traditional risk factors. The GRS was modelled as a continuous variable or categorised into quintiles and used for analysis. We used logistic regression to simulate a model to differentiate folic acid intervention success and failure. This model was primarily used to identify the relationship between one or more independent variables and the dependent variable(Reference Shayan, Mohammad Gholi Mezerji and Shayan28). The form of this model was:
 $${\rm{Logit}}\left( P \right){\rm{ = log\bigg(}}{p \over {{\rm{1 - }}P}}{\rm{\bigg) = }}{\beta _{\rm{0}}}{\rm{+}}{\beta _{\rm{1}}}{{\rm{X}}_{\rm{1}}}{\rm{+}}{\beta _{\rm{2}}}{{\rm{X}}_{\rm{2}}}{\rm{+}} \cdots {\rm{+}}{\beta _{\rm{m}}}{{\rm{X}}_{\rm{m}}}$$
where P was the probability of intervention failure, β was parameter to be estimated and X was the independent variable. In multivariate analyses, logistic regression was used to evaluate two genetic risk assessment methods, adjusting for age, sex, BMI, smoking and alcohol consumption (model A); or age, sex, BMI, smoking, alcohol consumption, history of diabetes, history of hypertension, history of hyperlipidaemia, history of stroke and history of CHD (model B); or age, sex, BMI, smoking, alcohol consumption, history of diabetes, history of hypertension, history of hyperlipidaemia, history of stroke, history of CHD and biochemical indicators (model C); or BMI, smoking, history of diabetes, history of hypertension, history of CHD, total cholesterol, HDL-cholesterol and LDL-cholesterol (model D). We plotted receiver operating characteristic curves and the predictive ability of two methods of genetic risk assessment was evaluated using the area under the receiver operating curve (AUC) analyses(Reference Pencina, D’Agostino and D’Agostino29). We also calculated corresponding AUC for the different models with and without the SC-GRS/wGRS. The AUC were compared by Z-tests. All statistical analyses were performed using SPSS 23.0 (IBM Corporation) and MedCalc 15.2.2 (MedCalc Software). Two-sided P < 0·05 was considered statistically significant.
Results
Characteristics of the study participants
A total of 638 patients with HHcy were enrolled and they were on folic acid treatment at the start of research. After 3 months of the intervention of folic acid, the levels of Hcy in 325 patients were reduced to normal. The data on plasma Hcy concentration before and after the intervention are shown in Supplement Table 1. The baseline characteristics of participants in the success group and the failure group are summarised in Table 1. The individuals in the failure group are more likely to be smokers and had more disease history and higher BMI than those in the success group.
Table 1. Baseline characteristics of success group and failure group
(Mean values and standard deviations; numbers of participants and percentages)

FPG, fasting plasma glucose.
* Student’s t test.
Association between individual SNP and the efficacy of folic acid
In Table 2, for each SNP, we present the risk allele, effect size, OR and P values. We first examined the associations between the individual SNP and the efficacy of folic acid. Three SNP were associated with the failure of folic acid treatment. The differences remained significant even after adjusted for age, sex, BMI, smoking, drinking, history of diabetes, history of hypertension, history of CHD and biochemical indicators (Table 2).
Table 2. Association between individual SNP and the efficacy of folic acid*(Odds ratios and 95 % confidence intervals)

* Model A (age, sex, BMI, smoking, and alcohol consumption adjusted); model B (model A + history of diabetes, hypertension, hyperlipidaemia, stroke and CHD adjusted); model C (model A + model B + fasting plasma glucose, total cholesterol, TAG, HDL-cholesterol and LDL-cholesterol adjusted); model D: adjustment for the clinical variables independently associated with the efficacy of folic acid (BMI, smoking, history of diabetes, history of hypertension, history of CHD, total cholesterol, HDL-cholesterol and LDL-cholesterol adjusted).
Association between genetic risk score and the efficacy of folic acid
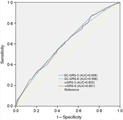
We evaluated the association of the joint effects of the three nominally statistical significant loci and all SNP with the efficacy of folic acid. We calculated a SC-GRS representing the sum of the risk alleles. The distribution of the number of risk alleles in the failure group and the success group is shown in Fig. 1. When risk alleles were more than four, the distribution of the failure group was greater than that of the success group. When GRS is modelled as continuous variables, we compare the association between GRS-3 and GRS-6 and the efficacy (Table 3). Compared with GRS-6, the association was strengthened and significant when GRS-3 was used. A similar conclusion could be drawn from Fig. 2. SC-GRS and wGRS were associated with the efficacy of folic acid in different regression models (Table 4). When age, sex, BMI, smoking, alcohol consumption, history of diabetes, history of hypertension, history of hyperlipidaemia, history of stroke and history of CHD were included in the model (model B), the association was strengthened and remained significant (Table 4). In model B, when the SC-GRS method was used, comparing with the subjects with the first GRS quartile, subjects with the second quartile (OR 2·82, 95 % CI 1·50, 5·29, P 0·001), third quartile (OR 2·37, 95 % CI 1·29, 4·36, P 0·006) and fourth quartile (OR 4·28, 95 % CI 2·25, 8·12, P < 0·001) had an increased risk of the failure of efficacy. In the wGRS method, comparing with the subjects with the first GRS quartile, subjects with the fourth quartile (OR 4·22, 95 % CI 2·23, 7·99, P < 0·001) had an increased risk of the failure of efficacy (model B). Using the SC-GRS method, per risk allele increased with a 1·46-fold increased failure risk (95 % CI 1·24, 1·73, P < 0·001) (model B). When using the wGRS method, per risk allele increased with a 2·01-fold increased failure risk (95 % CI 1·47, 2·74, P < 0·001) (Table 4).

Fig. 1. Distribution of the number of risk alleles between the failure group (![]() ) and success group (
) and success group (![]() ).
).
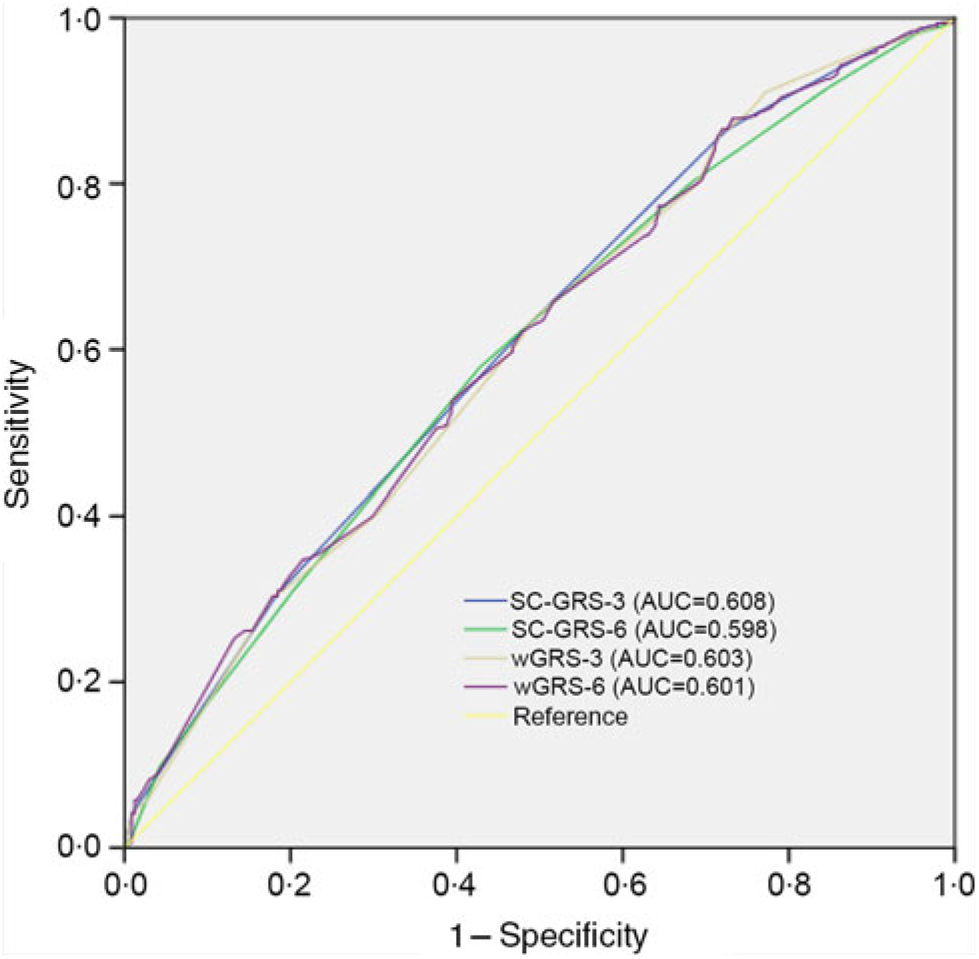
Fig. 2. Receiver operating characteristic curves for the efficacy discrimination using genetic risk score (GRS)-3 as compared with GRS-6. The weighted GRS (wGRS) are based on logistic regression models adjusting for age, sex, BMI, smoking, alcohol consumption, history of diabetes, history of hypertension, history of hyperlipidaemia, history of stroke and history of CHD. SC-GRS, simple count genetic risk score; AUC, area under the receiver operating curve.
Table 3. Association of genetic risk score (GRS)-3 and GRS-6 with the efficacy of folic acid(Odds ratios and 95 % confidence intervals)

SC-GRS, simple count GRS; wGRS, weighted GRS.
* P values were calculated by logistic regression analysis with adjustment for age, sex, BMI, smoking, alcohol consumption, history of diabetes, history of hypertension, history of hyperlipidaemia, history of stroke and history of CHD.
Table 4. Association of simple count genetic risk score (SC-GRS) and weighted genetic risk score (wGRS; GRS-3) with the efficacy in different models†(Odds ratios and 95 % confidence intervals)

* P value for trend.
† Model A (age, sex, BMI, smoking and alcohol consumption adjusted); model B (model A + history of diabetes, hypertension, hyperlipidaemia, stroke and CHD adjusted); model C (model A + model B + fasting plasma glucose, total cholesterol, TAG, HDL-cholesterol and LDL-cholesterol adjusted); model D (BMI, smoking, history of diabetes, history of hypertension, history of CHD, total cholesterol, HDL-cholesterol and LDL-cholesterol adjusted).
The predictive capability analysis of genetic risk score and the conventional risk factors
We examined the predictive ability of the GRS for the efficacy in different models (Fig. 3). Adding SC-GRS or wGRS to the different models resulted in improvement in risk discrimination of the failure of folic acid efficacy (Table 5). The addition of the SC-GRS or wGRS to the traditional risk factors (age, sex, BMI, smoking, alcohol consumption, history of diabetes, hypertension, hyperlipidaemia, stroke and CHD) slightly improved the AUC from 0·846 to 0·859 (P = 0·015 and P = 0·014, respectively, model B; Table 5). We got similar results from model C (Table 5). The AUC using wGRS was not significantly improved as compared with the SC-GRS in different models (P = 0·062, P = 0·815, P = 0·591, P = 0·613, respectively).
Table 5. AUC with and without genetic risk score in different models§(Areas under the curve and 95 % confidence intervals)

SC-GRS, simple count genetic risk score; wGRS, weighted genetic risk score.
* Comparing AUC between traditional risk factors and traditional risk factors + SC-GRS.
† Comparing AUC between traditional risk factors and traditional risk factors + wGRS.
‡ Comparing AUC between traditional risk factors + SC-GRS and traditional risk factors + wGRS.
§ Model A (age, sex, BMI, smoking and alcohol consumption adjusted); model B (model A + history of diabetes, hypertension, hyperlipidaemia, stroke and CHD adjusted); model C (model A + model B + fasting plasma glucose, total cholesterol, TAG, HDL-cholesterol and LDL-cholesterol adjusted); model D (BMI, smoking, history of diabetes, history of hypertension, history of CHD, total cholesterol, HDL-cholesterol and LDL-cholesterol adjusted).
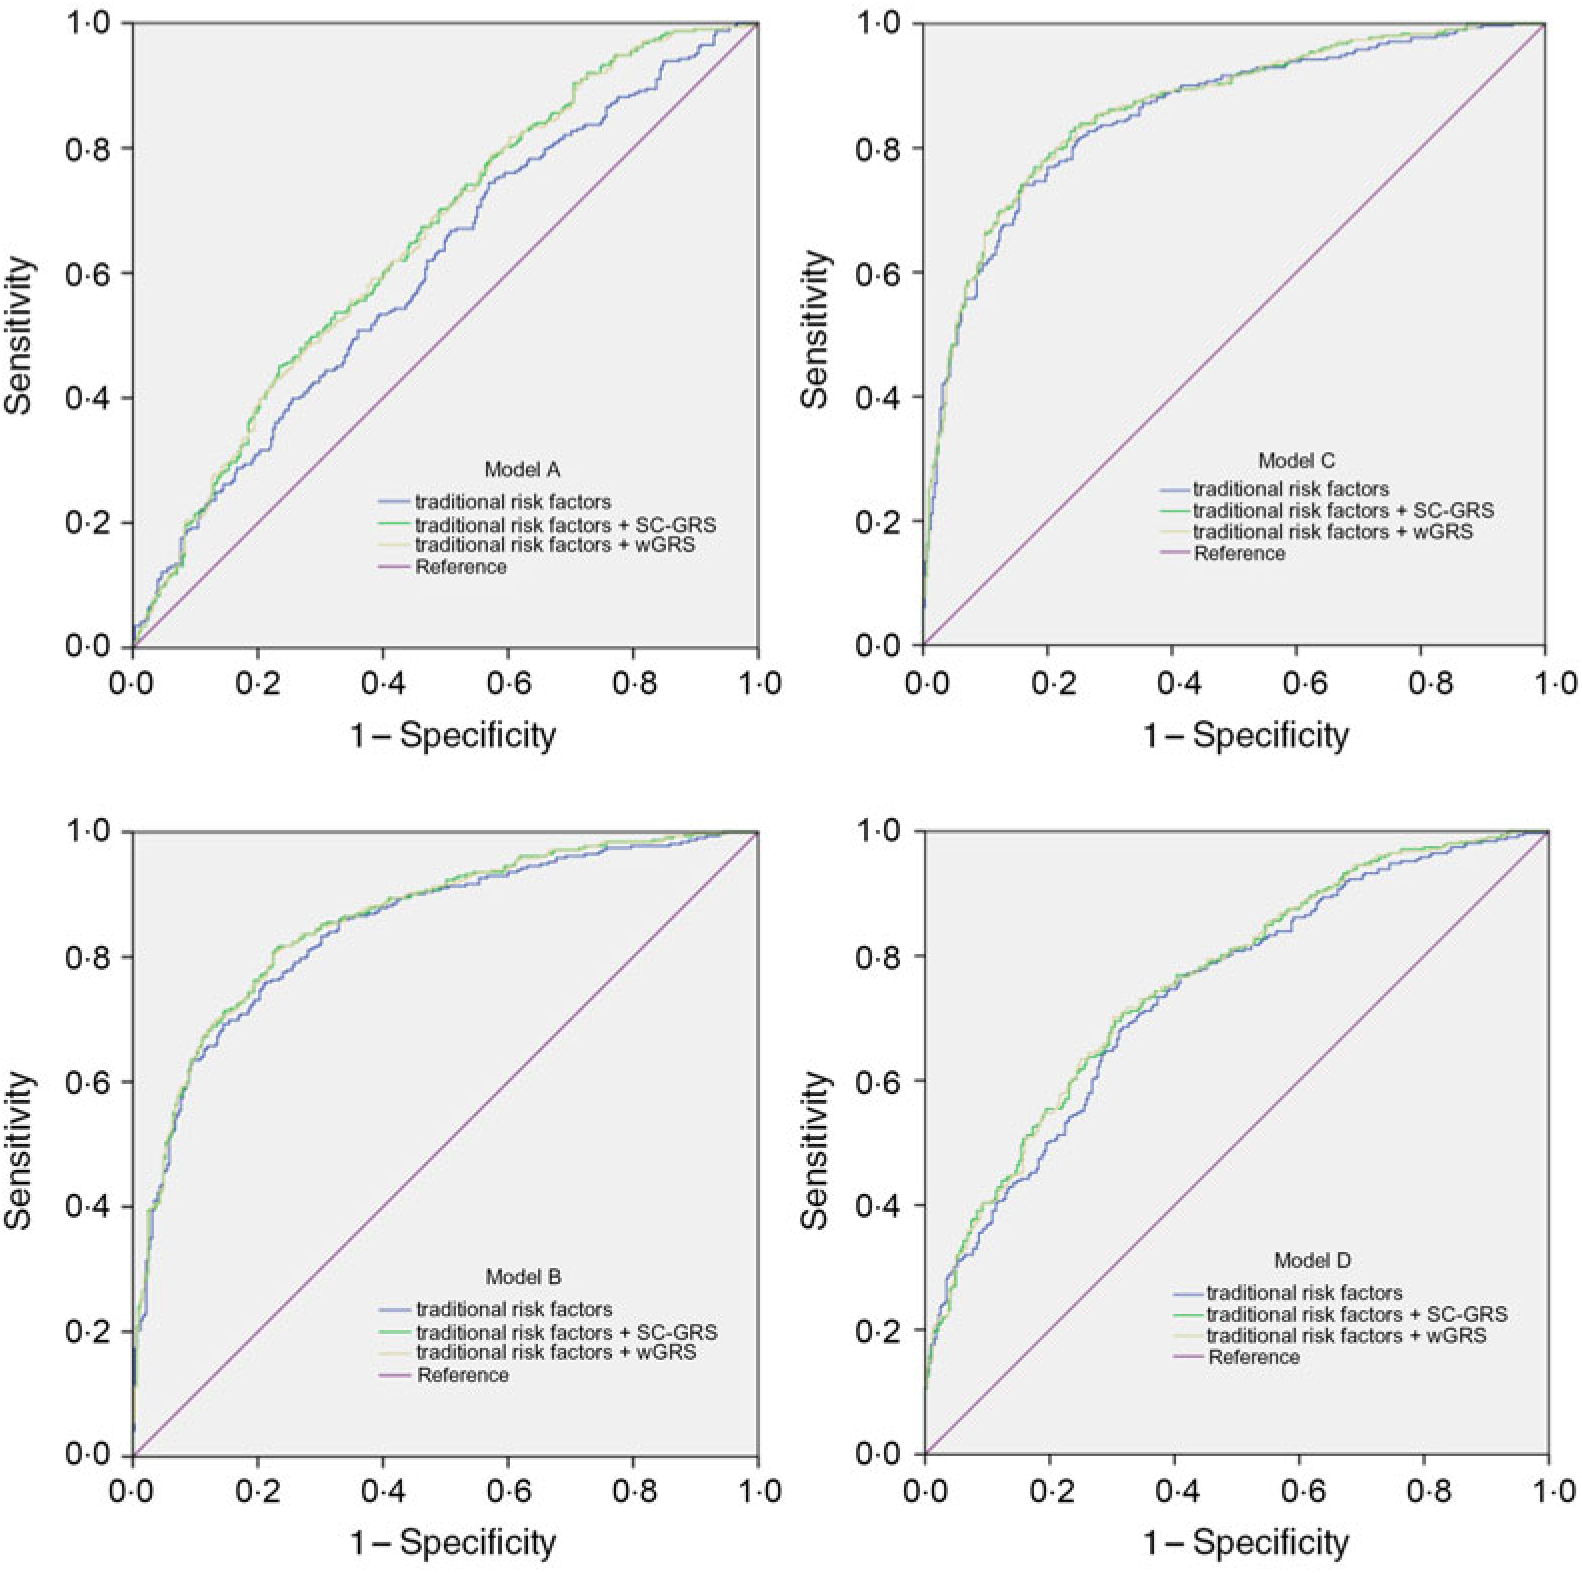
Fig. 3. Receiver operating characteristic curves for the efficacy of folate. The curves are based on logistic regression models incorporating traditional risk factors with and without the genetic risk score (simple count genetic risk score (SC-GRS) and weighted genetic risk score (wGRS)). Model A (traditional risk factors, including age, sex, BMI, smoking and alcohol consumption); model B (traditional risk factors, including age, sex, BMI, smoking and alcohol consumption, history of diabetes, hypertension, hyperlipidaemia, stroke and CHD); model C (traditional risk factors, including age, sex, BMI, smoking and alcohol consumption, history of diabetes, hypertension, hyperlipidaemia, stroke, CHD, fasting plasma glucose, total cholesterol, TAG, HDL-cholesterol and LDL-cholesterol); model D (traditional risk factors, including BMI, smoking, history of diabetes, history of hypertension, history of CHD, total cholesterol, HDL-cholesterol and LDL-cholesterol).
Discussion
In the present study, two common GRS methods (SC-GRS and wGRS) based on three significant SNP were associated with the risk of folic acid efficacy in different models. The optimal predictive model was the model which included GRS and adjusted for traditional factors, including age, sex, BMI, smoking and alcohol consumption, history of diabetes, hypertension, hyperlipidaemia, stroke and CHD. In addition, the two common GRS methods (SC-GRS and wGRS) improved risk prediction of folic acid efficacy when assessment by the C-statistic (AUC) in four models.
In our study, the GRS methods we selected were SC-GRS and wGRS. There were five commonly used GRS methods such as SC-GRS, OR weighted GRS (OR-GRS), direct logistic regression genetic risk score (DL-GRS), polygenic genetic risk score (PG-GRS) and explained variance weighted genetic risk score (EV-GRS). It is worth mentioning that the wGRS and DL-GRS were the same calculation methods. They were just different names in our research. The OR-GRS was calculated in the same way as DL-GRS, but the sources of weight (log(OR)) were different. The OR were usually derived from meta-analysis or genome-wide association studies(Reference Yarwood, Han and Raychaudhuri30–Reference Curtit, Pivot and Henriques33), that is, it relied on external data rather than original data. Similarly, The EV-GRS method also relied on external data(Reference Che and Motsinger-Reif34). However, we had original research data. The PG-GRS method was mostly used when there were many SNP selected(Reference Hachiya, Kamatani and Takahashi35). It is more flexible if the underlying genetic mode is unknown(Reference Che and Motsinger-Reif34). Therefore, in our study, we selected two GRS methods, SC-GRS and wGRS (DL-GRS), to analyse the efficacy on efficacy of folic acid treatment for HHcy.
The direction of the six SNP affecting the efficacy of folic acid therapy was consistent with previous studies(Reference Du, Tian and Tian17, Reference Qin, Li and Cui18, Reference Liu, Chiang and Chen24–Reference Malinow, Nieto and Kruger27). Especially, three SNP (rs1801131, rs1801133 and rs1801394) showed significant association with the folic acid efficacy. The present study also indicated that the joint effects of these SNP had significant influence on the failure of folic acid efficacy. We analysed the association between GRS and efficacy by adjusting for different traditional risk factors. We found that the OR was higher in model B (age, sex, BMI, smoking, alcohol consumption, history of diabetes, history of hypertension, history of hyperlipidaemia, history of stroke and history of CHD adjusted) compared with model A (age, sex, BMI, smoking and alcohol consumption adjusted) and model C (age, sex, BMI, smoking, alcohol consumption, history of diabetes, history of hypertension, history of hyperlipidaemia, history of stroke and history of CHD and biochemical indicators adjusted) and model D (BMI, smoking, history of diabetes, history of hypertension, history of CHD, total cholesterol, HDL-cholesterol and LDL-cholesterol adjusted). Similarly, compared with model C and model D, the predictive ability is higher in model B. This result also showed that adjusting for traditional risk factors that have an effect on the efficacy did not improve the predictive ability. This may be due to the existence of confounding factors affecting the results of the study. However, it is not the more significant results you will get when adjusting for more factors. A study had showed that when they adjusted for more factors, the association was somewhat attenuated(Reference Fava, Sjögren and Olsson21).
GRS were often analysed as continuous and categorical variables, and the results of the two methods were all taken into account rather than only as the continuous or categorical variables(Reference Gui, Wu and Han23, Reference Hayato and Melander36, Reference Riesmeijer, Manley and Ng37). Therefore, we analysed the GRS as the continuous variables and the categorical variables, respectively. In model B, when the GRS was modelled as a continuous variable, we found that per risk allele increased with a 1·46-fold increased failure risk using SC-GRS method and per risk allele increased with a 2·01-fold increased failure risk using wGRS. In contrast, the subjects in the top quartile of SC-GRS had 4·28-fold increased failure risk compared with those in the lowest quartile in model B. The subjects in the top quartile of wGRS had 4·22-fold increased failure risk compared with those in the lowest quartile in model B. In addition, for predictive ability, SC-GRS and wGRS had no statistically significantly different. This is different from previous studies. Previous studies had always showed that weighted GRS had more significantly different than unweighted GRS(Reference Gui, Wu and Han23, Reference Conran, Na and Chen38, Reference Cox, Hsu and Ng39). The reason why the results were inconsistent may be the insufficient number of SNP we selected. Further studies are needed to analyse the association between GRS and folic acid efficacy by selecting more SNP.
The present study aimed to resolve some of the issues found in disease prevention, and it has theoretical and practical value. Currently, only some studies have identified SNP associated with the efficacy of folic acid lowering HHcy. No studies have combined individual SNP to explore their association with the folic acid efficacy. We used four models to determine the optimal prediction model and we also compared two common GRS methods. However, several limitations of the present study need to be considered. First, folic acid is also ingested in the human diet, however, without a consumption assessment. In addition, we did not collect other vitamins (B6 and B12) information, which may be involved in the metabolic pathway affected by the intervention. Second, there is a lack of more SNP related to the folic acid efficacy. That may lead to inaccurate results. Finally, the external validation of the present study results in the prospective cohort study is needed in the future.
Conclusions
We found that the addition of a wGRS to a conventional risk factor-based model (age, sex, BMI, smoking, alcohol consumption, history of diabetes, history of hypertension, history of hyperlipidaemia, history of stroke and history of CHD adjusted) significantly improved predictive performance with C-statistic of 0·859. We believe that the precise prediction model will be useful for clinicians to estimate an individual’s risk for failure of folic acid efficacy with high precision.
Acknowledgements
Funding was provided by the Department of Science and Technology of Henan Province (no. 132102310431). The Department of Science and Technology of Henan Province had no role in the design, analysis or writing of this article.
We thank all staff from the Department of Neurology, the Fifth Affiliated Hospital of Zhengzhou University, for their assistance and support.
The authors’ responsibilities were: B. D. had full access to all the data in the study and takes responsibility for the integrity of the data and the accuracy of the data analysis; B. D. and W. Z.: study concept and design; L. Y., B. R. and Y. H.: acquisition of data; C. Z., Q. Z. and D. L.: analysis and interpretation of the data; and W. Z.: study supervision. All authors read and approved the final manuscript.
None of the authors had a conflict of interest.
Supplementary material
To view supplementary material for this article, please visit https://doi.org/10.1017/S0007114519000783